Fiji · Laucala Bay
And the name I used now belongs to a different reef.
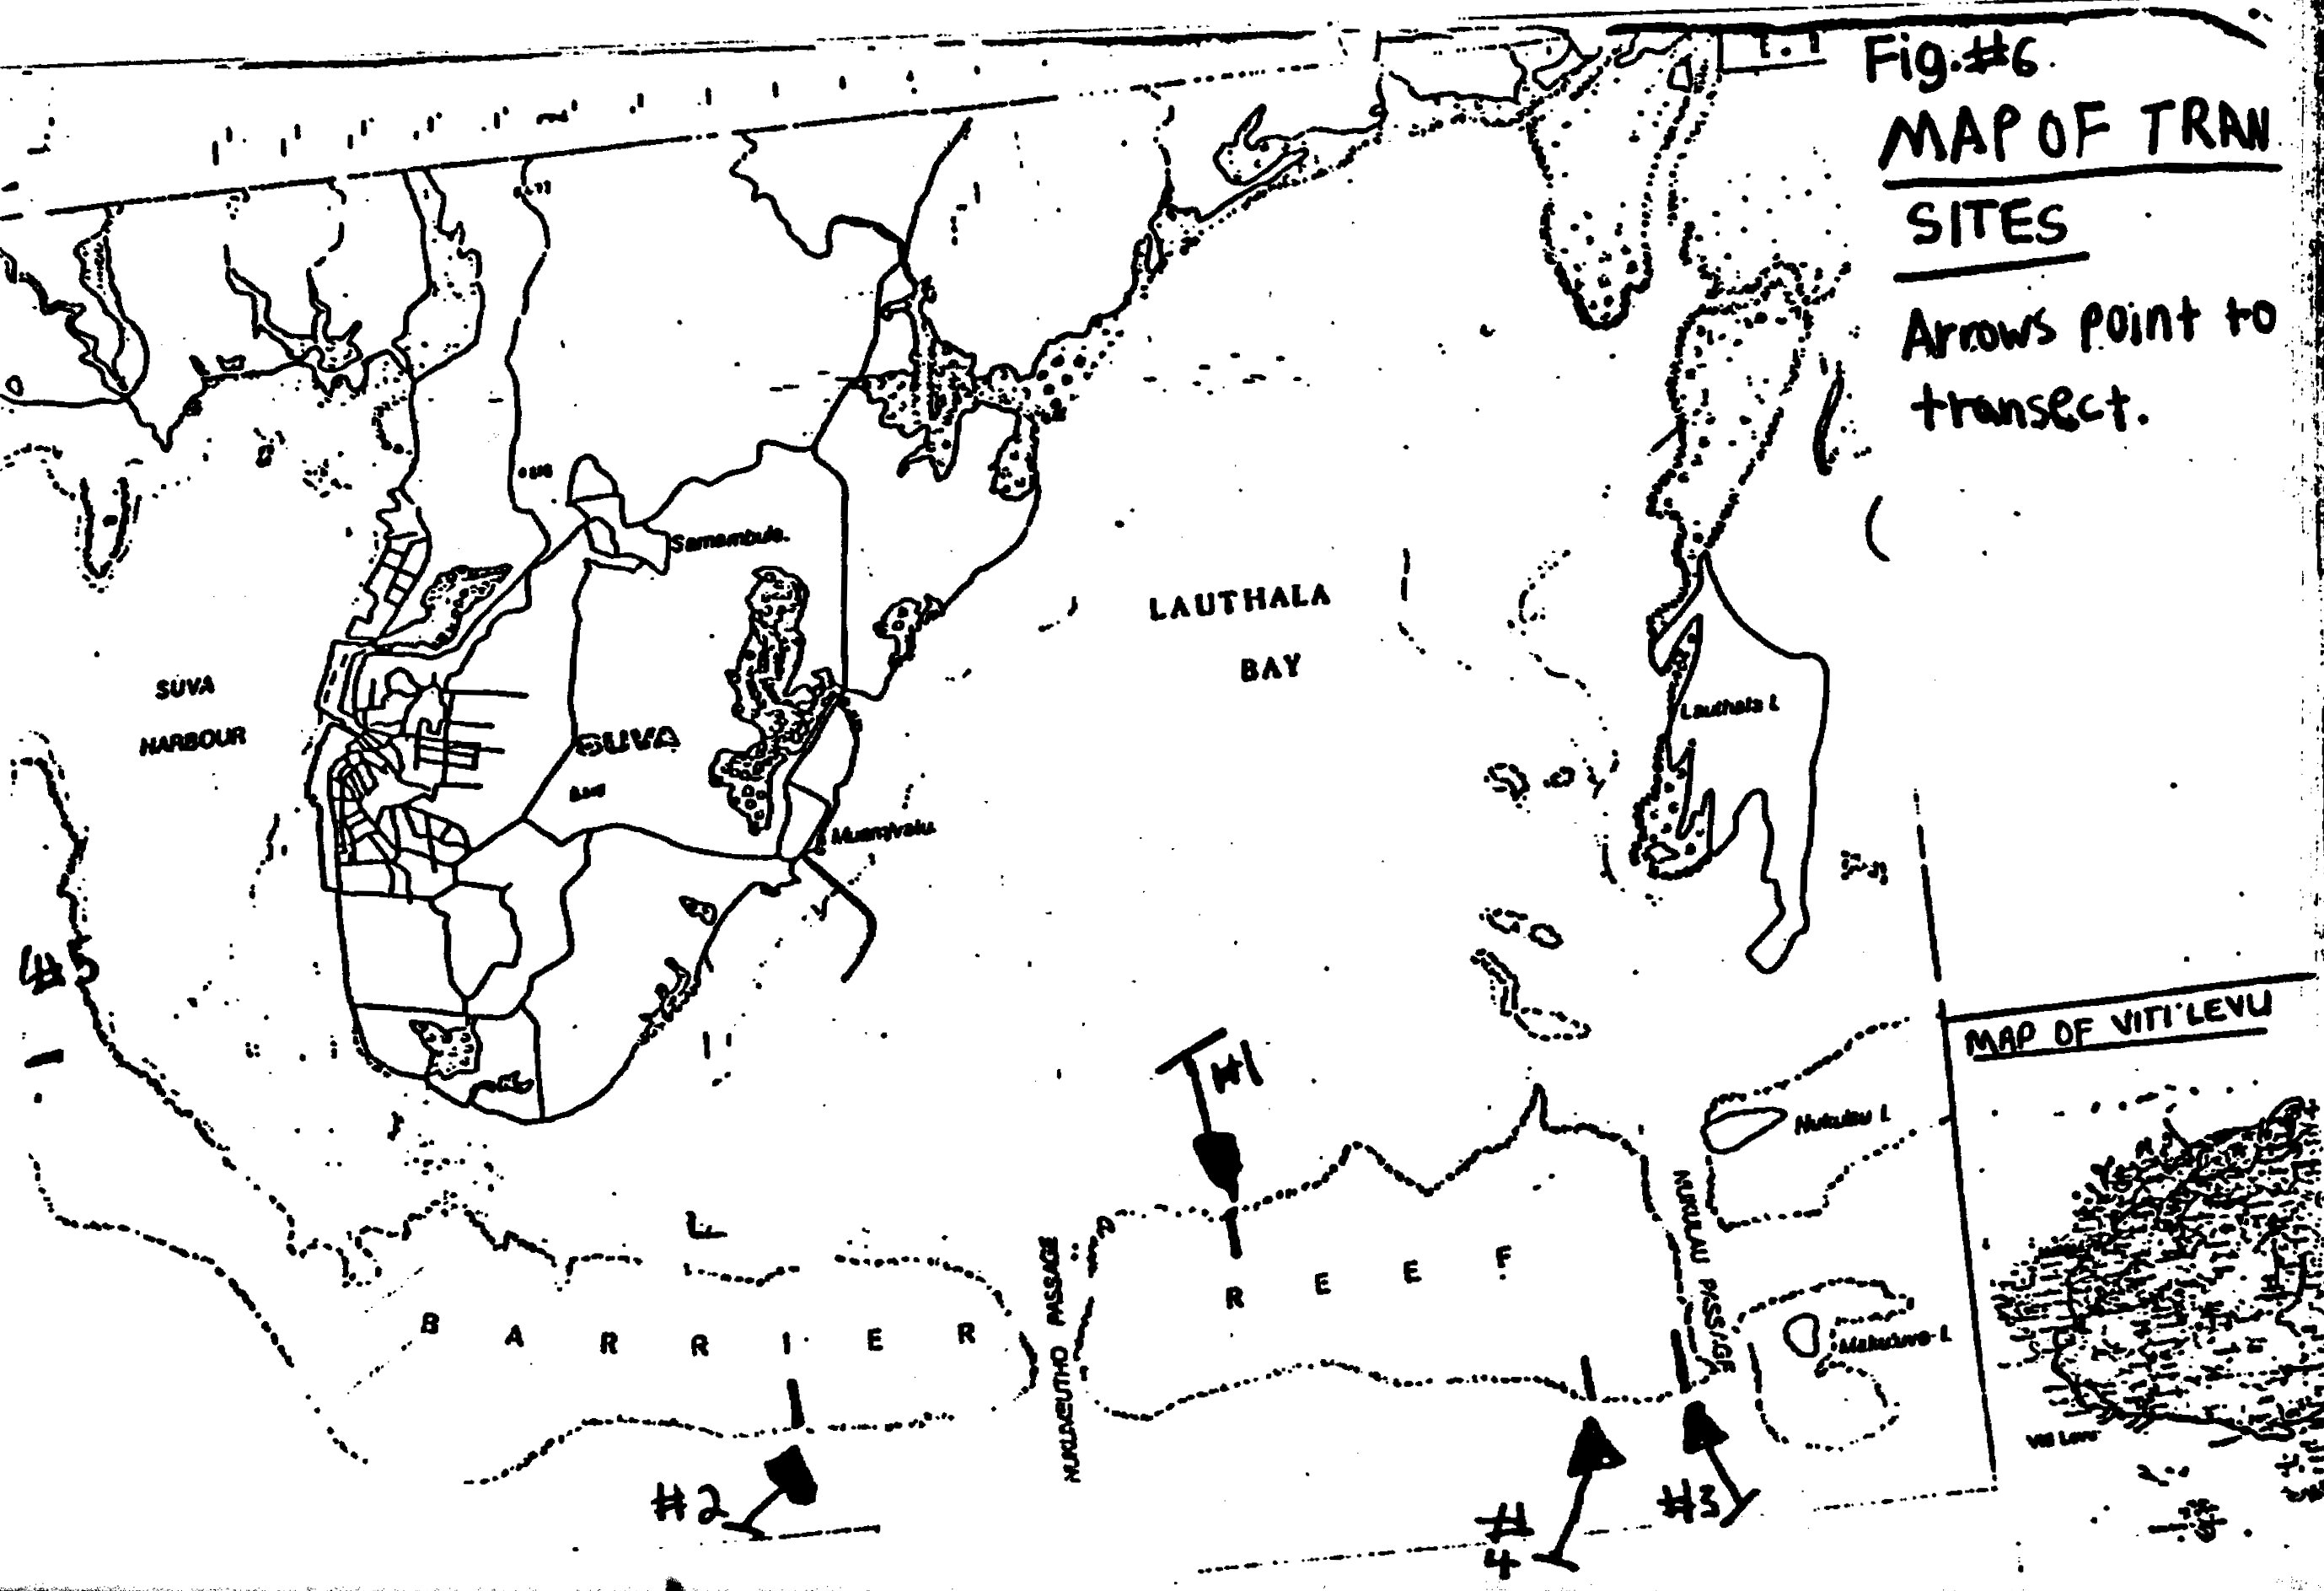
In the austral spring of 1994 — probably; the year is not recorded in the chapter — I walked five 100-metre line-intercept transects across a reef flat off Laucala Bay at low tide, scoring the benthos at every change under the tape. The chapter calls the reef “in a general state of unhealth” and names three causes: a hurricane, effluent from Suva, and low salinity.
Thirty years later, one of those three is well supported, one has resolved into a specific named storm that makes the case stronger than it was argued, and one does not survive contact with later instruments.
The transects were laid roughly parallel to the reef crest with two fifty-metre fibreglass tapes pegged to the substrate, worked on foot from mid-August to mid-October on Thursday mornings. I anchored the start point the moment I left the boat, deliberately, so that the ground was not chosen by eye. Sites were picked by a local marine specialist. A two-way balanced ANOVA found significant differences between transects and none for position along a transect: the reef varied between sites, not along them.
rck, rock — the coralline-algae code
appears nowhere in the dataset. The likeliest reading is that an encrusted reef pavement was
scored as rock, but the narrative and the coded category are not the same thing, so charts
render rock and footnote the interpretation rather than silently relabelling it.The chapter is Chapter Three; the transect composition is re-plotted from the original spreadsheet in the data section.
In 2024 researchers based at the University of the South Pacific, on the Laucala Bay campus, published the systematic review the 1996 chapter had asked for: an ecological history of every study of the reefs around Suva, 87 candidate documents narrowed to 67 spanning 1950 to 2023 (Dehm et al. 2024). It settles the geography.
The reef enclosing Laucala Bay is the Laucala Barrier Reef system — Sosoikula, Nukubuco, Nukulau and Makaluva Reefs, about 10.5 km² in total, of which roughly 60% is outer reef flat, the zone I worked. Nukubuco forms its central segment. The name Suva Barrier Reef, as used in the modern literature, denotes a different structure: mainly Nawadada Reef, partly enclosing Suva Harbour on the other side of the peninsula. A modern paper that says “Suva Barrier Reef” is usually not talking about the reef in this chapter. A modern paper that says “Nukubuco” is.
That the reef in the chapter is the Laucala system is an inference, and is labelled as one here. The grounds are that the study is placed off Laucala Bay, that transect three is sheltered by Nukulau and Makaluva, and that transect five is closest to Suva, where Sosoikula Reef runs up against the eastern peninsula. All five transects are consistent with the Laucala system and none requires any other — but it cannot be confirmed until the site map is recovered.
The review’s other finding matters more. Scientific effort on these reefs, it concludes, has largely “left temporal changes and ecological responses largely unexplored” (Dehm et al. 2024), and its headline recommendation is a systematic baseline survey and a sustained monitoring framework. That is, almost word for word, the recommendation Chapter Three closes with in 1996.
Between mid-April and early July 2000, a large team surveyed nineteen reef locations in eight regions of Fiji during what turned out to be the country’s first recorded mass coral bleaching event (Cumming et al., 2000/2002 — the symposium was held in 2000 and the proceedings appeared in 2002, and the literature cites it both ways). Nationally, 64% of scleractinian colonies surveyed were bleached, partly bleached, or recently dead from bleaching. The south and east — the Suva sector — were worst, with more than 80% of colonies affected.
Two of the nineteen sites were at Suva, and one of them was Nukubuco Reef crest. At Nukubuco, 100% of colonies were bleached at both sites surveyed, and 65% of the dominant Acropora aspera colonies were dead by August 2000. In situ seawater temperature had been logged at Suva since September 1996; Suva’s maximum monthly mean is 28.5 °C, and in 2000 temperatures stayed above it for five months and peaked at 30–30.5 °C, against a bleaching threshold the paper puts at 29.5–30 °C.
This is the closest thing to a return that exists. It is the same reef structure, surveyed by people who knew what they were doing, four to six years after my fieldwork — but on the crest rather than the flat, and by belt transect and tagged colonies rather than line intercept. It is not a repeat of my study and cannot be treated as one.
One figure needs disentangling, because it circulates attached to the wrong reef. The often quoted loss of about 30% of coral cover and 45% of coral colonies — repeated for instance in Shiiba et al. (2023) — belongs to the outer reef slope at the harbour entrance, not to the Laucala Bay reef flat.
The chapter blames “the 1992 hurricane” three times, without a citation, and ranks it as the primary cause of the dead coral. Its evidence is a shelter gradient: the transects screened by Nukulau and Makaluva carried more live coral and more diversity, and the exposed ones carried more dead coral and rubble.
Three storms are candidates. Tropical Cyclone Fran (March 1992) passed about 400 km north of Suva. Tropical Cyclone Joni (December 1992) passed about 55 km west of Viti Levu and left south-eastern Viti Levu and Suva minimally affected. Tropical Cyclone Kina (23 December 1992 – 5 January 1993) passed between Viti Levu and Vanua Levu and directly over Levuka on the night of 2 January 1993. Kina is the storm that hit Suva: widespread damage along the Suva coastal strip, two bridges on the Suva–airport road collapsed, all four major Viti Levu rivers in flood including the Rewa, roughly 1,040 mm of rain at Monasavu dam, 23 deaths, and the name retired. Those damage figures come from a general reference work; the contemporary situation reports were not opened during the research pass, so treat them as indicative rather than as the primary record.
This is inference from track and damage records, not something I ever said, and the Fiji Meteorological Service or IBTrACS track data would settle it definitively. But if it is right it strengthens the chapter rather than correcting it. Kina’s signature at Suva was not only wave energy but a catastrophic Rewa River flood plume — freshwater and sediment dumped straight into Laucala Bay. My hurricane hypothesis and my freshwater hypothesis would then not be two competing explanations but one event.
The edition therefore says Cyclone Kina (December 1992 – January 1993) and notes the discrepancy, rather than either silently correcting me or silently repeating a date whose damaging passage fell in the following year.
I argued from cover data alone that Suva’s effluent was driving algal growth: algae accumulated on the transect facing the lagoon and on the transect beside a passage carrying lagoon water out, and not at all on the one transect with no lagoon connection. I noted a dull distorted haze in the water at the passage and was explicit that water tests were needed before this could be called a finding.
The tests exist now. A year-long survey of nutrients and water properties across the Greater Suva urban marine environment (Dehm et al. 2025) found that the Kinoya sewage treatment plant outfall, which discharges into Laucala Bay, is statistically its own water body.
The longer-run picture, as compiled in the 2024 review, is worse than a single outfall. Two wastewater treatment plants serve the whole Greater Suva urban area — a conurbation of 268,432 people at the 2017 census — and between them cover 27–36% of the population. Faecal coliform densities in Suva Harbour and Laucala Bay have ranged from zero to 410,000 CFU per 100 mL with minimal change between 1978 and 2005, against a national general wastewater limit of 400. Iron in the Laucala Bay marine environment has risen by up to 500% since the 1980s (Pratap et al. 2020). And the Laucala reefs sit in measurably more turbid, higher-suspended-solids water than the harbour-side reefs, which is direct support for my sedimentation argument.
A separate study on the other side of the peninsula, in Suva Harbour, measured the mechanism I could only infer. Over twelve months, macroalgal cover at the municipal site rose from 5.56% to 27.81% while the remote site stayed at effectively zero, with sedimentation nearly double and mean light less than a third (Lal et al. 2018). Coral recruitment, notably, did not differ between the two. That study is corroborating, not a revisit.
This is the weakest number in the chapter and it needs saying plainly, because it underpins one of my three conclusions. I report a mean salinity of 23.6 ppt across the five sites, taken in August–October — the dry-cool season — with the highest reading of 31 ppt at transect one, which I found anomalous and attributed to a preceding dry spell.
Later instrumented work on the same water body in the same season does not agree. Singh & Aung (2008) report 33.7 PSU near the head of Laucala Bay in the dry-cool season — a figure read from a search-result summary rather than from the paper itself, which is worth knowing, because this section rests partly on it. The 2025 survey gives dry-season averages of 27.2 to 35.4 PSU across the Greater Suva area, with the lowest annual figure anywhere — right at the Vunidawa distributary mouth — at 26.00 ± 1.46 PSU. My mean sits below the lowest annual value a modern CTD has recorded at the freshest point in the bay.
Three readings are possible and the edition offers them without choosing. The salinometer may have been reading low: a field conductivity meter needs calibration, and a systematic offset would explain why four of five readings clustered low while the one I found anomalous, at 31 ppt, is exactly in line with modern dry-season values — on that reading the 31 is the good number. Or the freshening may have been real, local and short-lived, a shallow lens over the flat I was walking at low tide rather than the water column a CTD profiles. Or the bay was genuinely fresher then, for which there is no evidence and which would require a large change in Rewa discharge.
So my low-salinity conclusion is presented here as unverified, with the later measurements alongside it. My temperature figure, by contrast, holds: a mean of 25.8 °C against 24.5–25.5 °C for the dry-cool season in the later work. Ruling temperature out for that season was correct. The 2000 bleaching, peaking at 30–30.5 °C in March and April, shows exactly where the temperature danger lay — in a season I was never there to sample.
This is the central limitation of the whole Fiji lane and it belongs in the open, not in a footnote.
No coordinates exist in the surviving record. The chapter refers repeatedly to a site map of the transects, but never gives latitude and longitude in the text, and the map itself is probably stored as a vector object inside the 2005 Word file, still unextracted. Until it is recovered and georeferenced against a modern chart, it is not possible to say which of Sosoikula, Nukubuco, Nukulau or Makaluva each transect sat on.
There are no permanent markers. The tapes were pegged to the substrate for a morning and removed. There is nothing to go back to.
The fieldwork year is not recorded. The Methods give only “mid August to mid October on Thursday mornings.” The internal evidence — a recent cyclone I dates to 1992, the April 1996 file dates of the Hampshire thesis, the exchange to the University of the South Pacific described in the acknowledgments — puts it in the austral spring of 1993, 1994 or 1995, with 1994 the most likely. That is inference, and it is worth resolving, because it determines which cyclone I saw and which thermal record applies.
There is one modern benthic-cover number for this reef: the Allen Coral Atlas satellite product gives 11.02% coral cover for the Laucala system in 2022. It must not be set beside my 33.9%. One is an area-integrated remote-sensing classification over a whole 10.5 km² reef system; the other is per-cent cover along a hundred-metre tape on the reef flat. Calling the difference a decline would be an error of method, not a finding.
And the gap is not an artefact of searching. Within its own span, the 2024 systematic review of 67 documents covering 1950 to 2023 found the same absence: no field bleaching assessment or benthic survey for Nukubuco or the Laucala reefs after 2001 — not for 2002, not for 2014–16, not for 2023–24. For 2026, the record-heat year, the 2026 research pass behind this page found nothing either; that is a negative result from one search, not a published finding.
NOAA’s Coral Reef Watch programme has run a daily virtual station for Fiji since 1985. Taking the annual maximum of accumulated heat stress from its raw series gives the shape of the last forty-one years. These annual maxima were computed during the 2026 research pass from the raw NOAA file; they are not a published table, and the station box is centred on northern Fiji rather than Suva, because no Suva-specific virtual station exists. With both caveats applied, the record says five things.
For regional context, the Global Coral Reef Monitoring Network’s 2020 status report puts average Pacific hard coral cover at 37.0–37.7% before 1998, declining to 31.3% by 2019, with 90% of that decline falling between 2010–14 and 2015–19. Fiji sits in a Pacific subregion the report classes as stable. The report gives no Fiji-specific coral cover figure.
On integrating ecology with people: the reef itself made the case
The 1996 method was to read a pollution gradient off a benthic-cover gradient and then argue that the causes were urban, economic and infrastructural rather than purely ecological. The definitive modern review of these reefs organises itself around four driver classes — climate, pollution, “ocean creep” in the form of reclamation and coastal development, and resource exploitation — three of which are socio-economic. The framing I had to argue for is now the default.
More pointedly, the review’s complaint is that the work still has not been done, and its recommendations are my closing recommendations restated by university researchers twenty-eight years later. A five-transect undergraduate study in the mid-1990s was, on that evidence, an attempt at precisely the thing three decades of subsequent work has still not delivered for this reef.
Where the chapter is wrong, it is wrong in an interesting way. It ranks the cyclone first and urban effluent second, and considered thermal stress only to rule out cold. The record inverts that order: thermal stress first, chronic urban loading second, cyclones third. But I cannot reasonably be faulted for it. Fiji had no recorded mass bleaching event until 2000, and heat stress during my fieldwork window was effectively nil. I diagnosed the era correctly, and then the era changed under the reef.
On participatory management: Fiji built it, at scale, and it is Fiji’s own
Fiji’s first locally-managed marine area was established at Ucunivanua village, Verata, in 1997 — a 24-hectare no-take zone closed for three years by traditional ceremony and managed by a team of twenty local men and women with the chief and elders. The project was led by researchers at the University of the South Pacific in Suva, through its Institute of Applied Science. The trigger was social rather than scientific: the women of the village were spending steadily longer collecting clams. The FLMMA network formed in 2001 and won an Equator Prize in 2002. Its practice combines action planning with both biological and socio-economic monitoring — which is the thesis’s method as well as its conclusion.
The law followed, in the same year I submitted the master’s paper. Fiji’s Environment Management Act 2005 requires the Council to establish a Resource Owners Committee (s.8(4)) and requires a public hearing in the vicinity of a proposed development once an environmental impact assessment is complete (s.34(1)), with public inspection of the report and appeal to an Environmental Tribunal. The National Biodiversity Strategy and Action Plan 2020–2025 set a target of 100% of inshore traditional fishing grounds effectively managed within locally managed areas by 2025, and the Climate Change Act 2021 makes the 30% marine-protected-area commitment statutory.
And it was tested on a reef in my own city. A study of the tabu at Navakavu, on the Muaivuso peninsula inside the same Greater Suva marine environment, found that the closure significantly increased stocks of certain fish species and improved the distribution and relative cover of live coral (Cakacaka 2008, as summarised in Dehm et al. 2024), and a valuation put reef-associated fisheries at three-quarters or more of a FJ$1.3 million total for that reef (O’Garra 2007).
Three things cut hard against the triumphal reading
The best-designed evaluation found no ecological effect. Using 146 villages selected by matching methods, a national-level evaluation found that FLMMA engagement improves every mechanism hypothesised to generate conservation outcomes — participation, knowledge, management and financial support — yet these translate to few social outcomes and have “no effect on the perceived ecological health” of a village’s fishing grounds (O’Garra et al. 2023). FLMMA villages did show higher subjective wellbeing. Note the author list: it includes network insiders. This is the movement auditing itself and publishing a largely null result, which makes it much harder to dismiss than outside criticism would be.
The promotional figures are real too, and both sets belong on the page. Clam counts in the Ucunivanua closure rose from 38 individuals per 50 m³ in 1997 to 7,083 in 2004, and Navakavu household income was reported at FJD 418 per month against FJD 197 at matched control sites — both from a UNDP case study drawing on project-partner work.
The coverage numbers do not mean what they appear to. The widely-quoted figure of more than a quarter of Fiji’s inshore area under management counts whole customary fishing grounds placed under a management plan, not protected water. The actual no-take footprint was about 593 km² in 2009, and 415 tabu areas across 143 fishing grounds totalling about 965 km² in 2013 — roughly 5% of total managed area set aside as no-take, against a recommended optimum of 30–50%. The World Bank’s marine protected area indicator for Fiji returns 0.9% for every year from 2013 to 2025, flat; an independent inventory that did include locally managed areas put Fiji at 0.8% of its exclusive economic zone. Fiji’s own biodiversity plan is candid: all 410 registered fishing grounds together account for 2.3% of territorial waters.
Local management cannot reach the pressures that now dominate. After Cyclone Winston in 2016 — the most intense tropical cyclone on record in the Southern Hemisphere — eighteen sites across two Fijian barrier reef systems lost a relative 54 ± 8% of their hard coral cover, mainly branching and plating Acropora. Recovery by 2020 was rapid and extensive. But no-take areas did not promote faster recovery, a result the authors themselves qualify by noting that all their sites were remote from local impacts and current-swept (Ford et al. 2025). Those sites are on the other side of Viti Levu, not at Suva; no reef-damage assessment for the Suva or Laucala Bay reefs after Winston has been found.
And on the one mechanism the 1996 chapter actually blamed, Fiji plainly failed. Two treatment plants for a conurbation of 268,000; sewer coverage of about a third; faecal coliform loads showing minimal change across nearly three decades; ammonia at 17.8 mg/L at the Kinoya outfall in 2025. A tabu regulates fishing. It does not regulate a 30.5 °C sea, a twelve-metre wave, or a national sewerage budget.
So the honest formulation is this. The participatory architecture the thesis called for was built, at real scale, in my own city, beginning within a year or two of my fieldwork and largely by the university that hosted me — and it is genuinely Fiji’s own, not an imported model. What thirty years have not demonstrated is that it changed the water. That is a more interesting outcome than vindication, and it points at the argument’s real limit: participation distributes authority over the pressures a community controls, and the pressures that now matter most on this reef are not among them.
The references behind the claims on this page. A link is given where one is recorded in the research brief; its absence means the brief carries no URL for that work, not that none exists.