Appendix
The figures, as submitted
123 figures, read out of the binary of the 2005 Word file. They come in two kinds, and the difference is worth stating plainly, because it is the difference between a photograph of a chart and the chart itself.
These are the originals. The re-opened data section redraws the same measurements from the surviving spreadsheets.
The scanned plates
34 figures were stored as bitmaps. Several are photographs of charts I drew by hand on graph paper in 1996 — the transect composition plots for the Fiji reef were plotted with a pen, labelled by hand, and pasted into the document as scans. They are reproduced here at the resolution they were stored at, untouched.
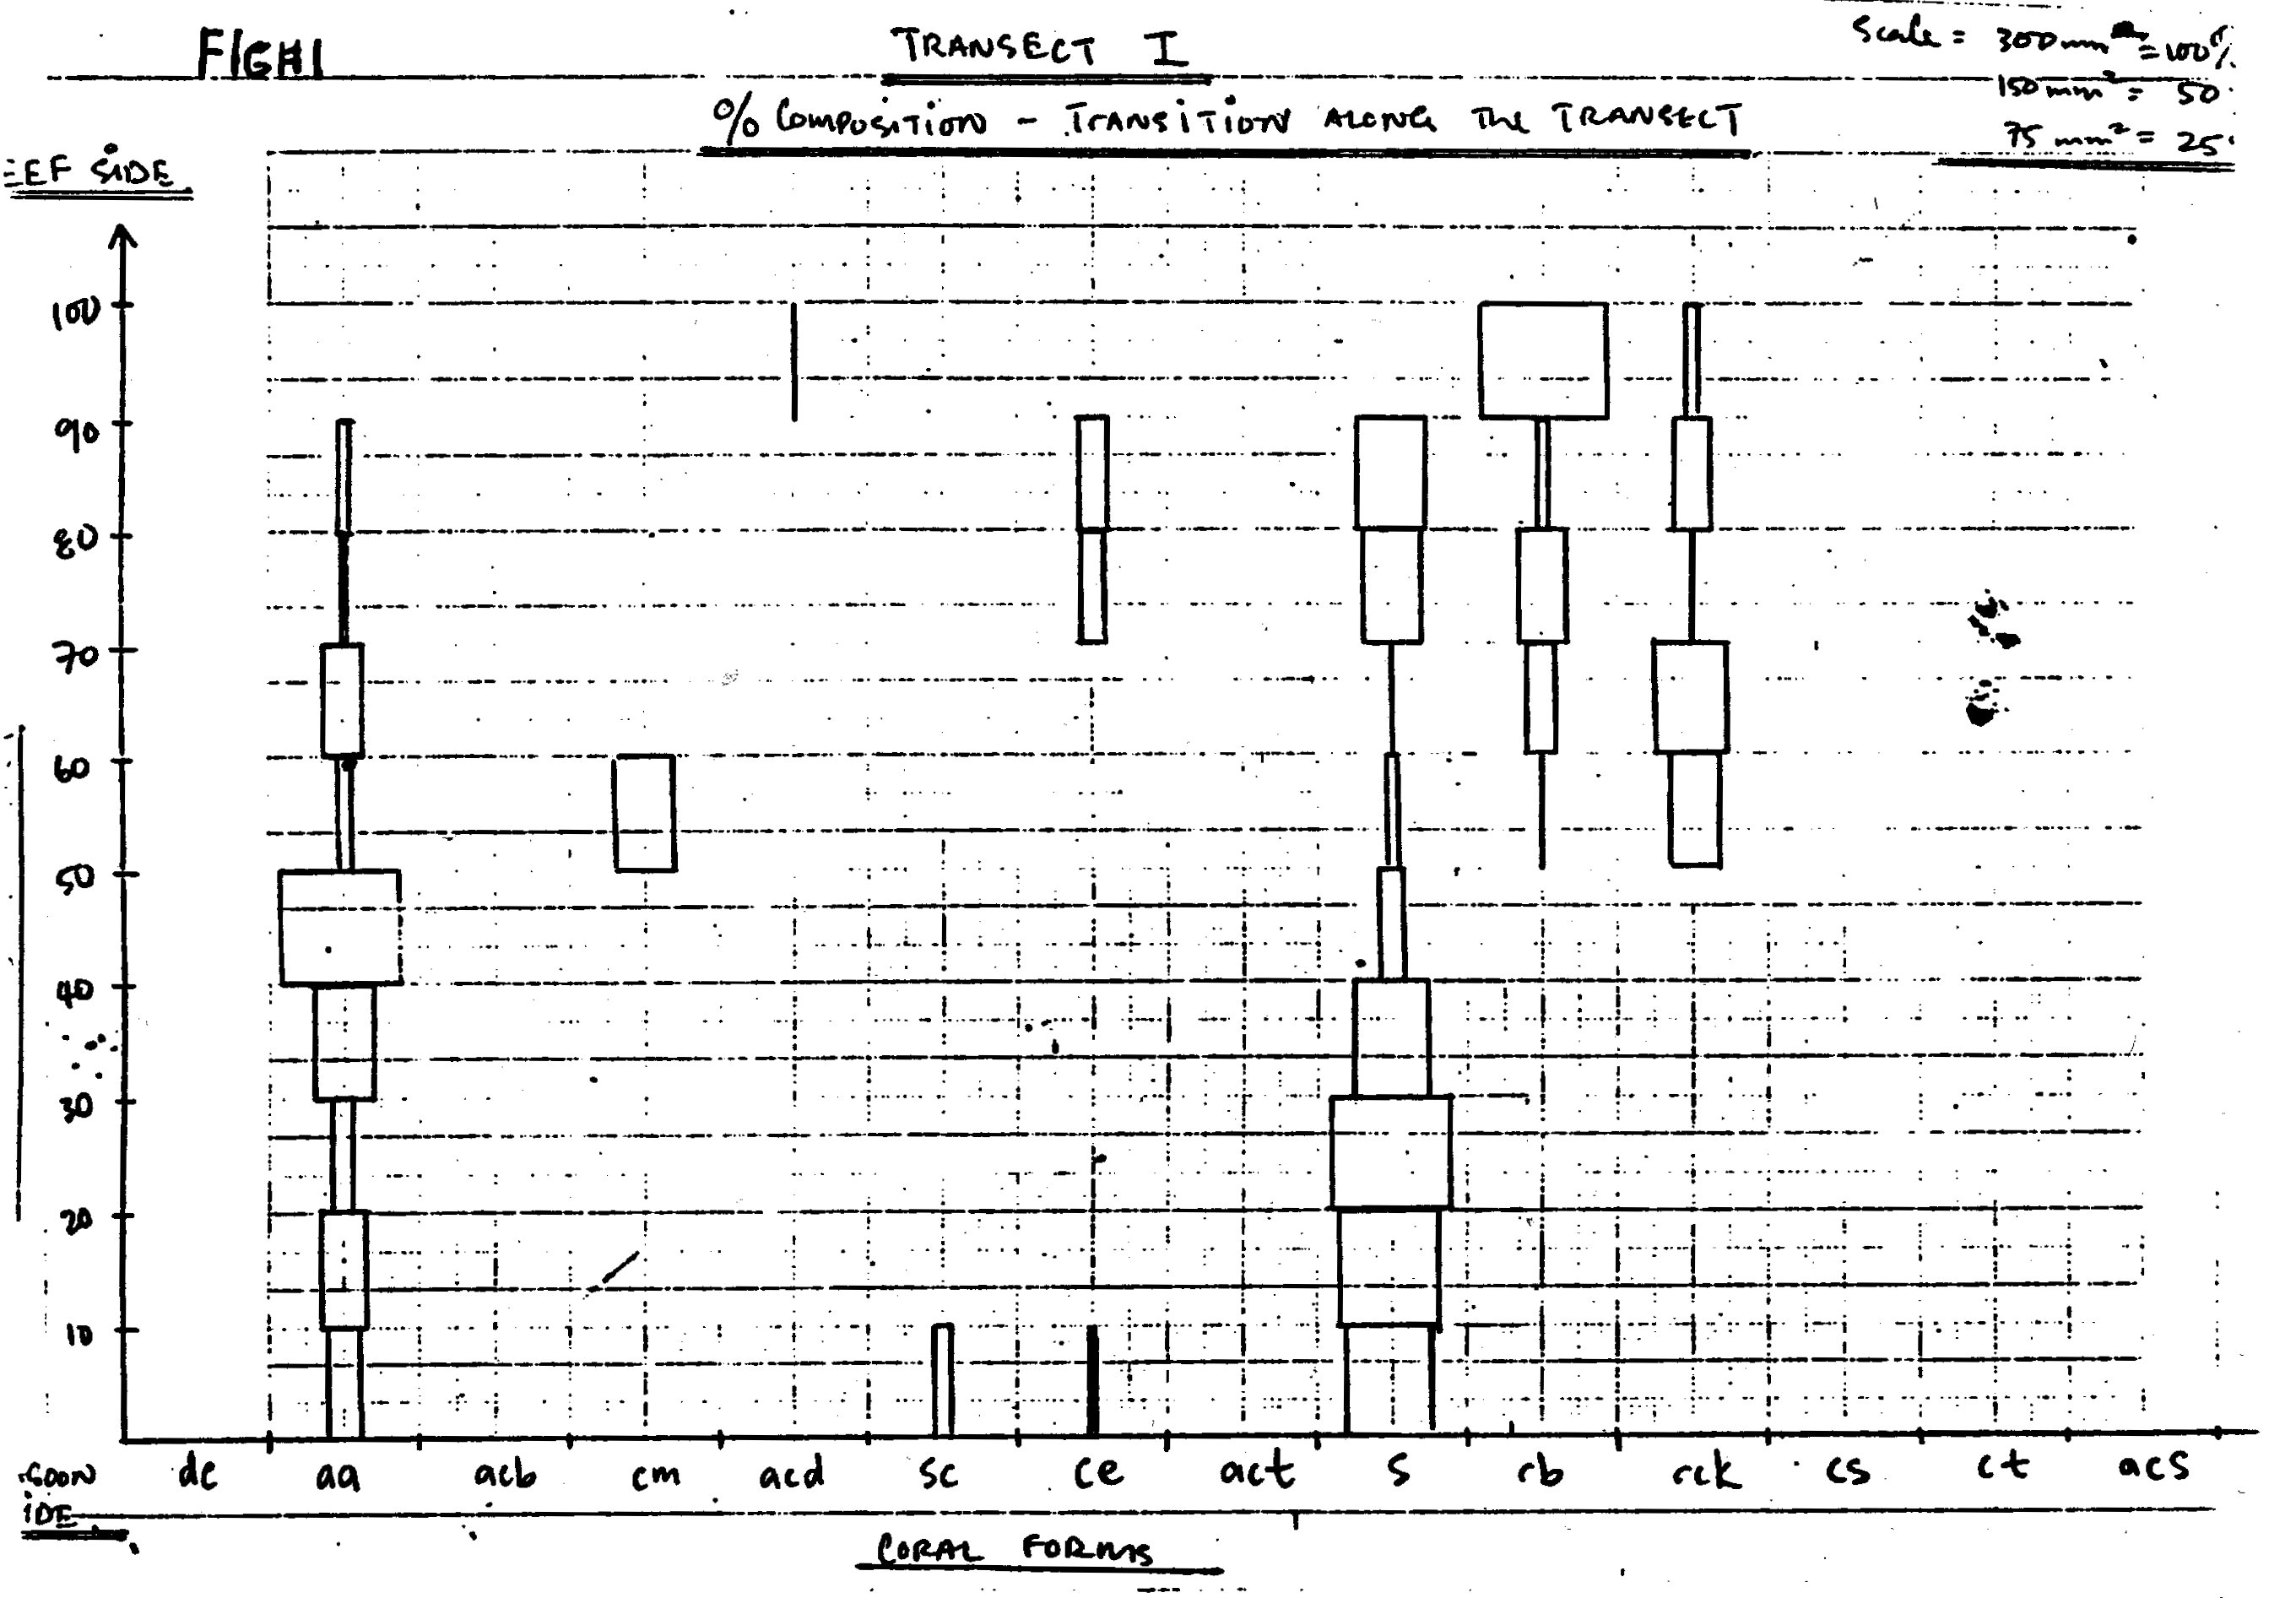
Plate 1 · original 2720×1893 px · line drawing
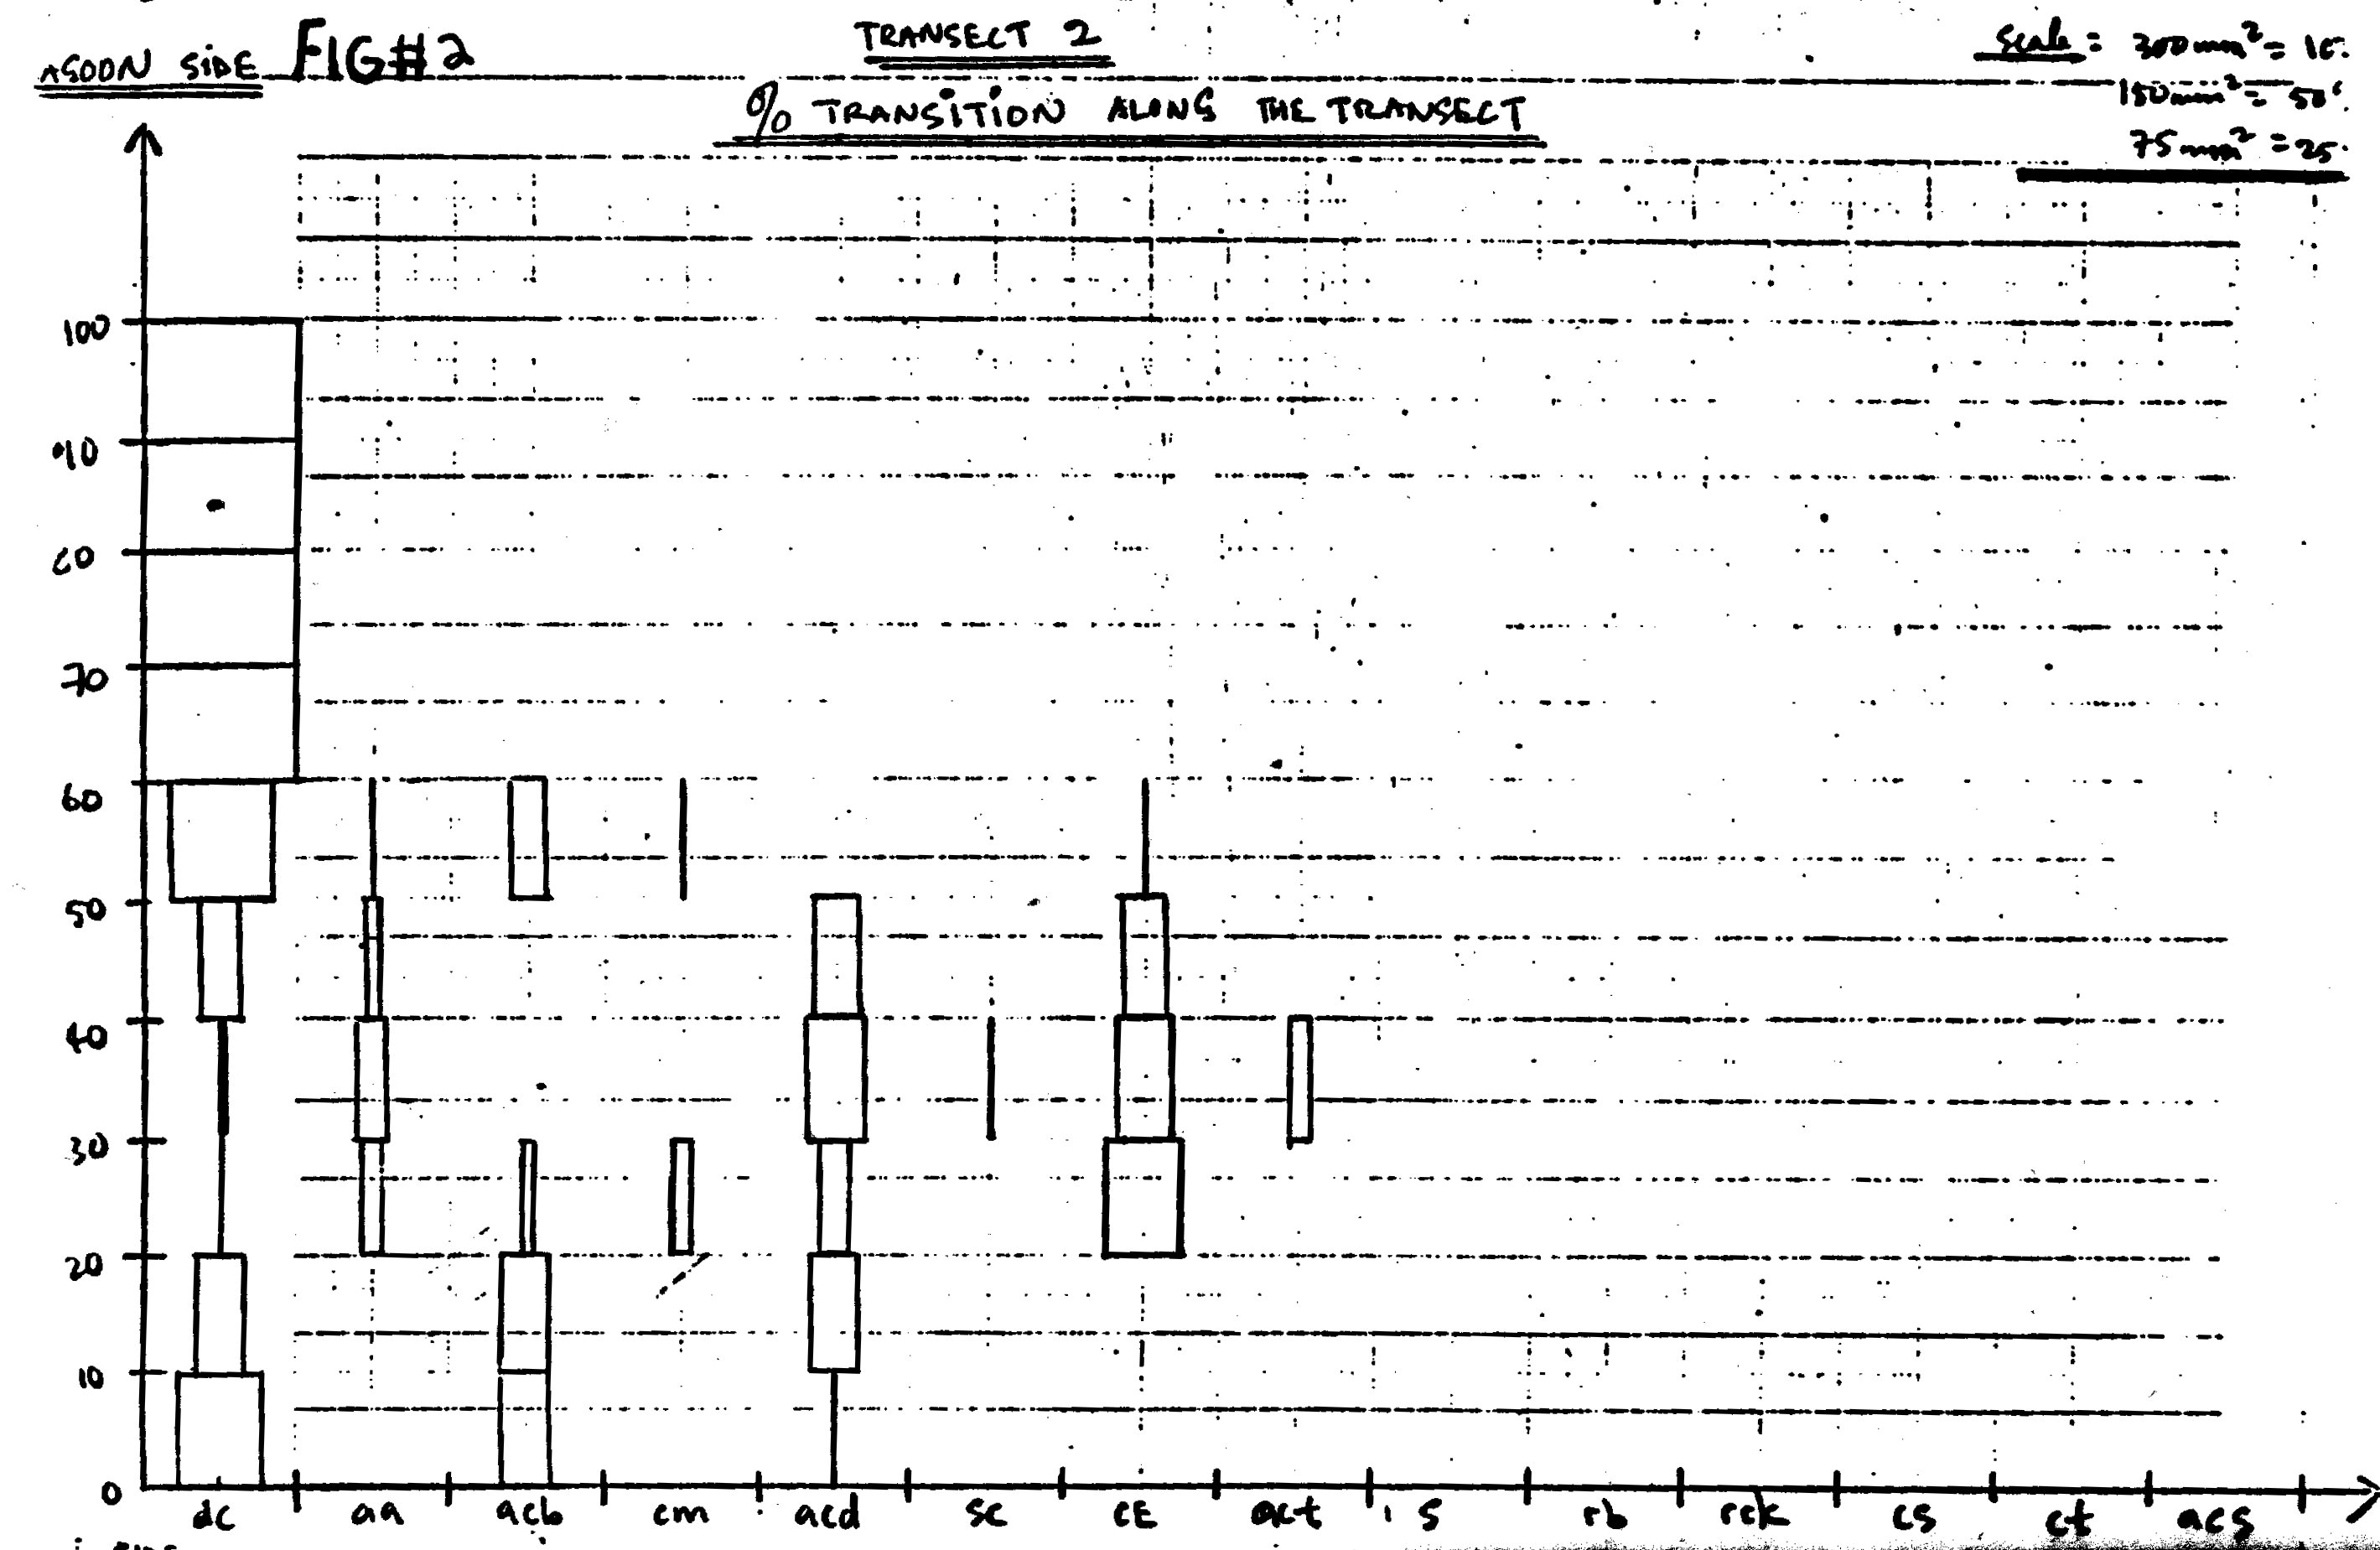
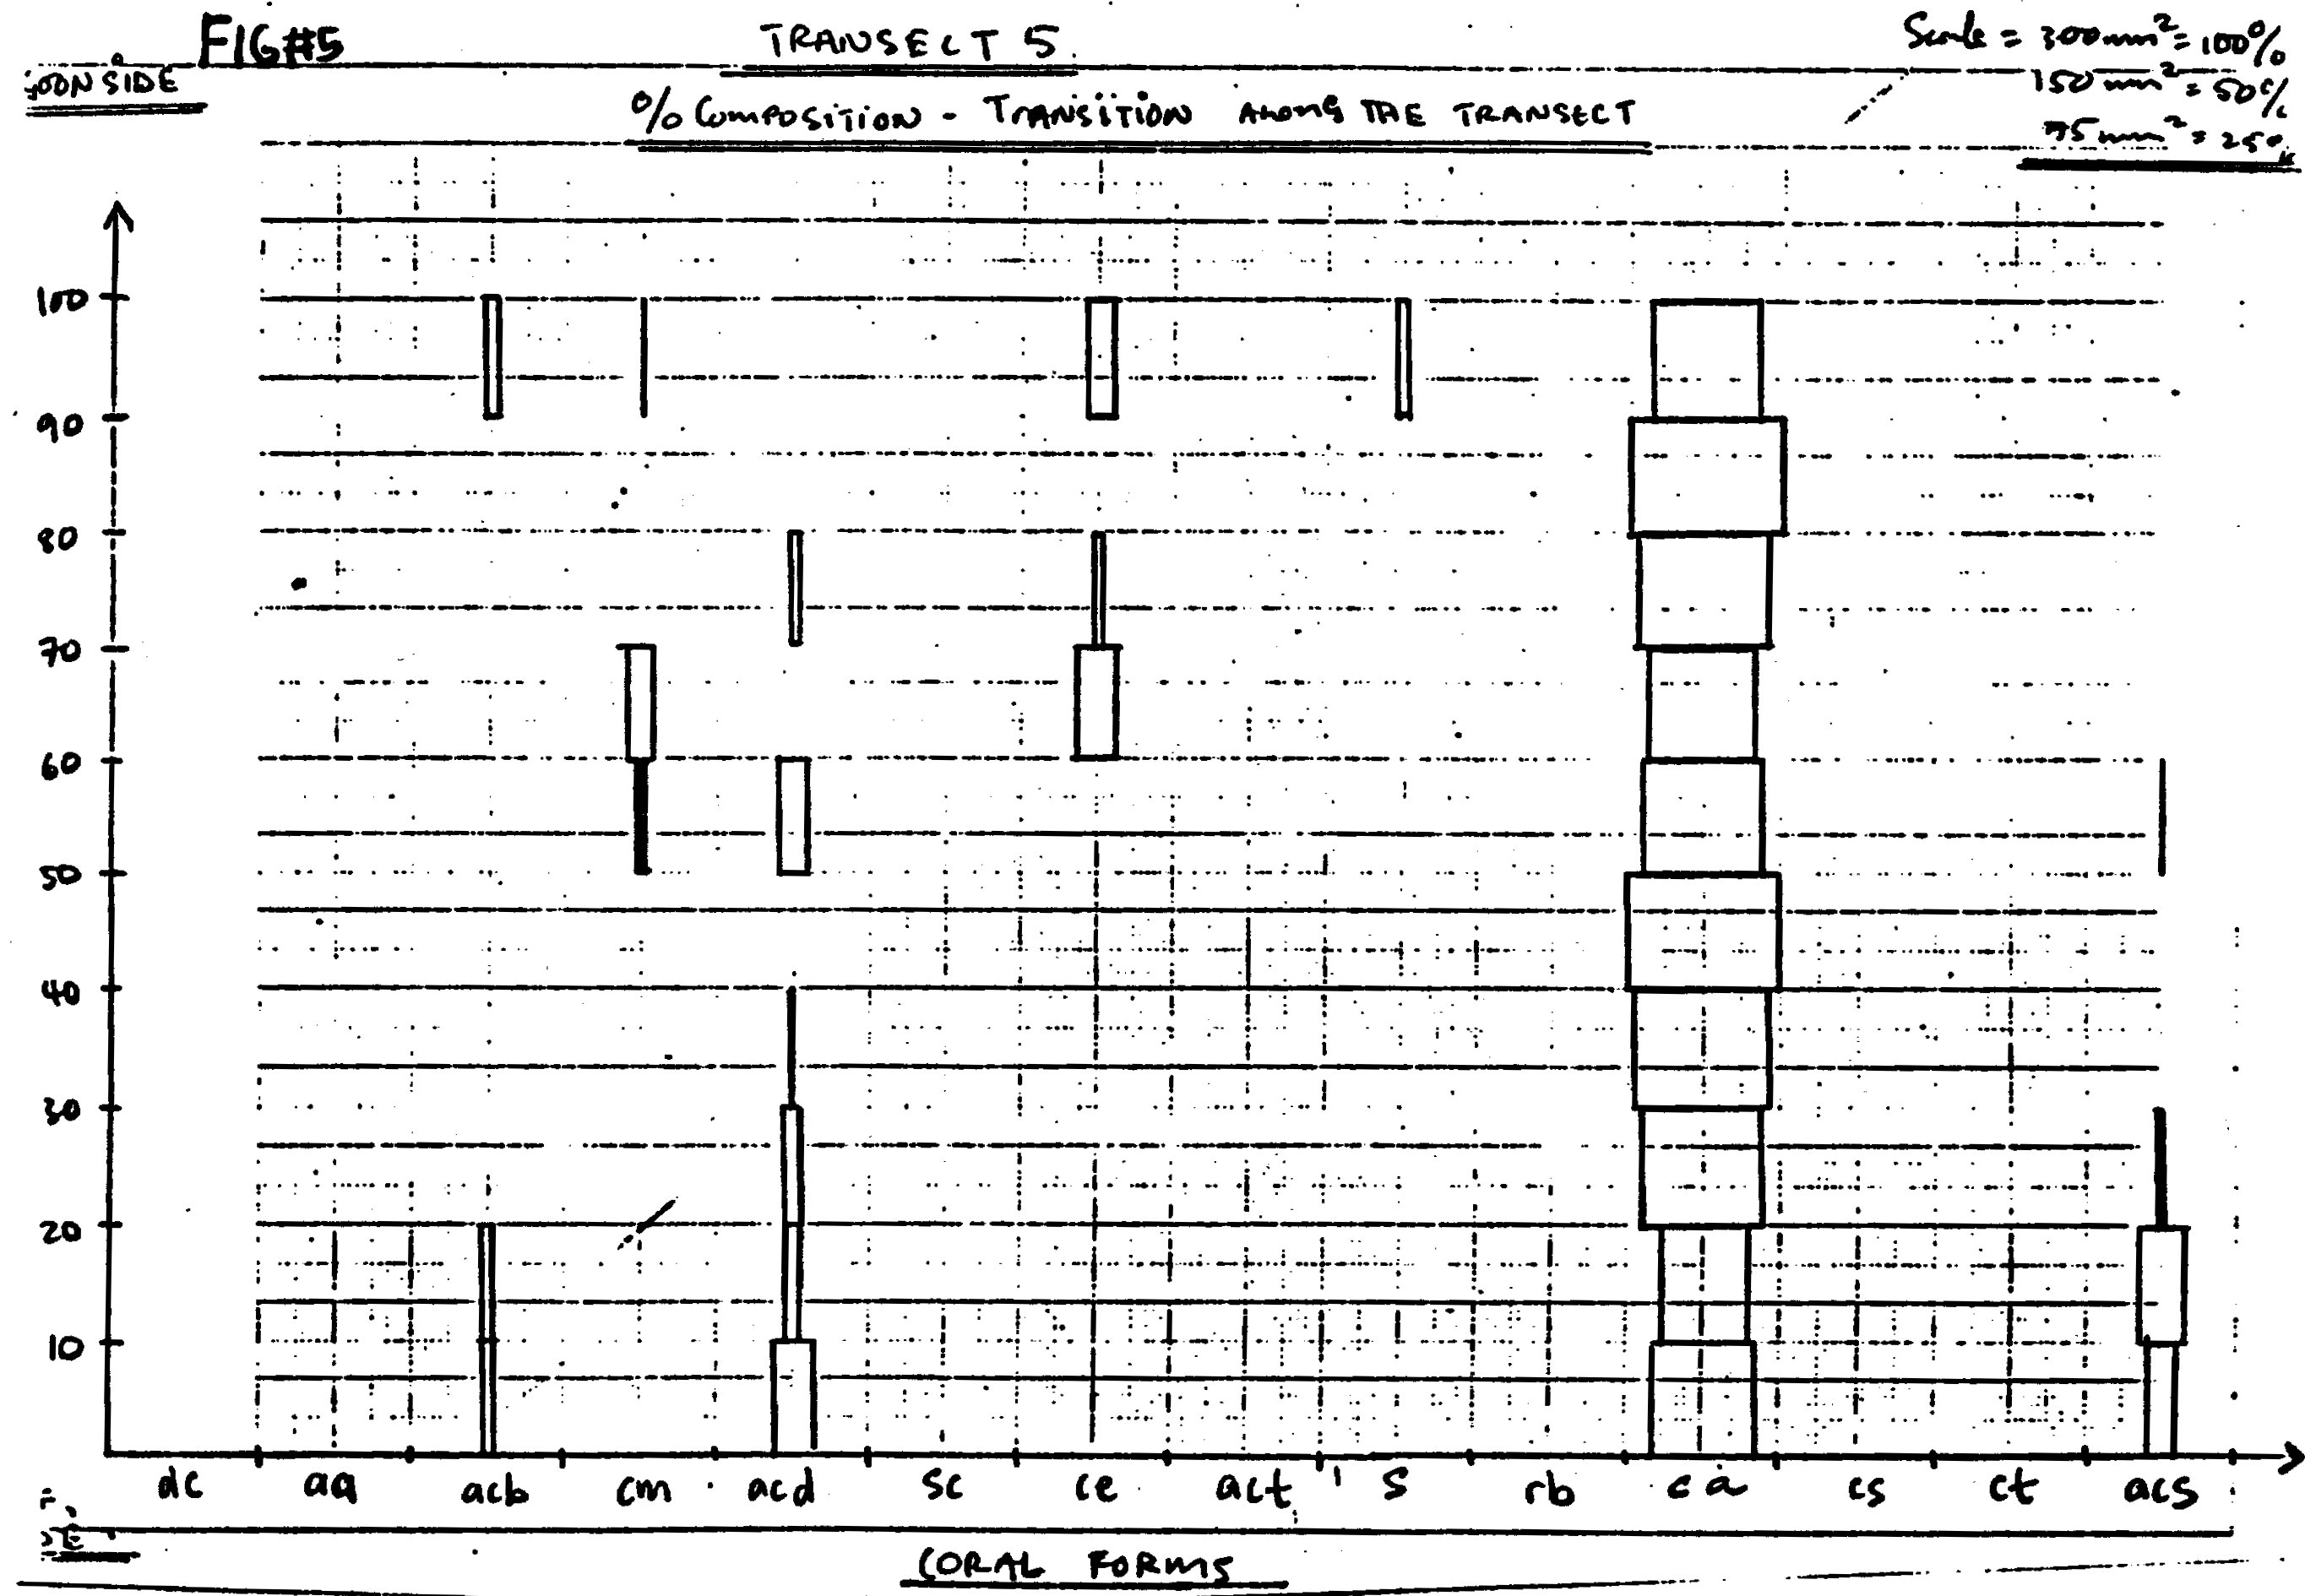
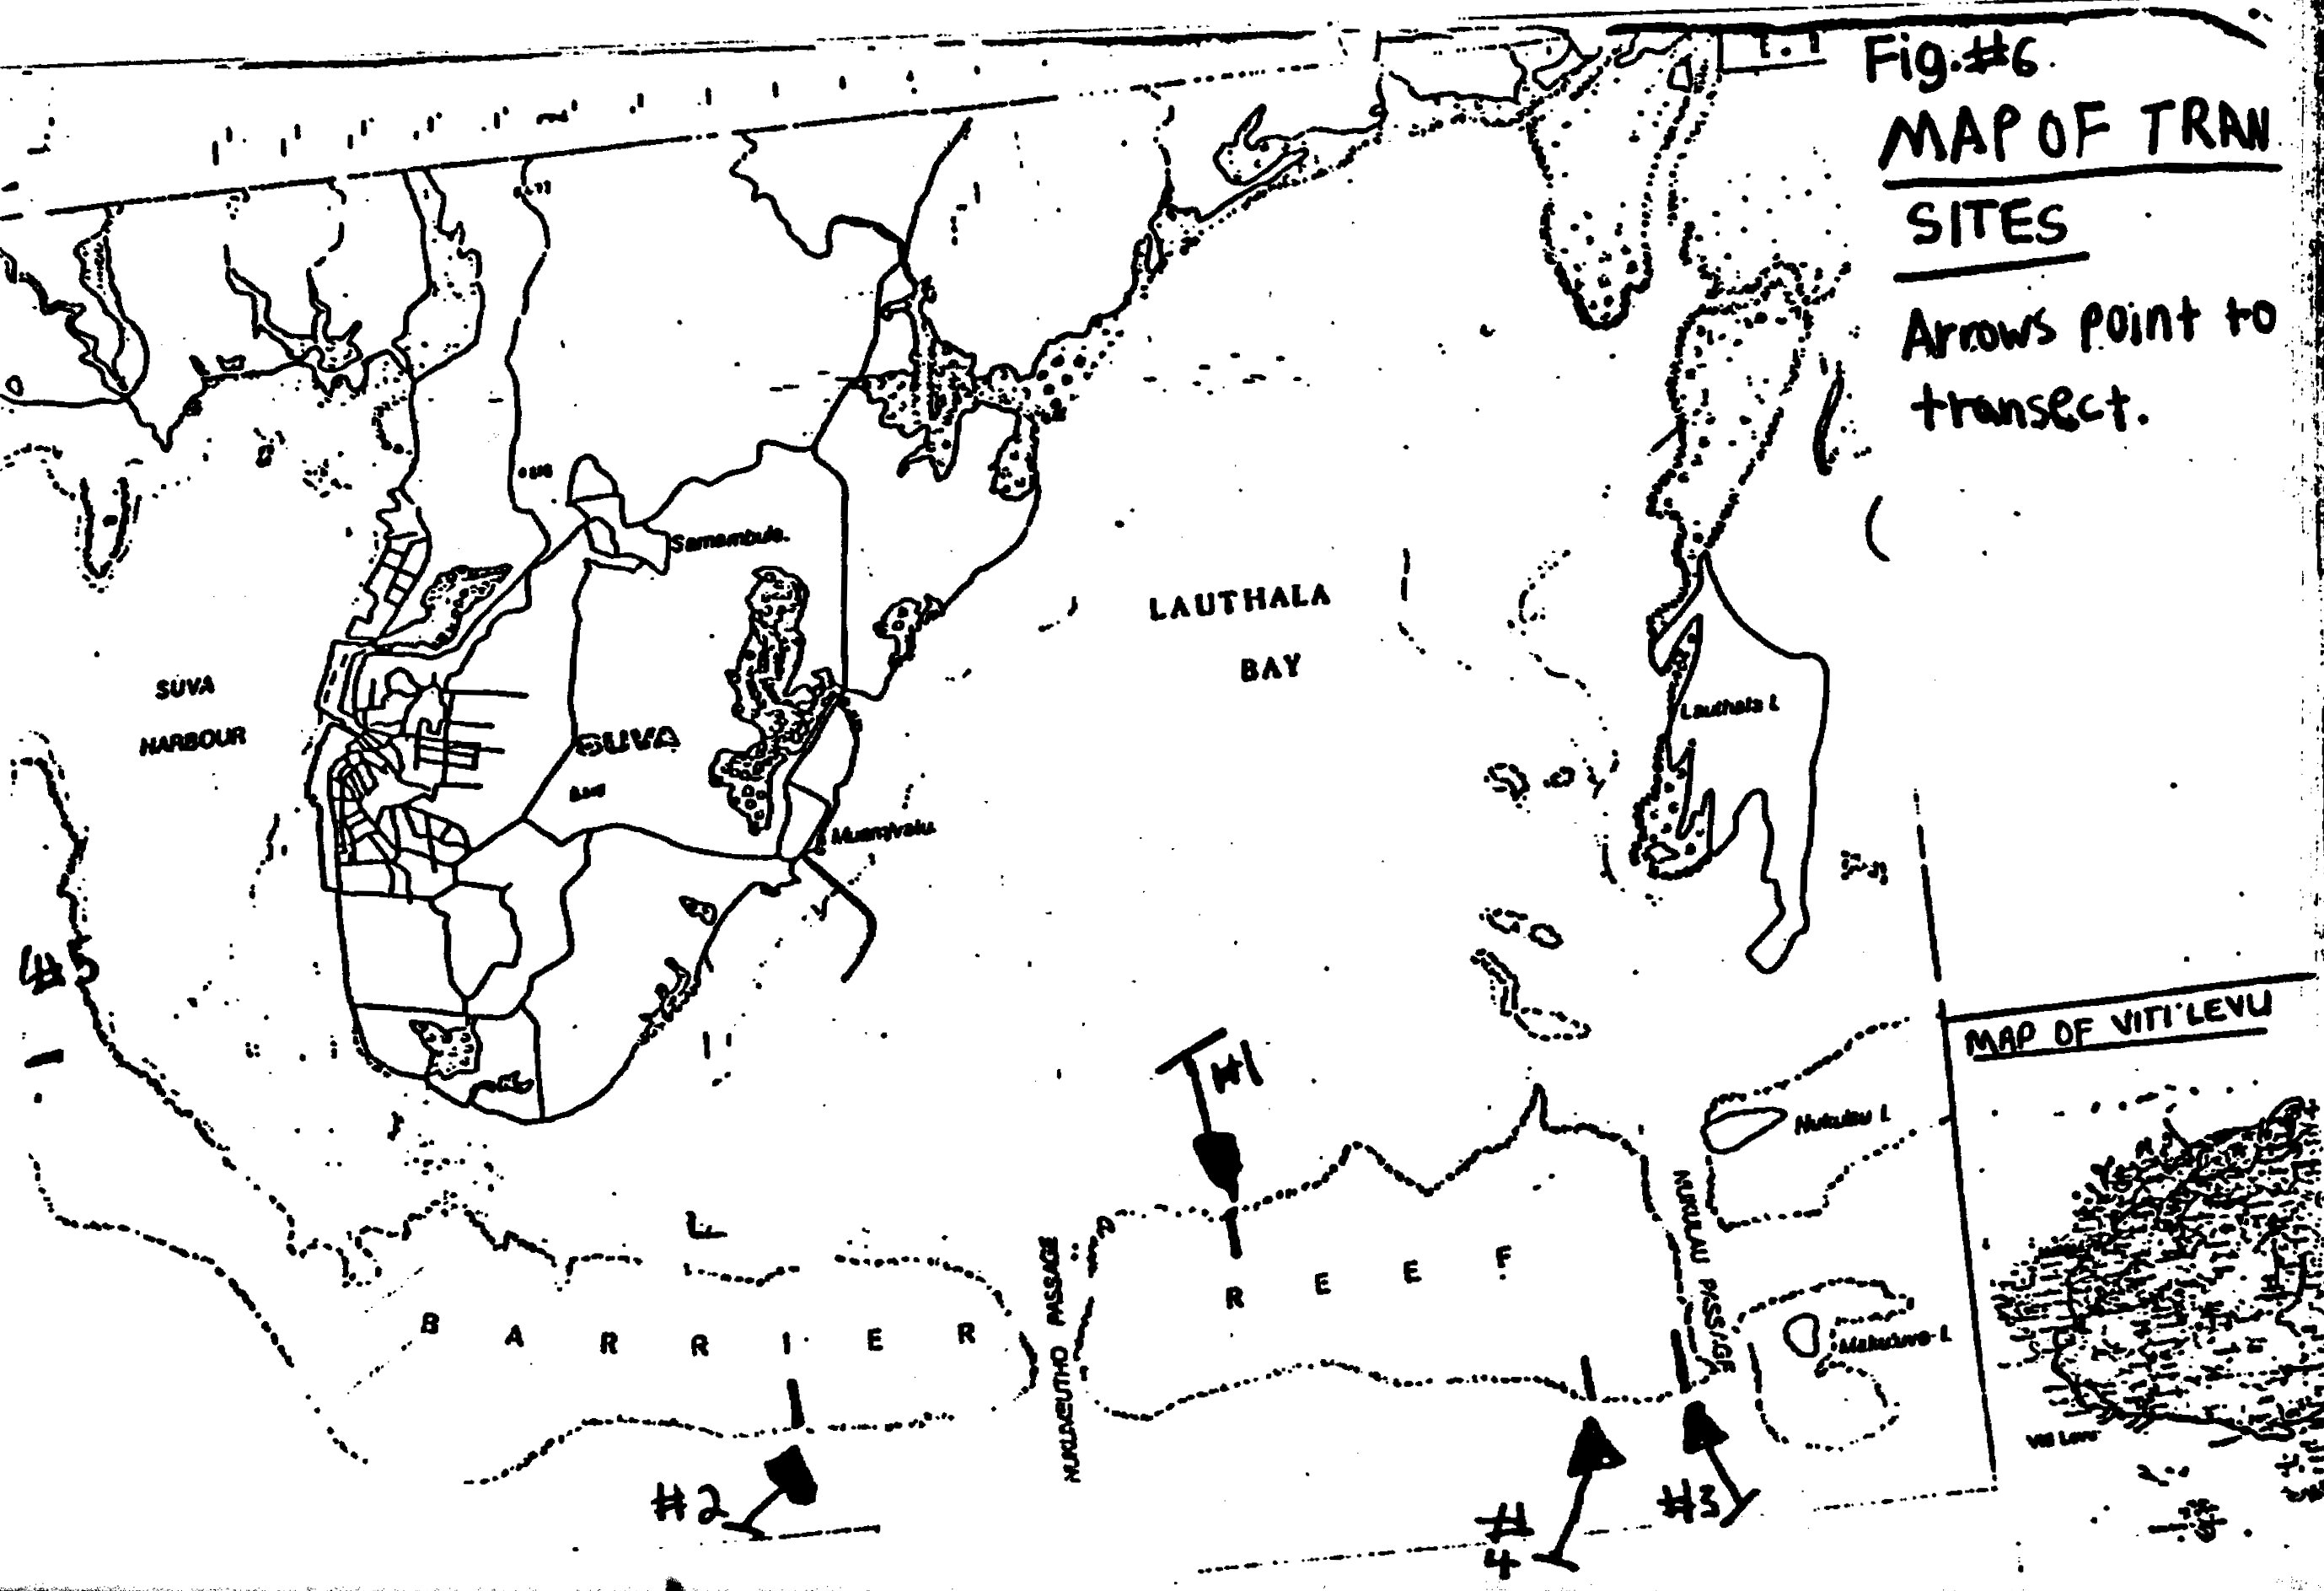
Plate 4 · original 2757×1887 px · line drawing
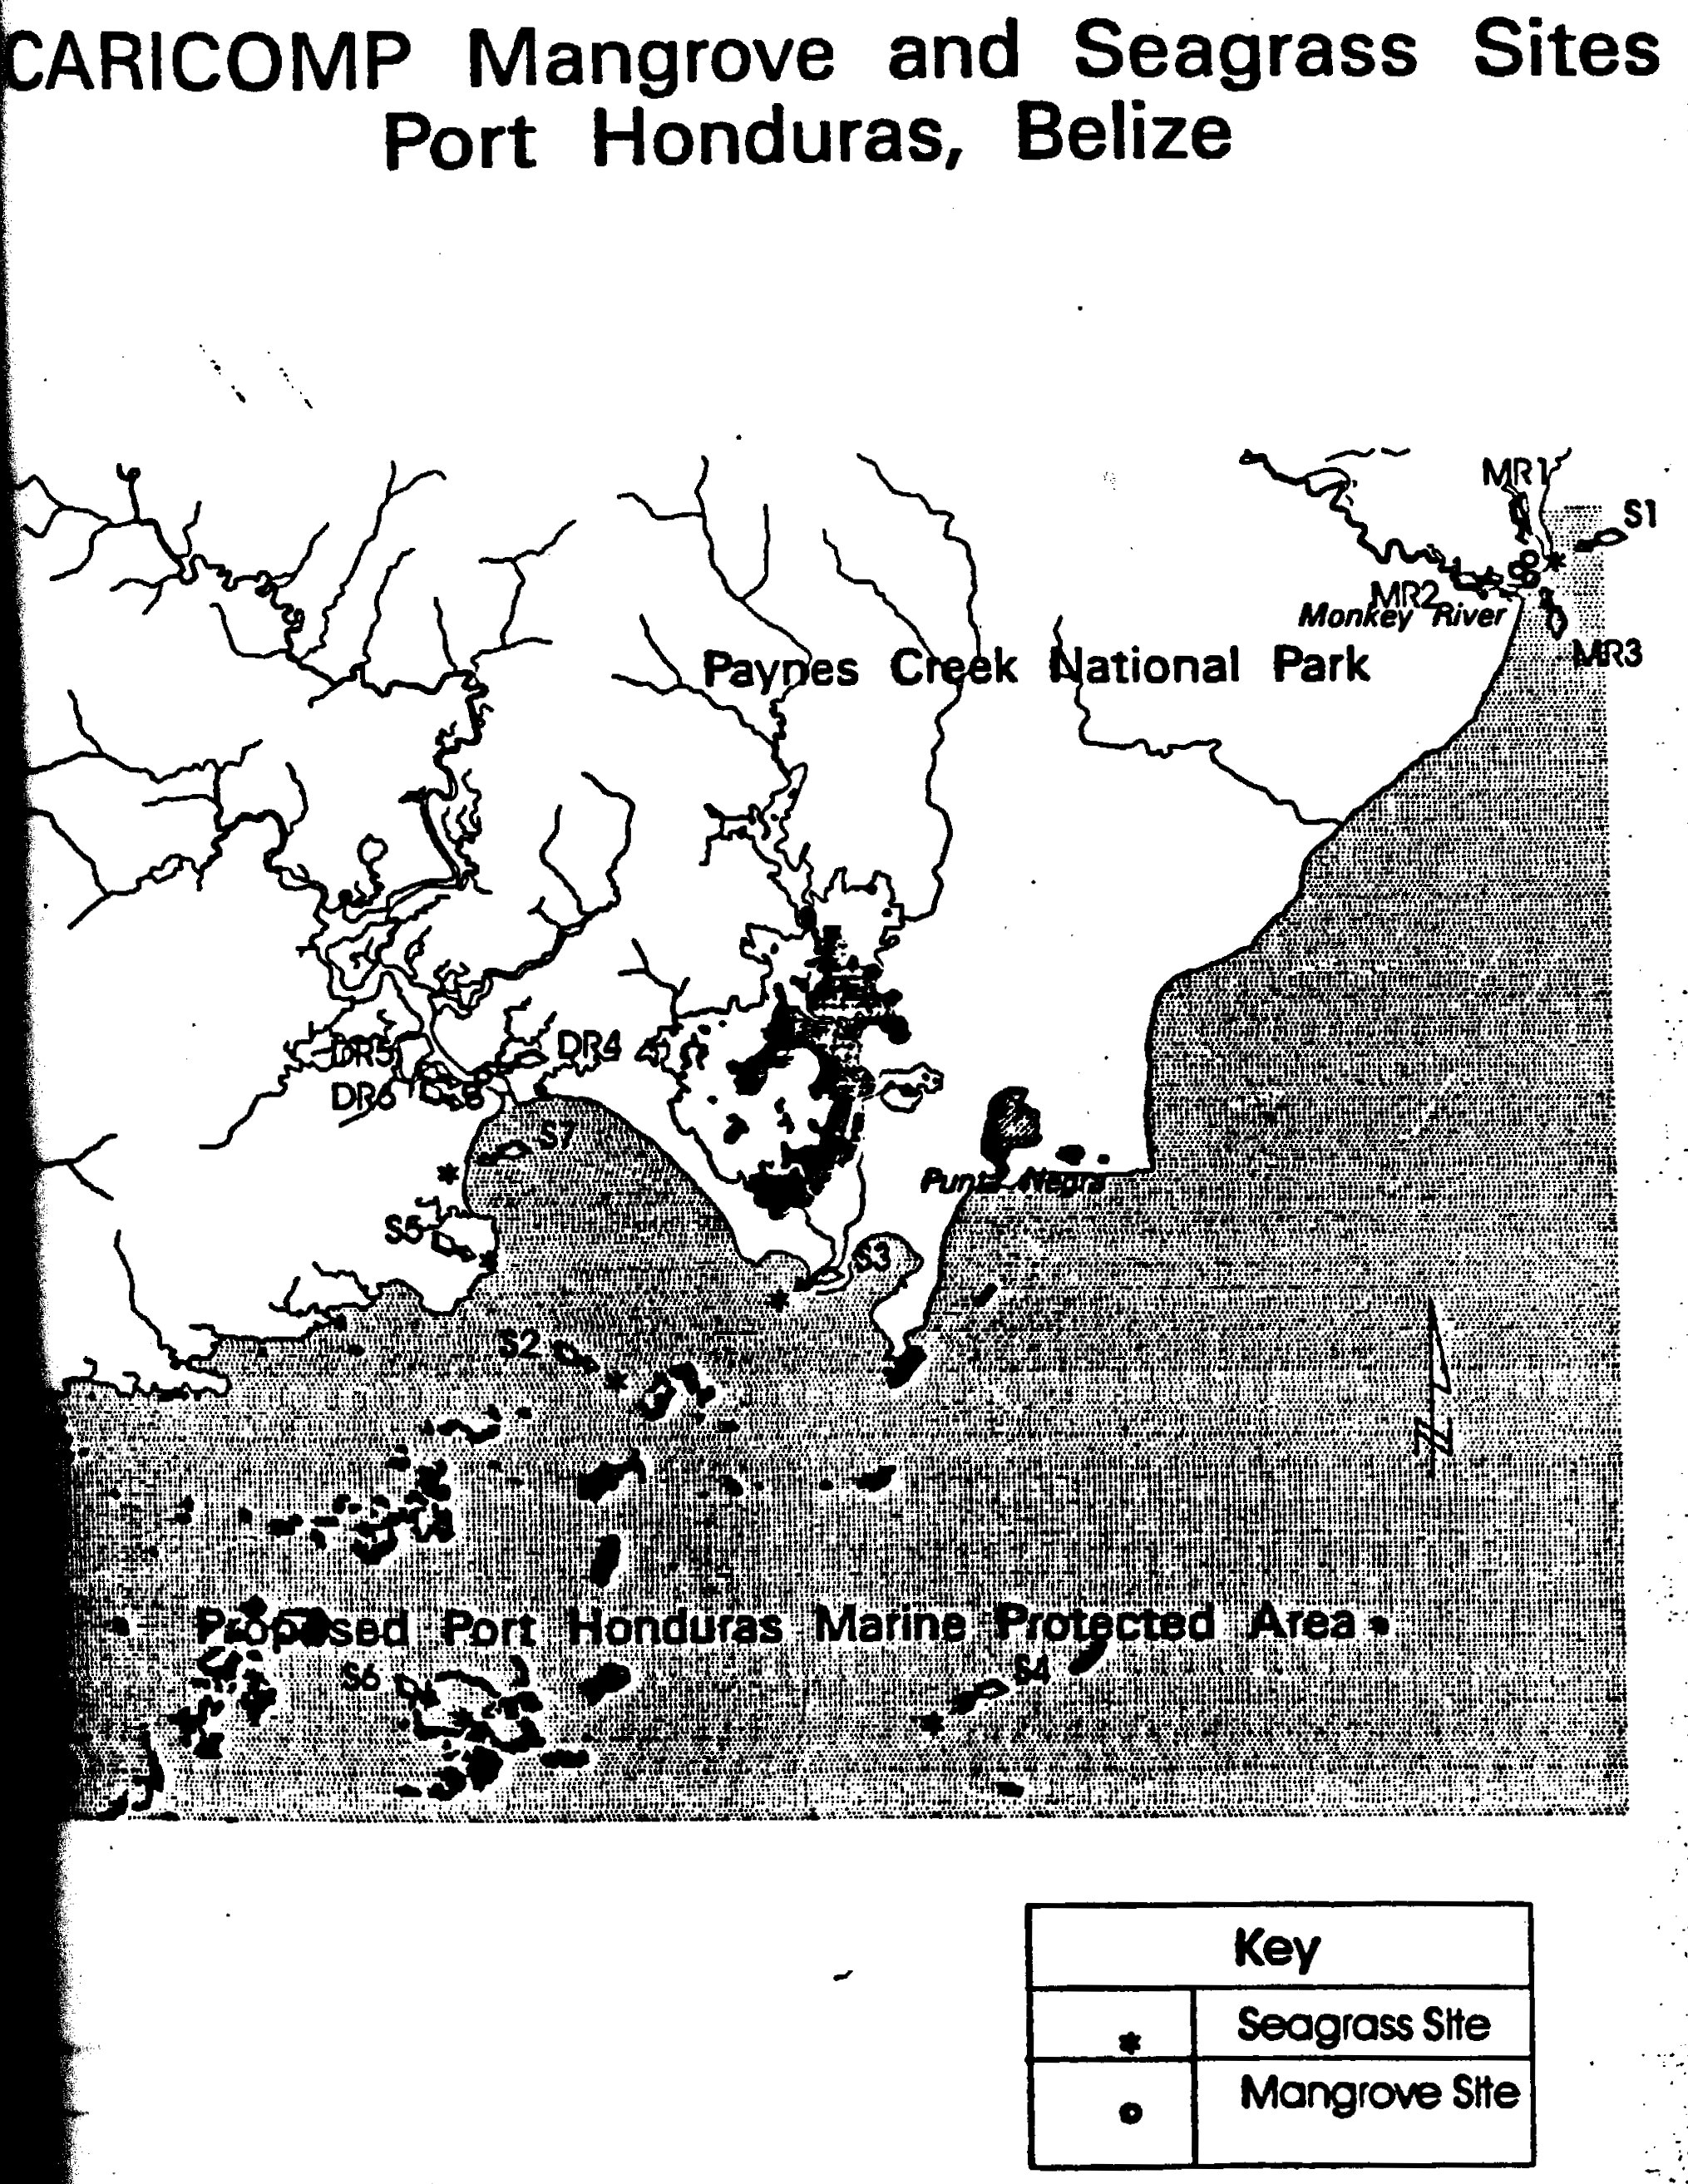
Plate 5 · original 2030×2627 px
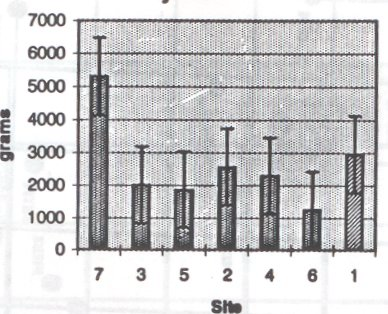
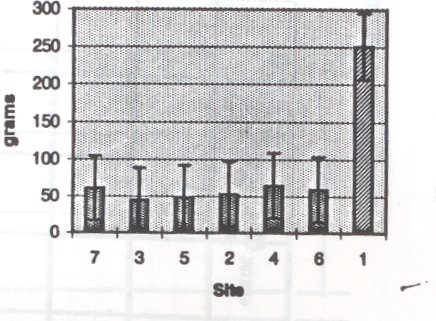
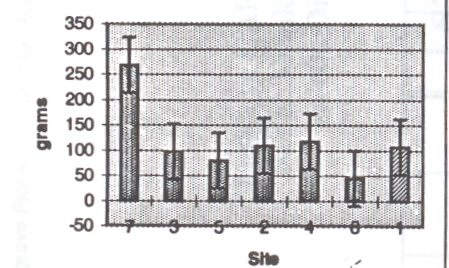
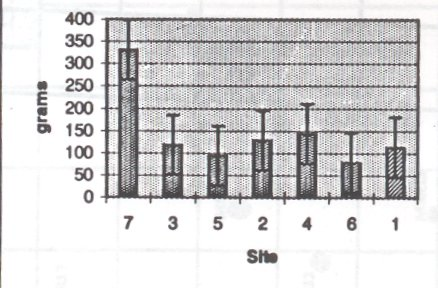
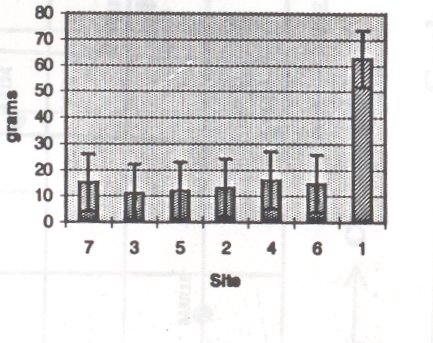
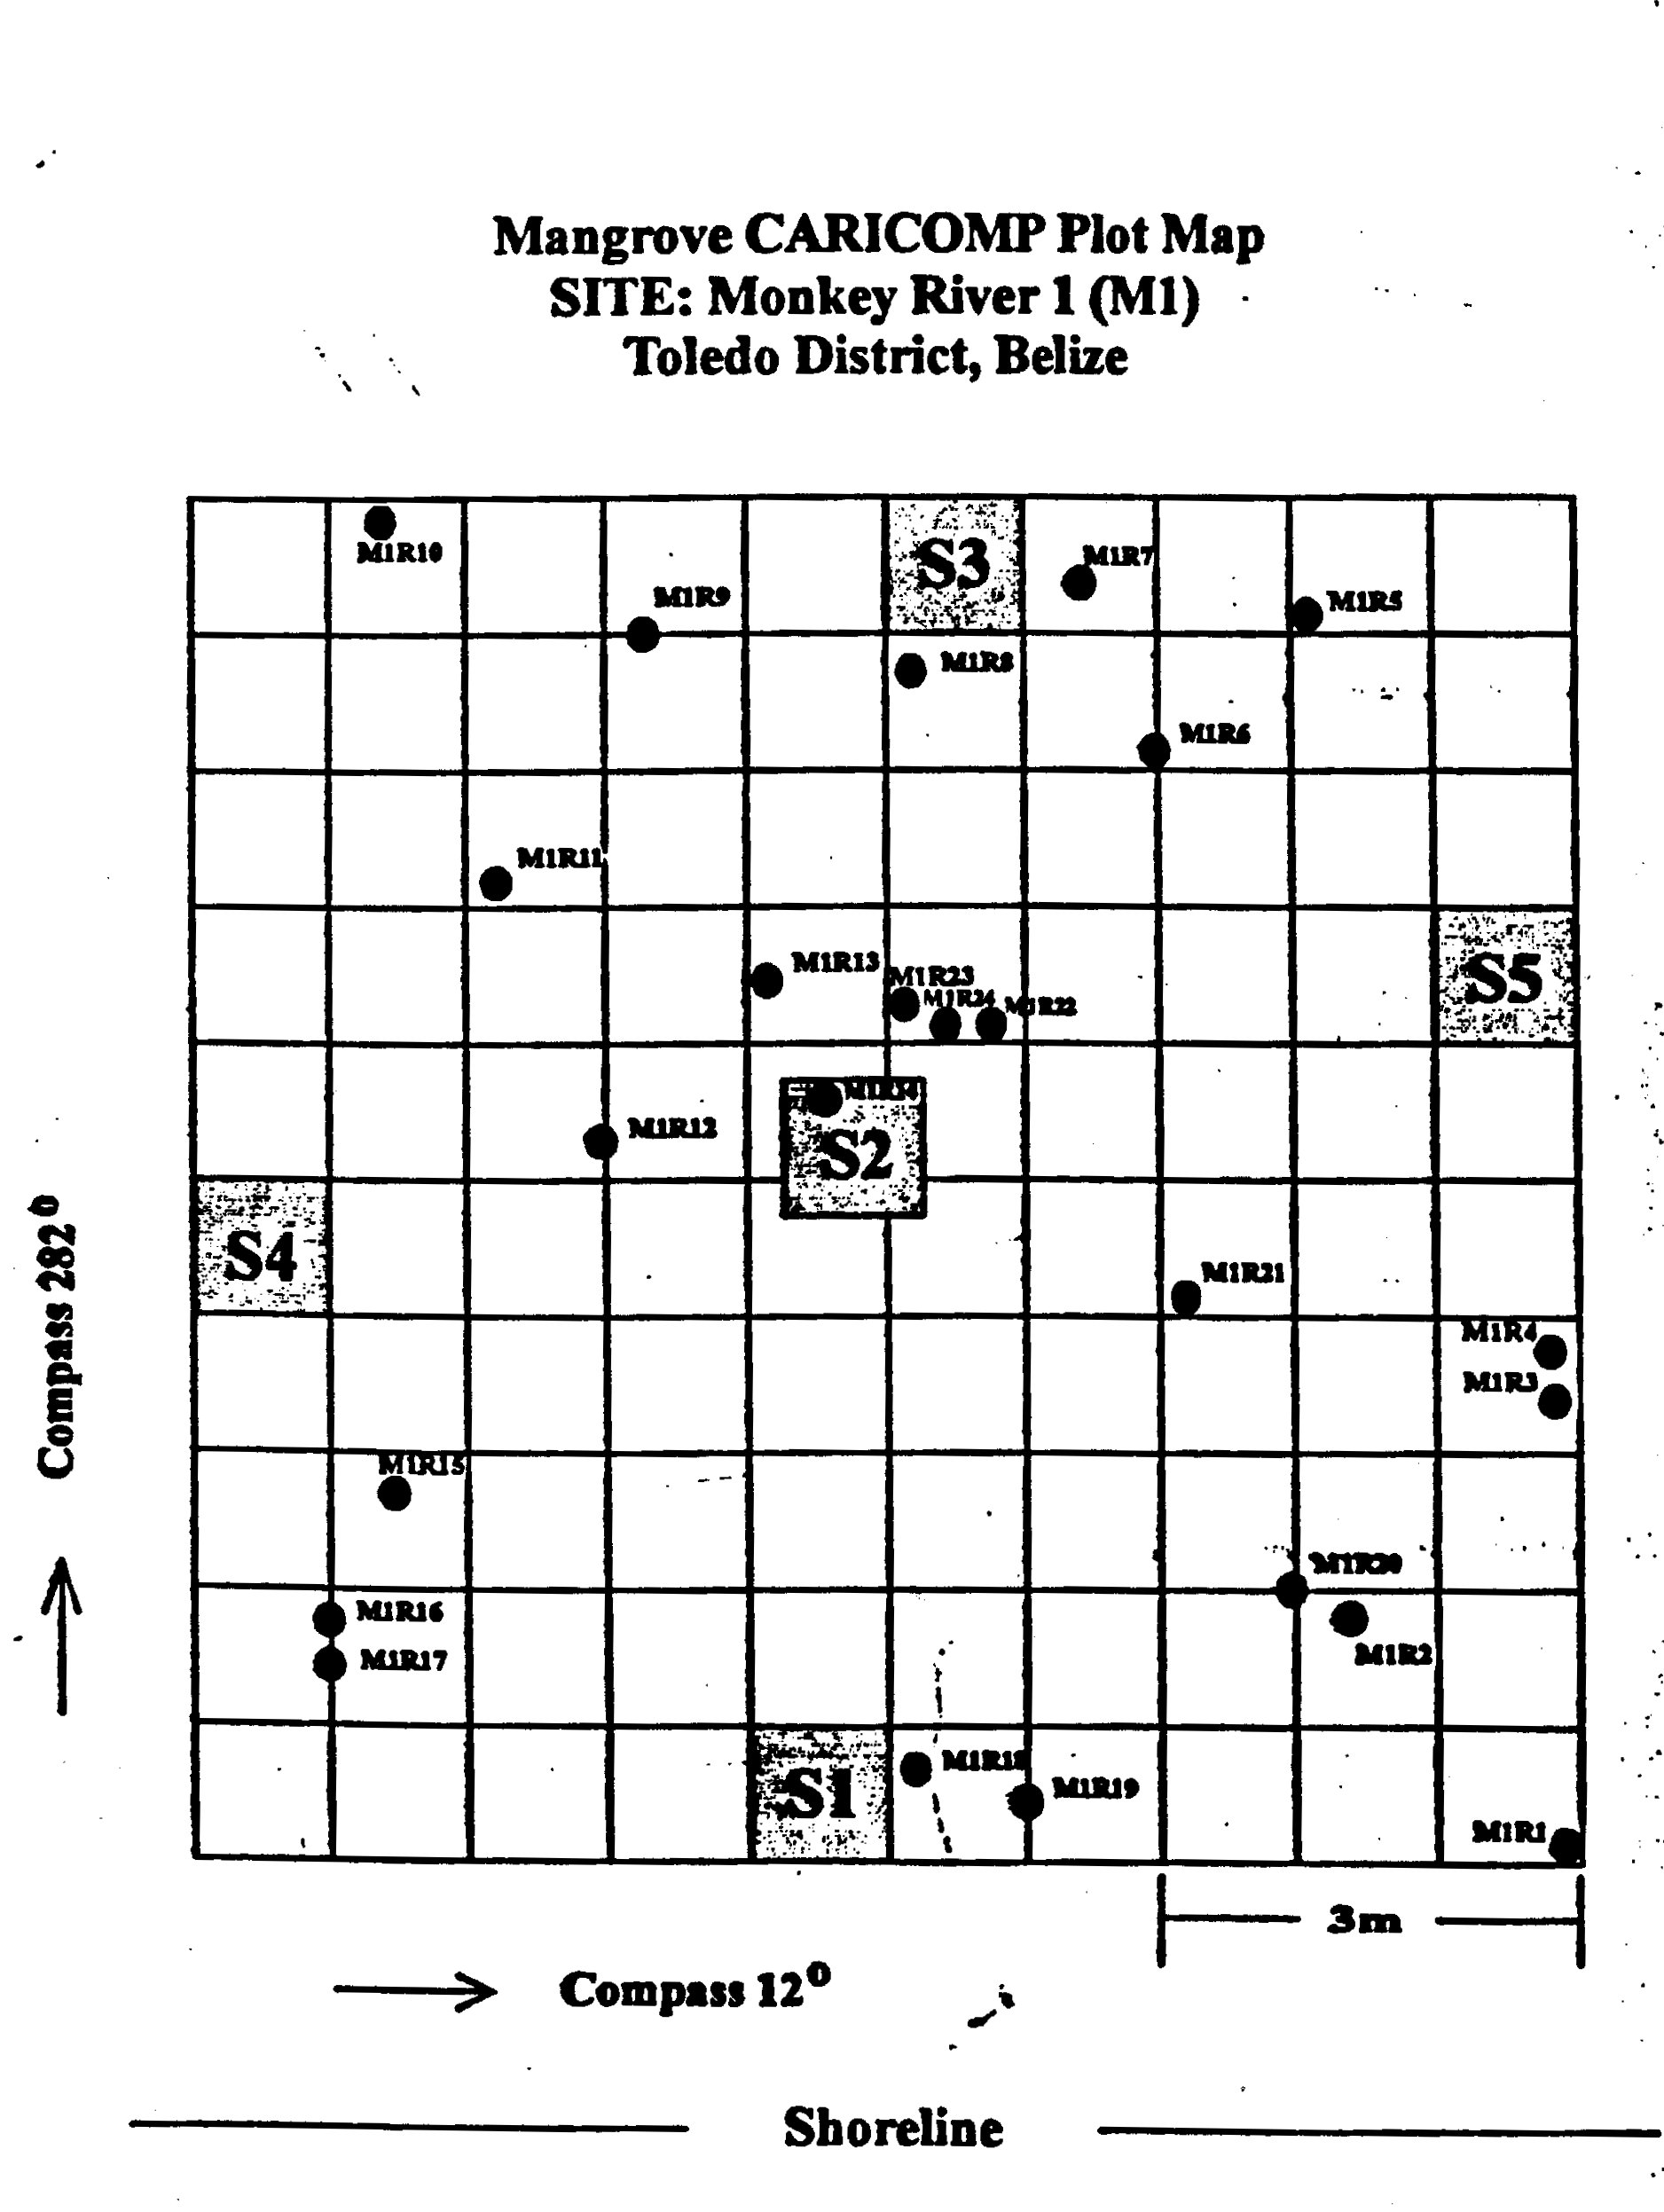
Plate 11 · original 1876×2494 px · line drawing
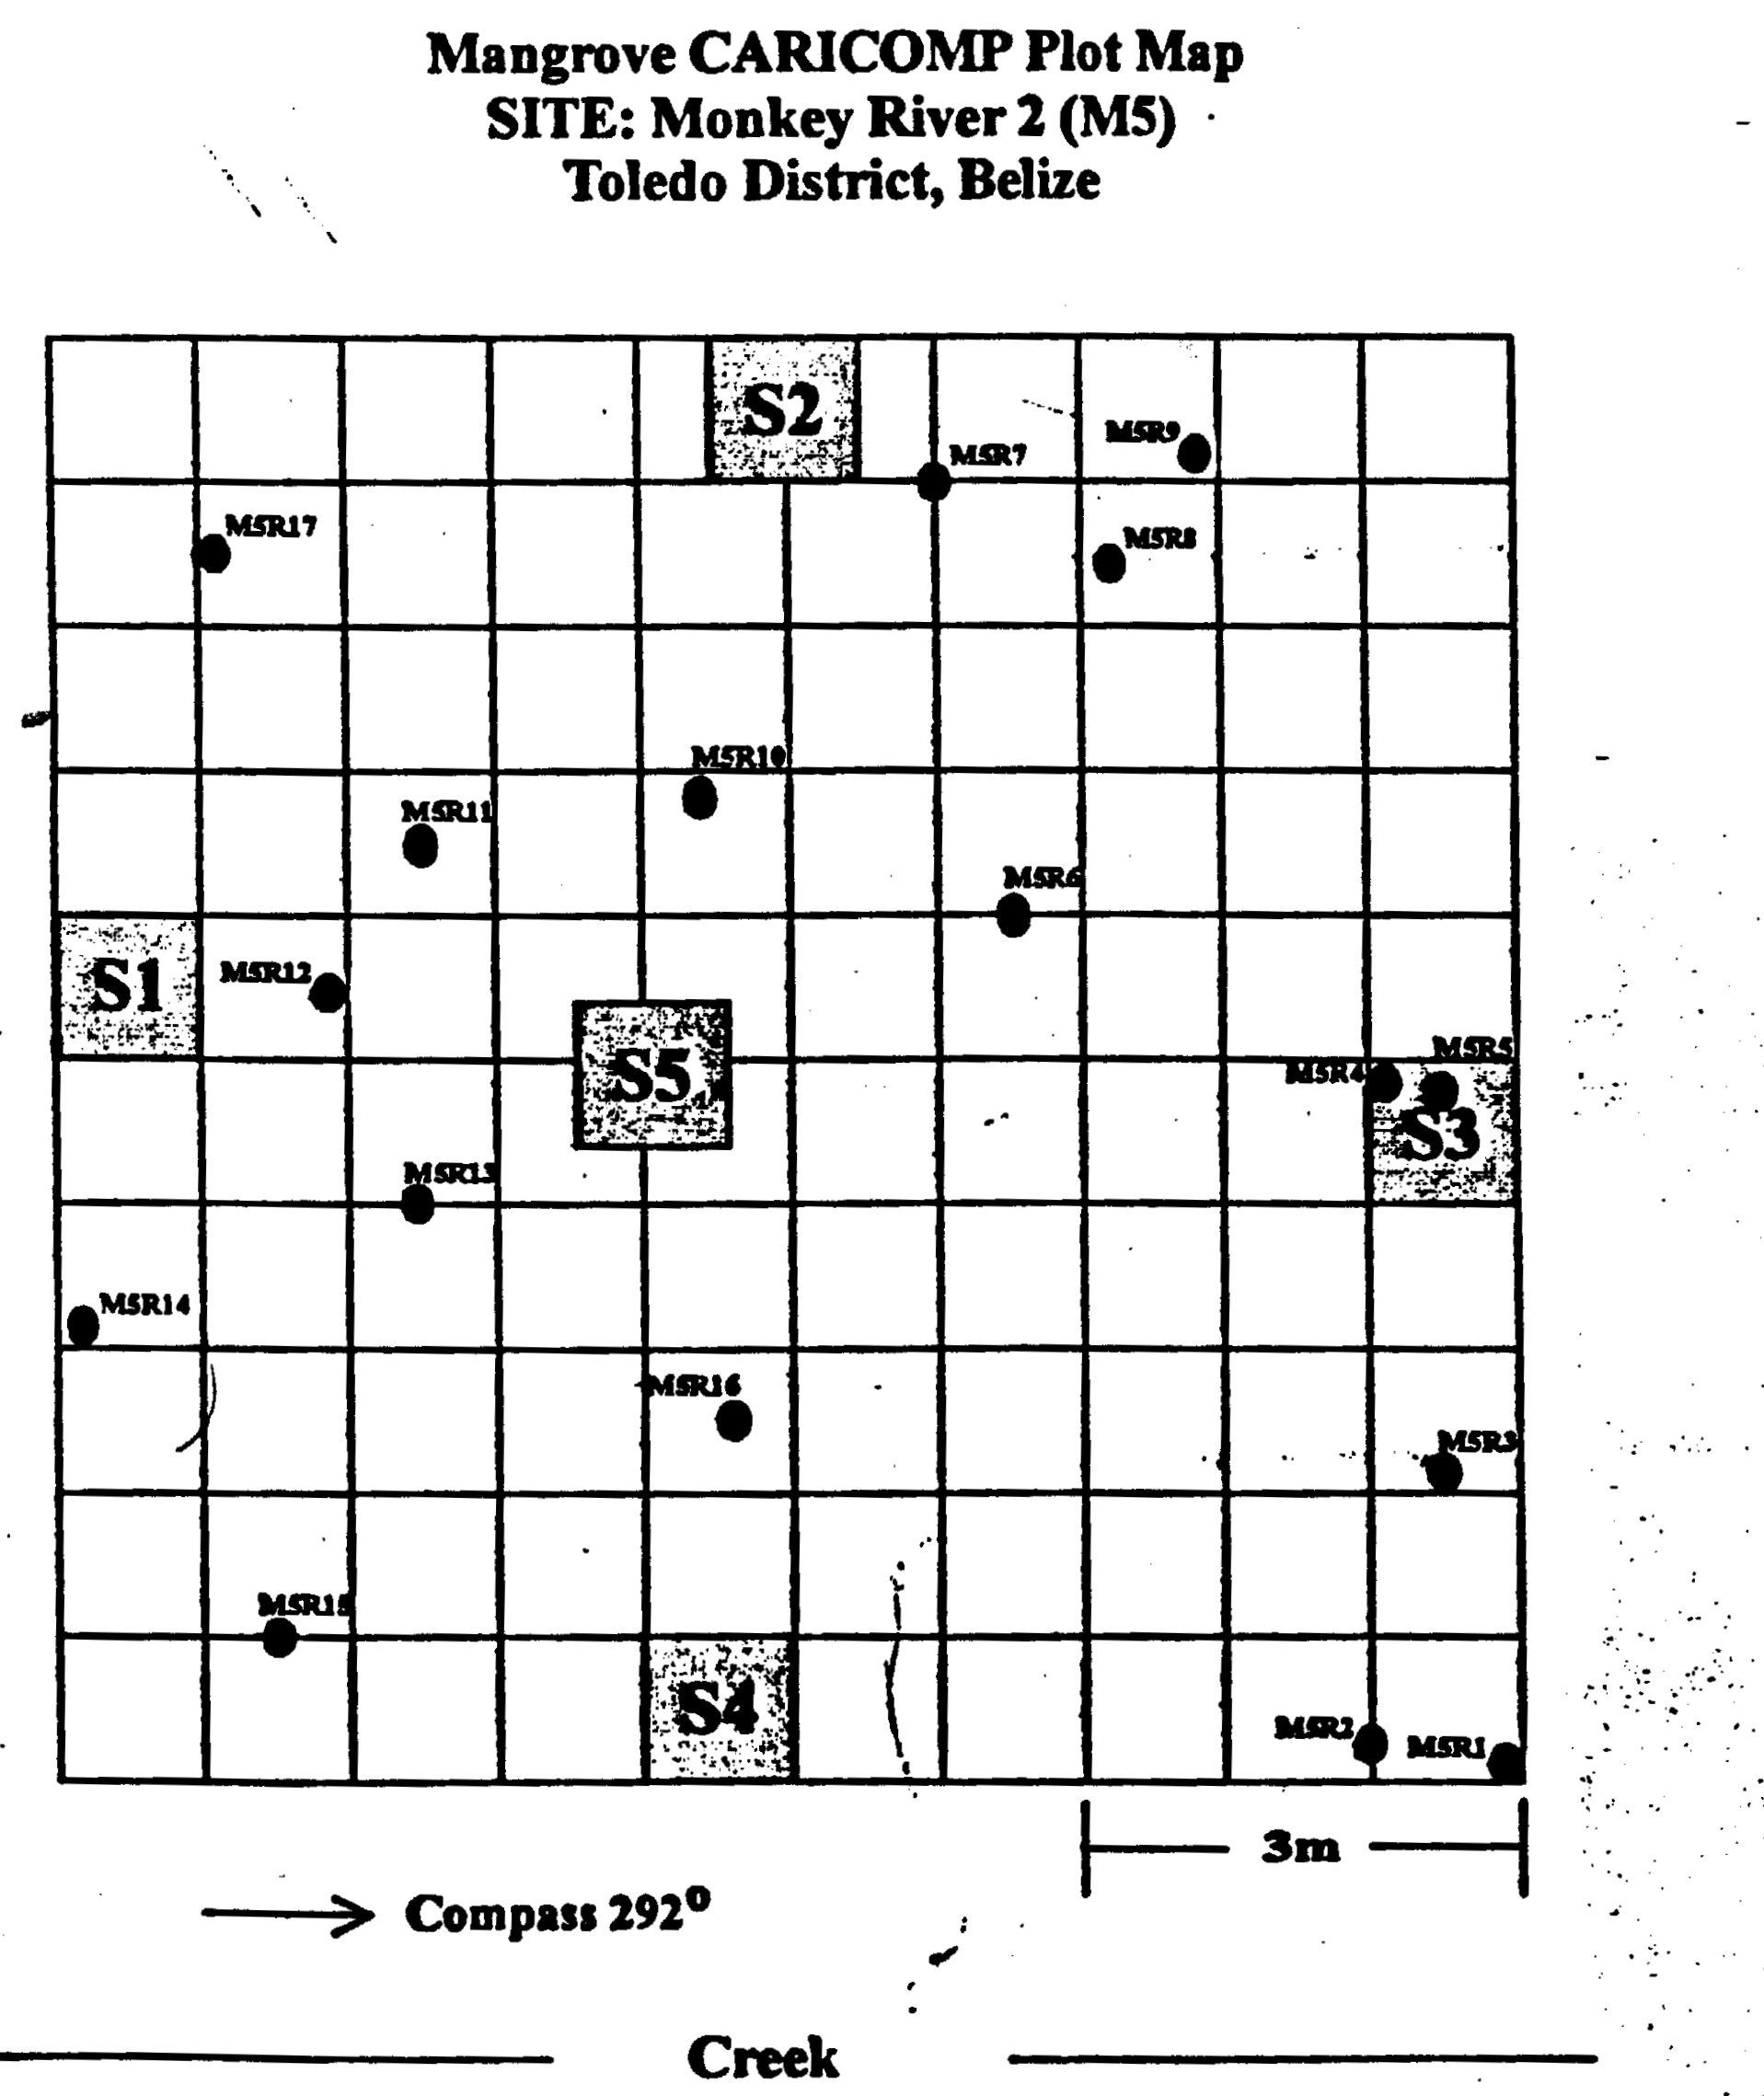
Plate 12 · original 1917×2278 px · line drawing
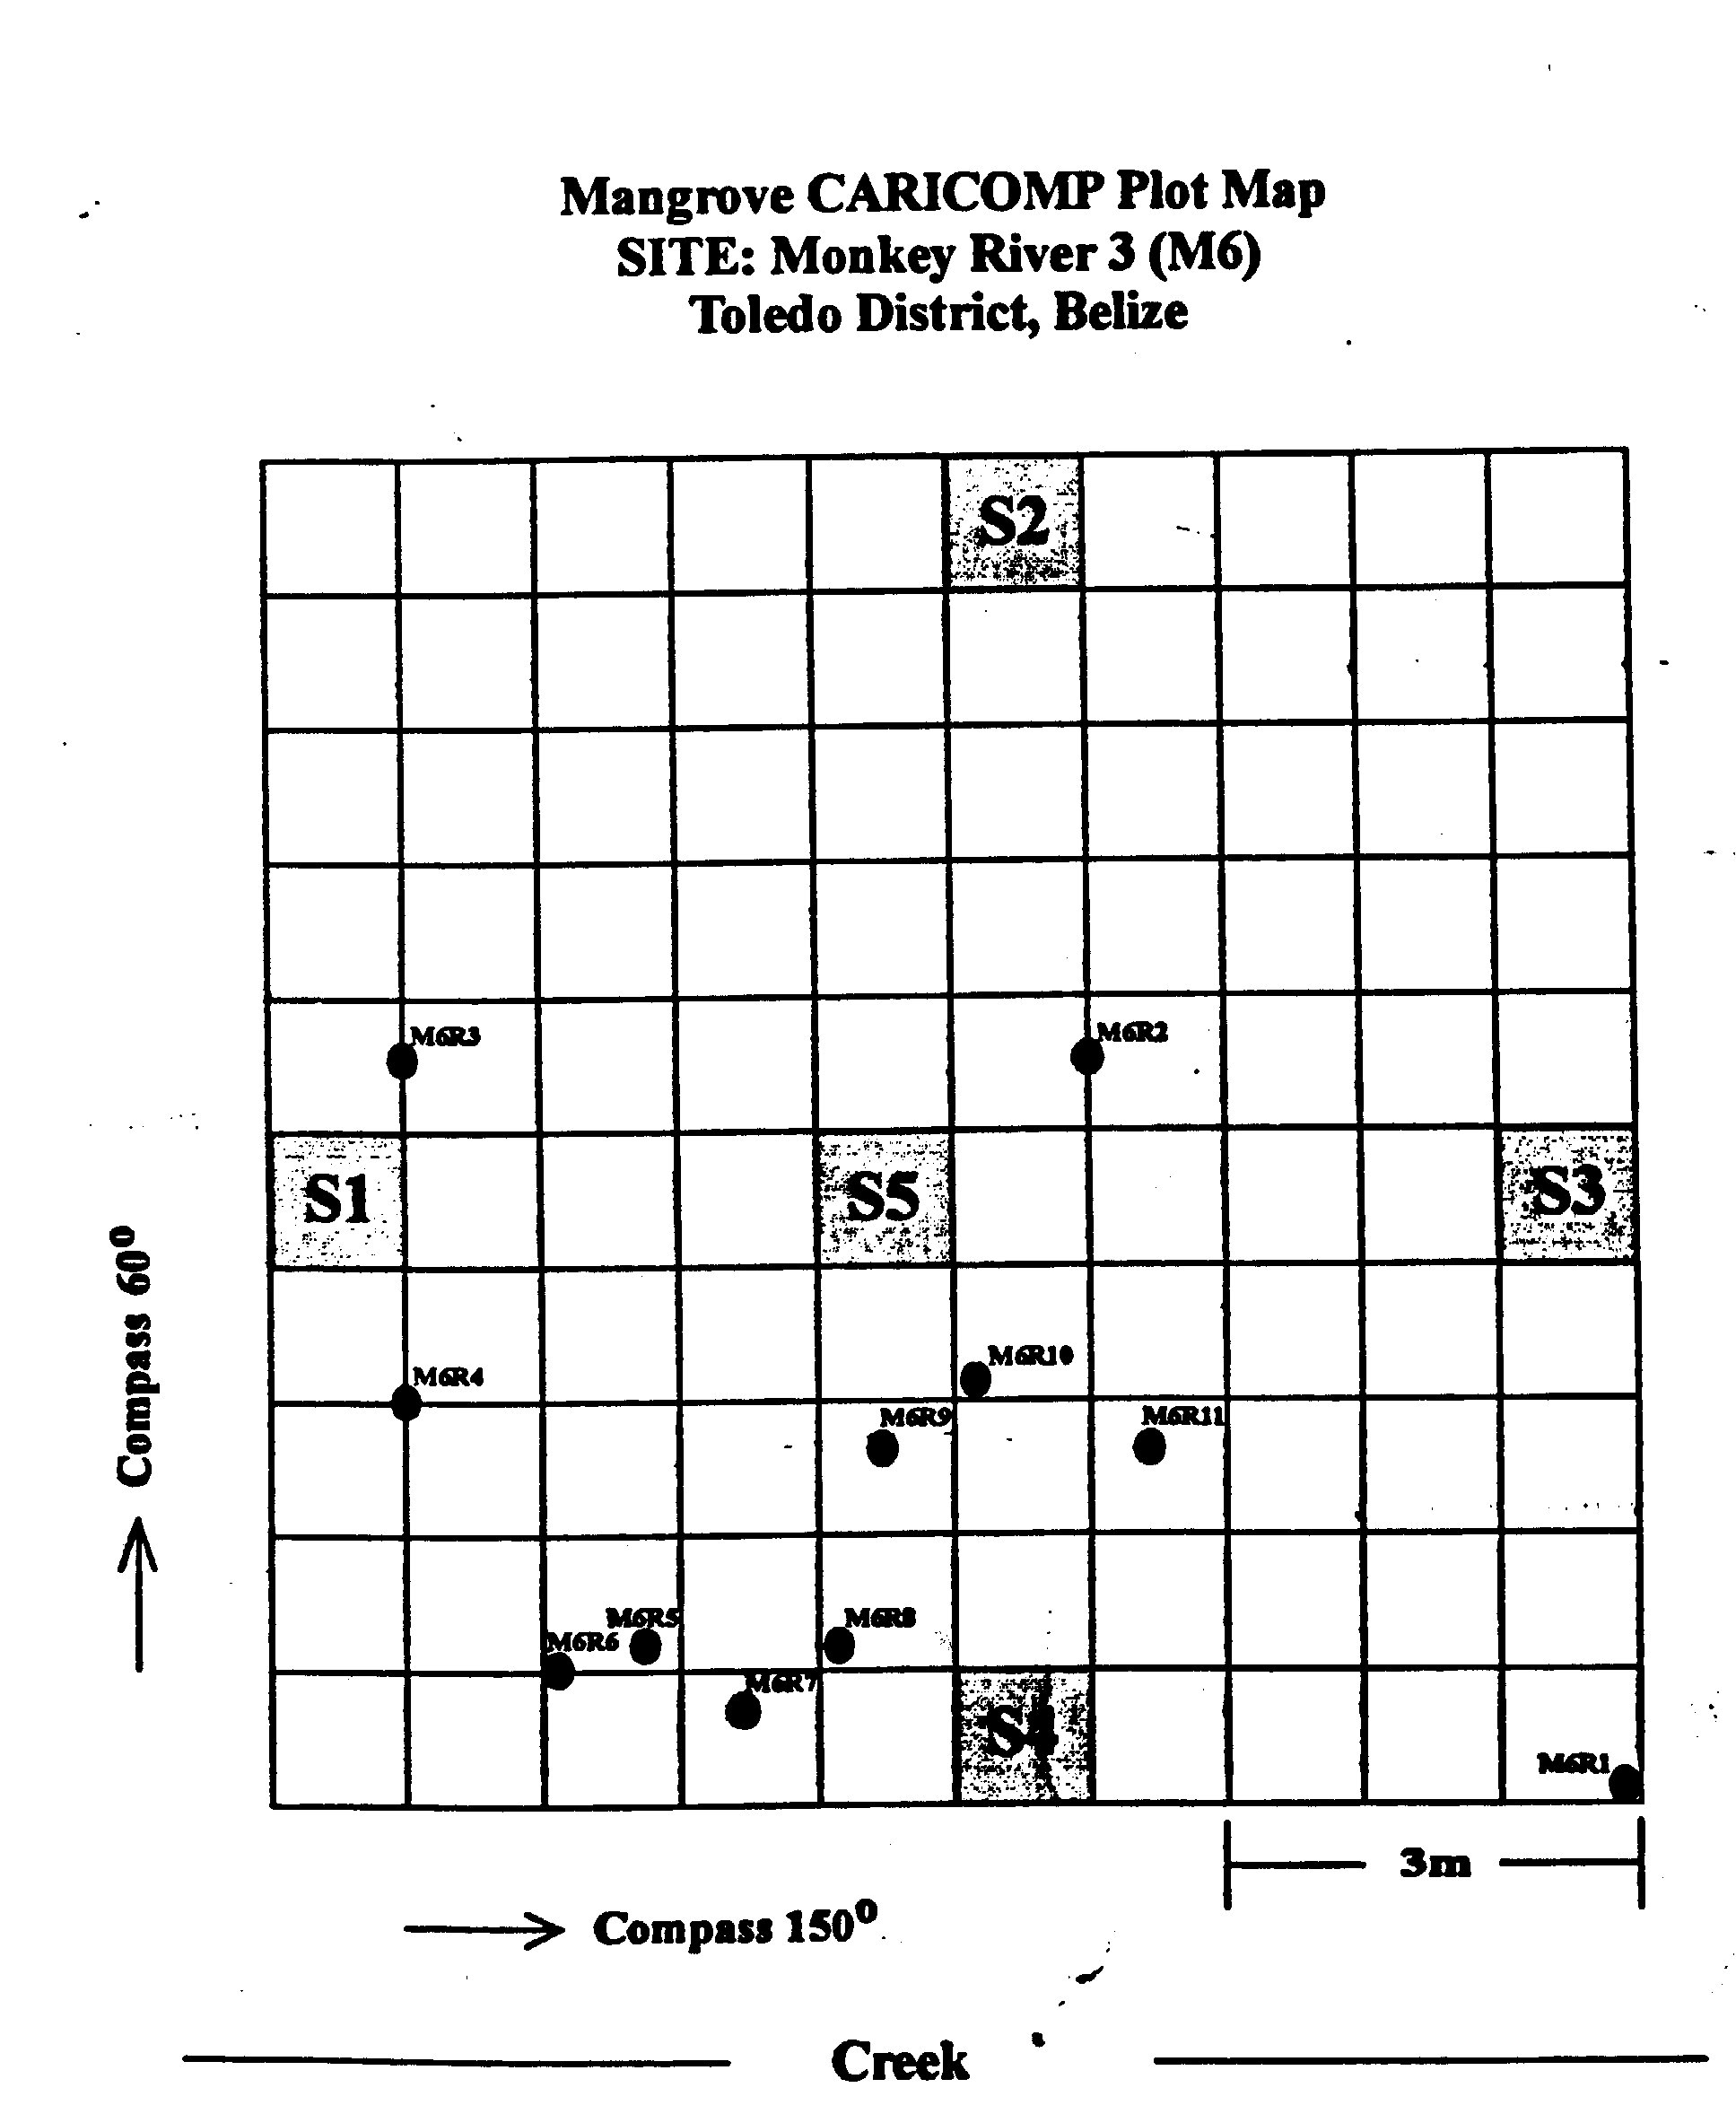
Plate 13 · original 1935×2356 px · line drawing
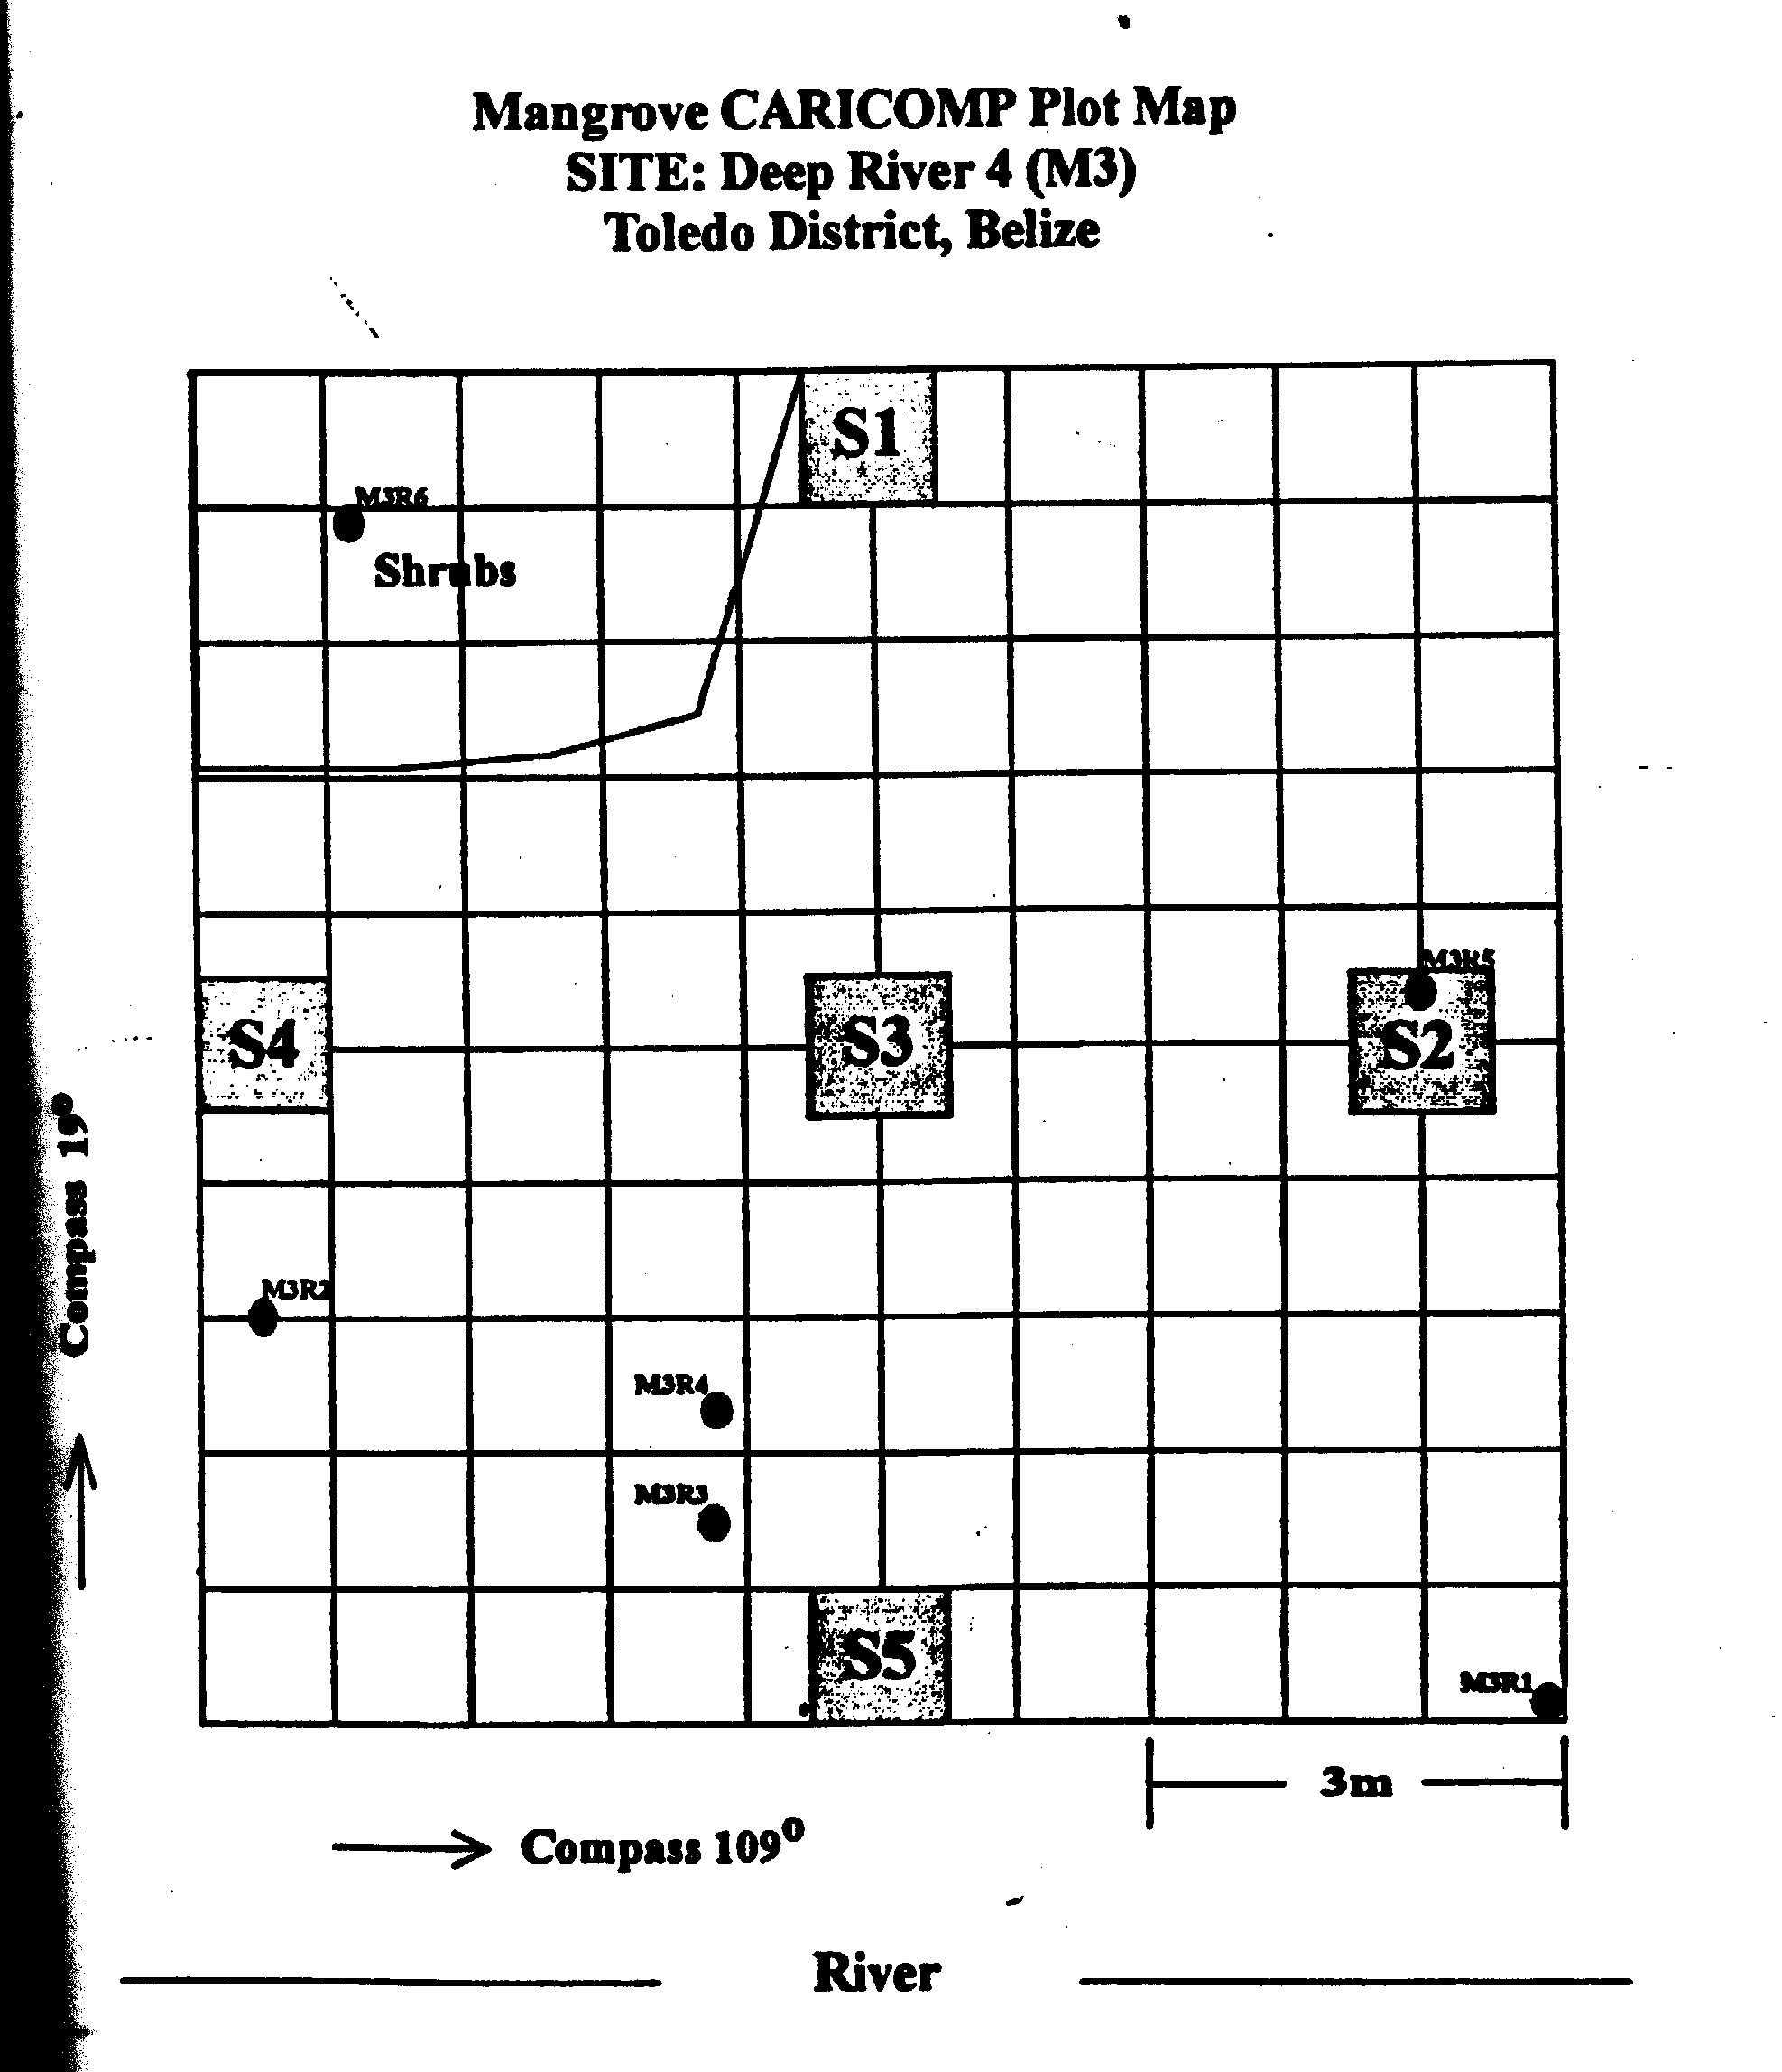
Plate 14 · original 1975×2296 px · line drawing
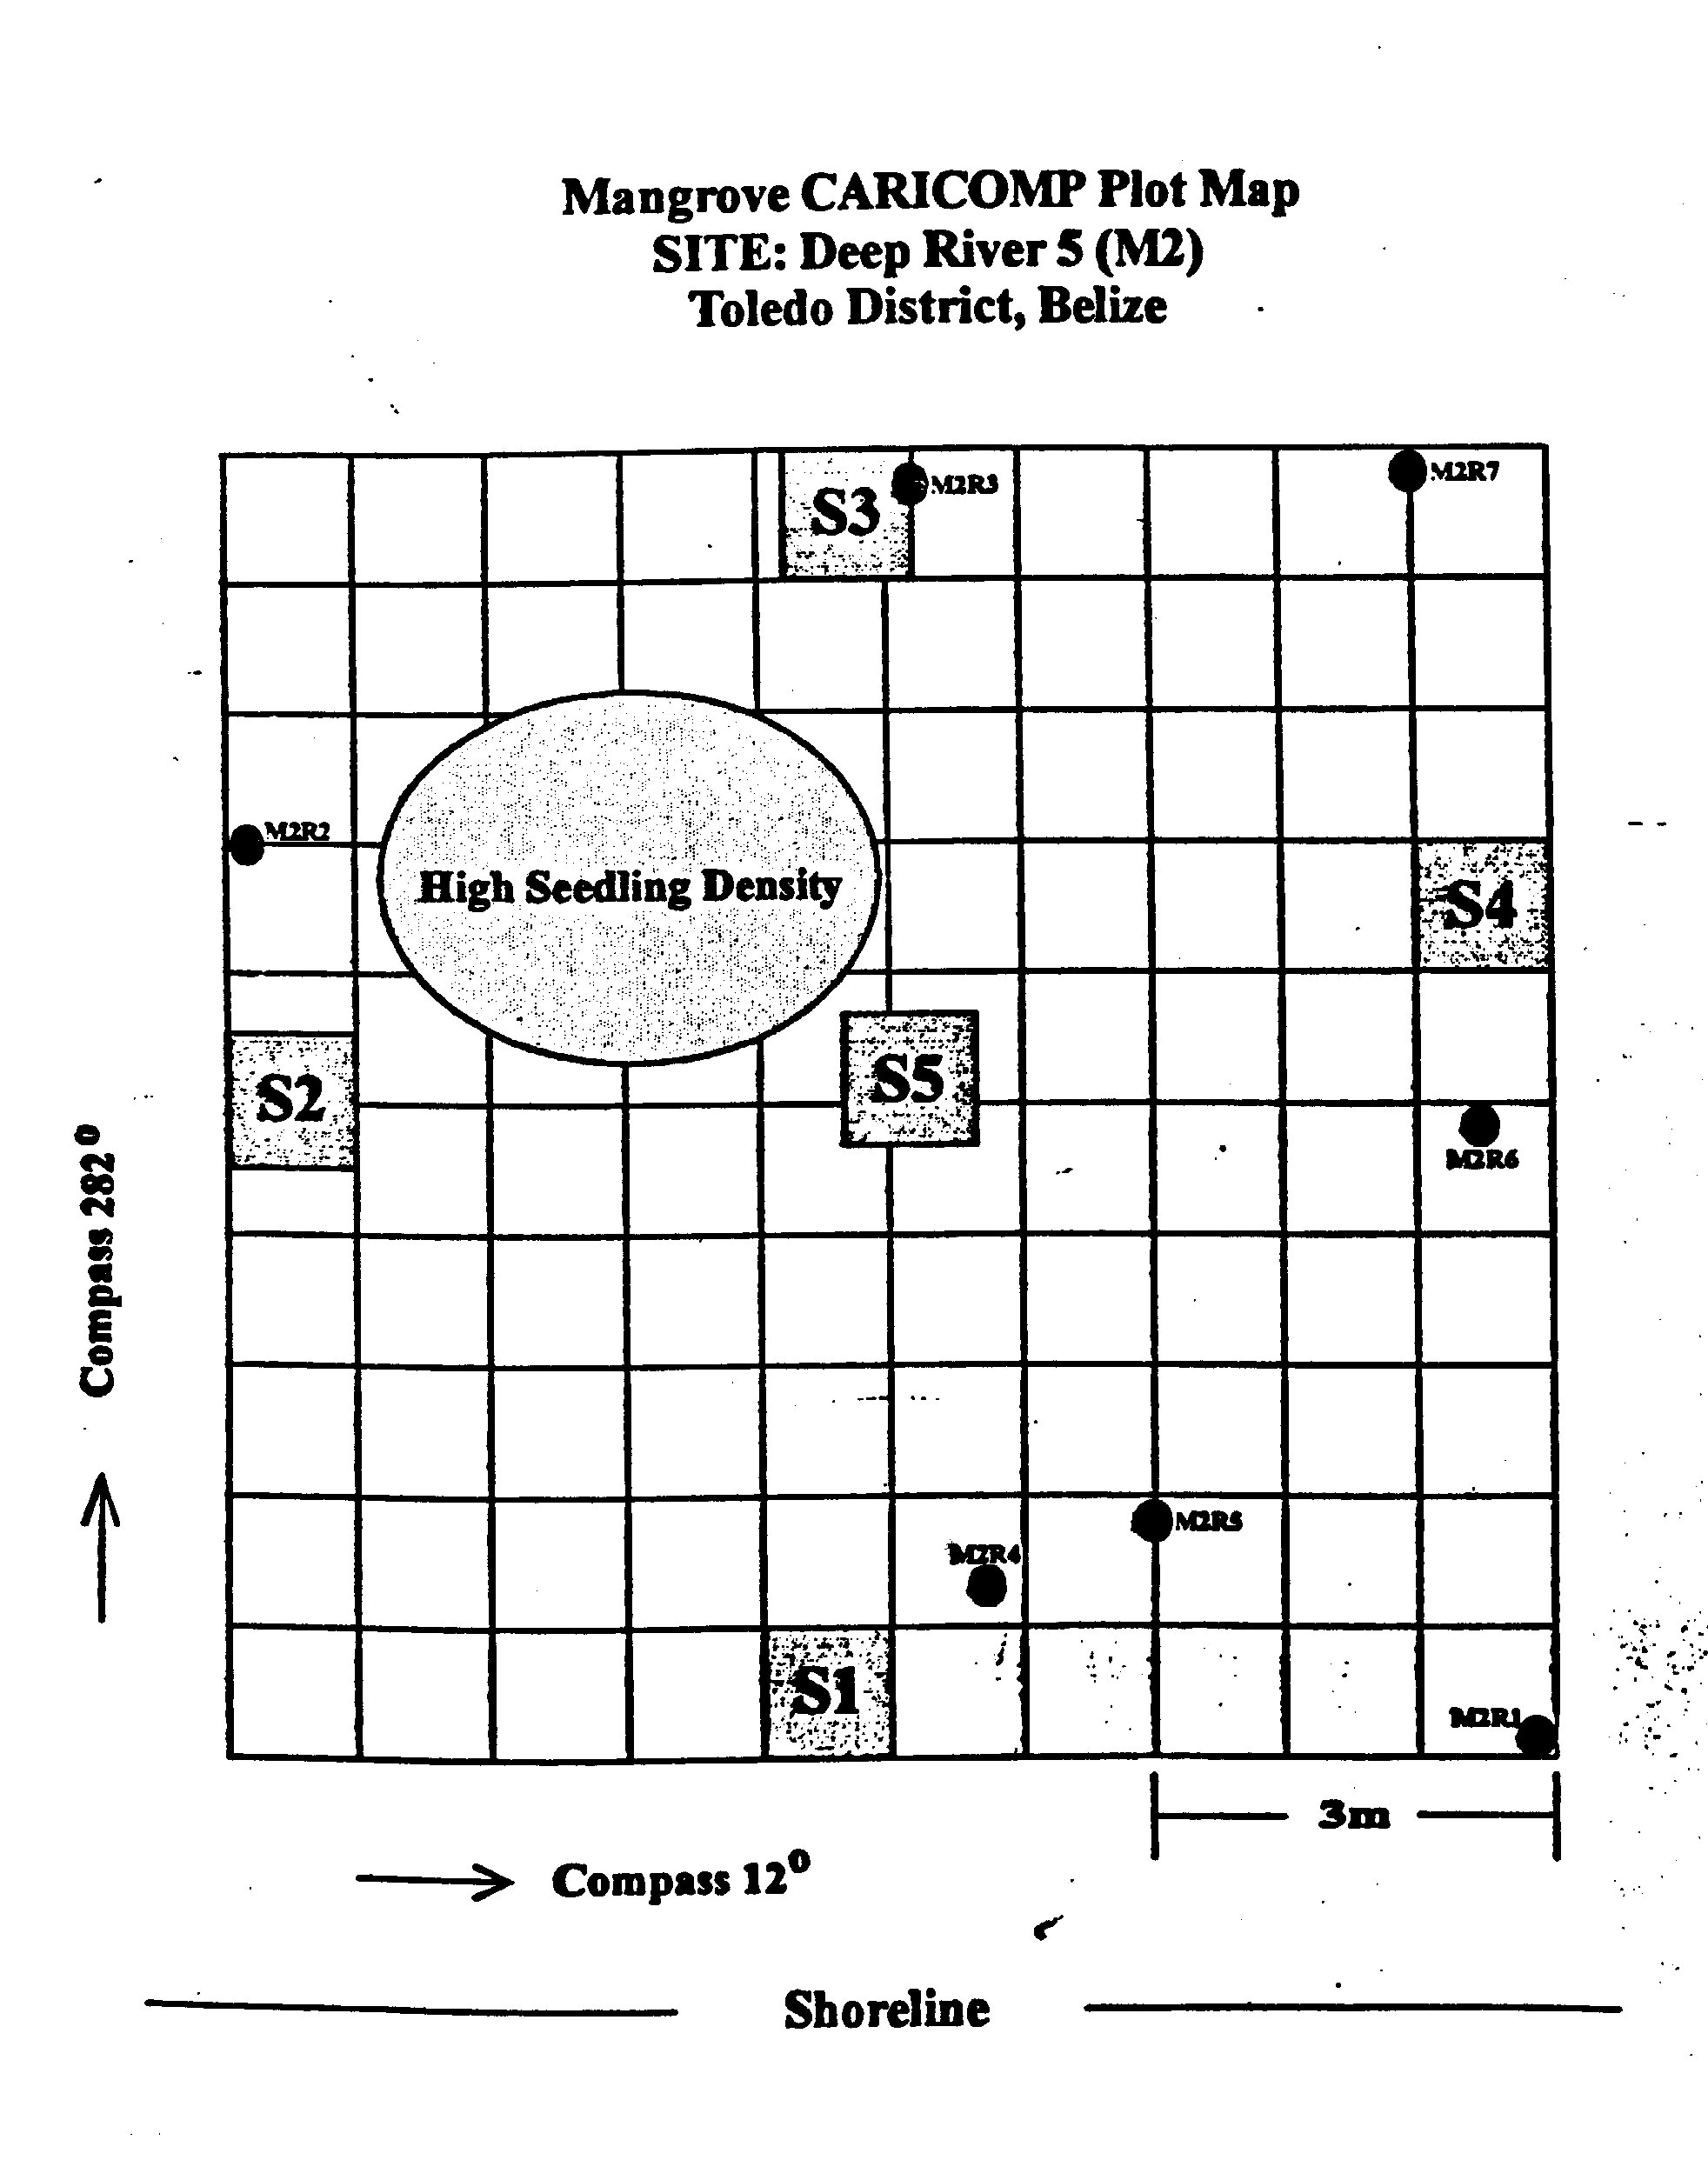
Plate 15 · original 1964×2484 px · line drawing
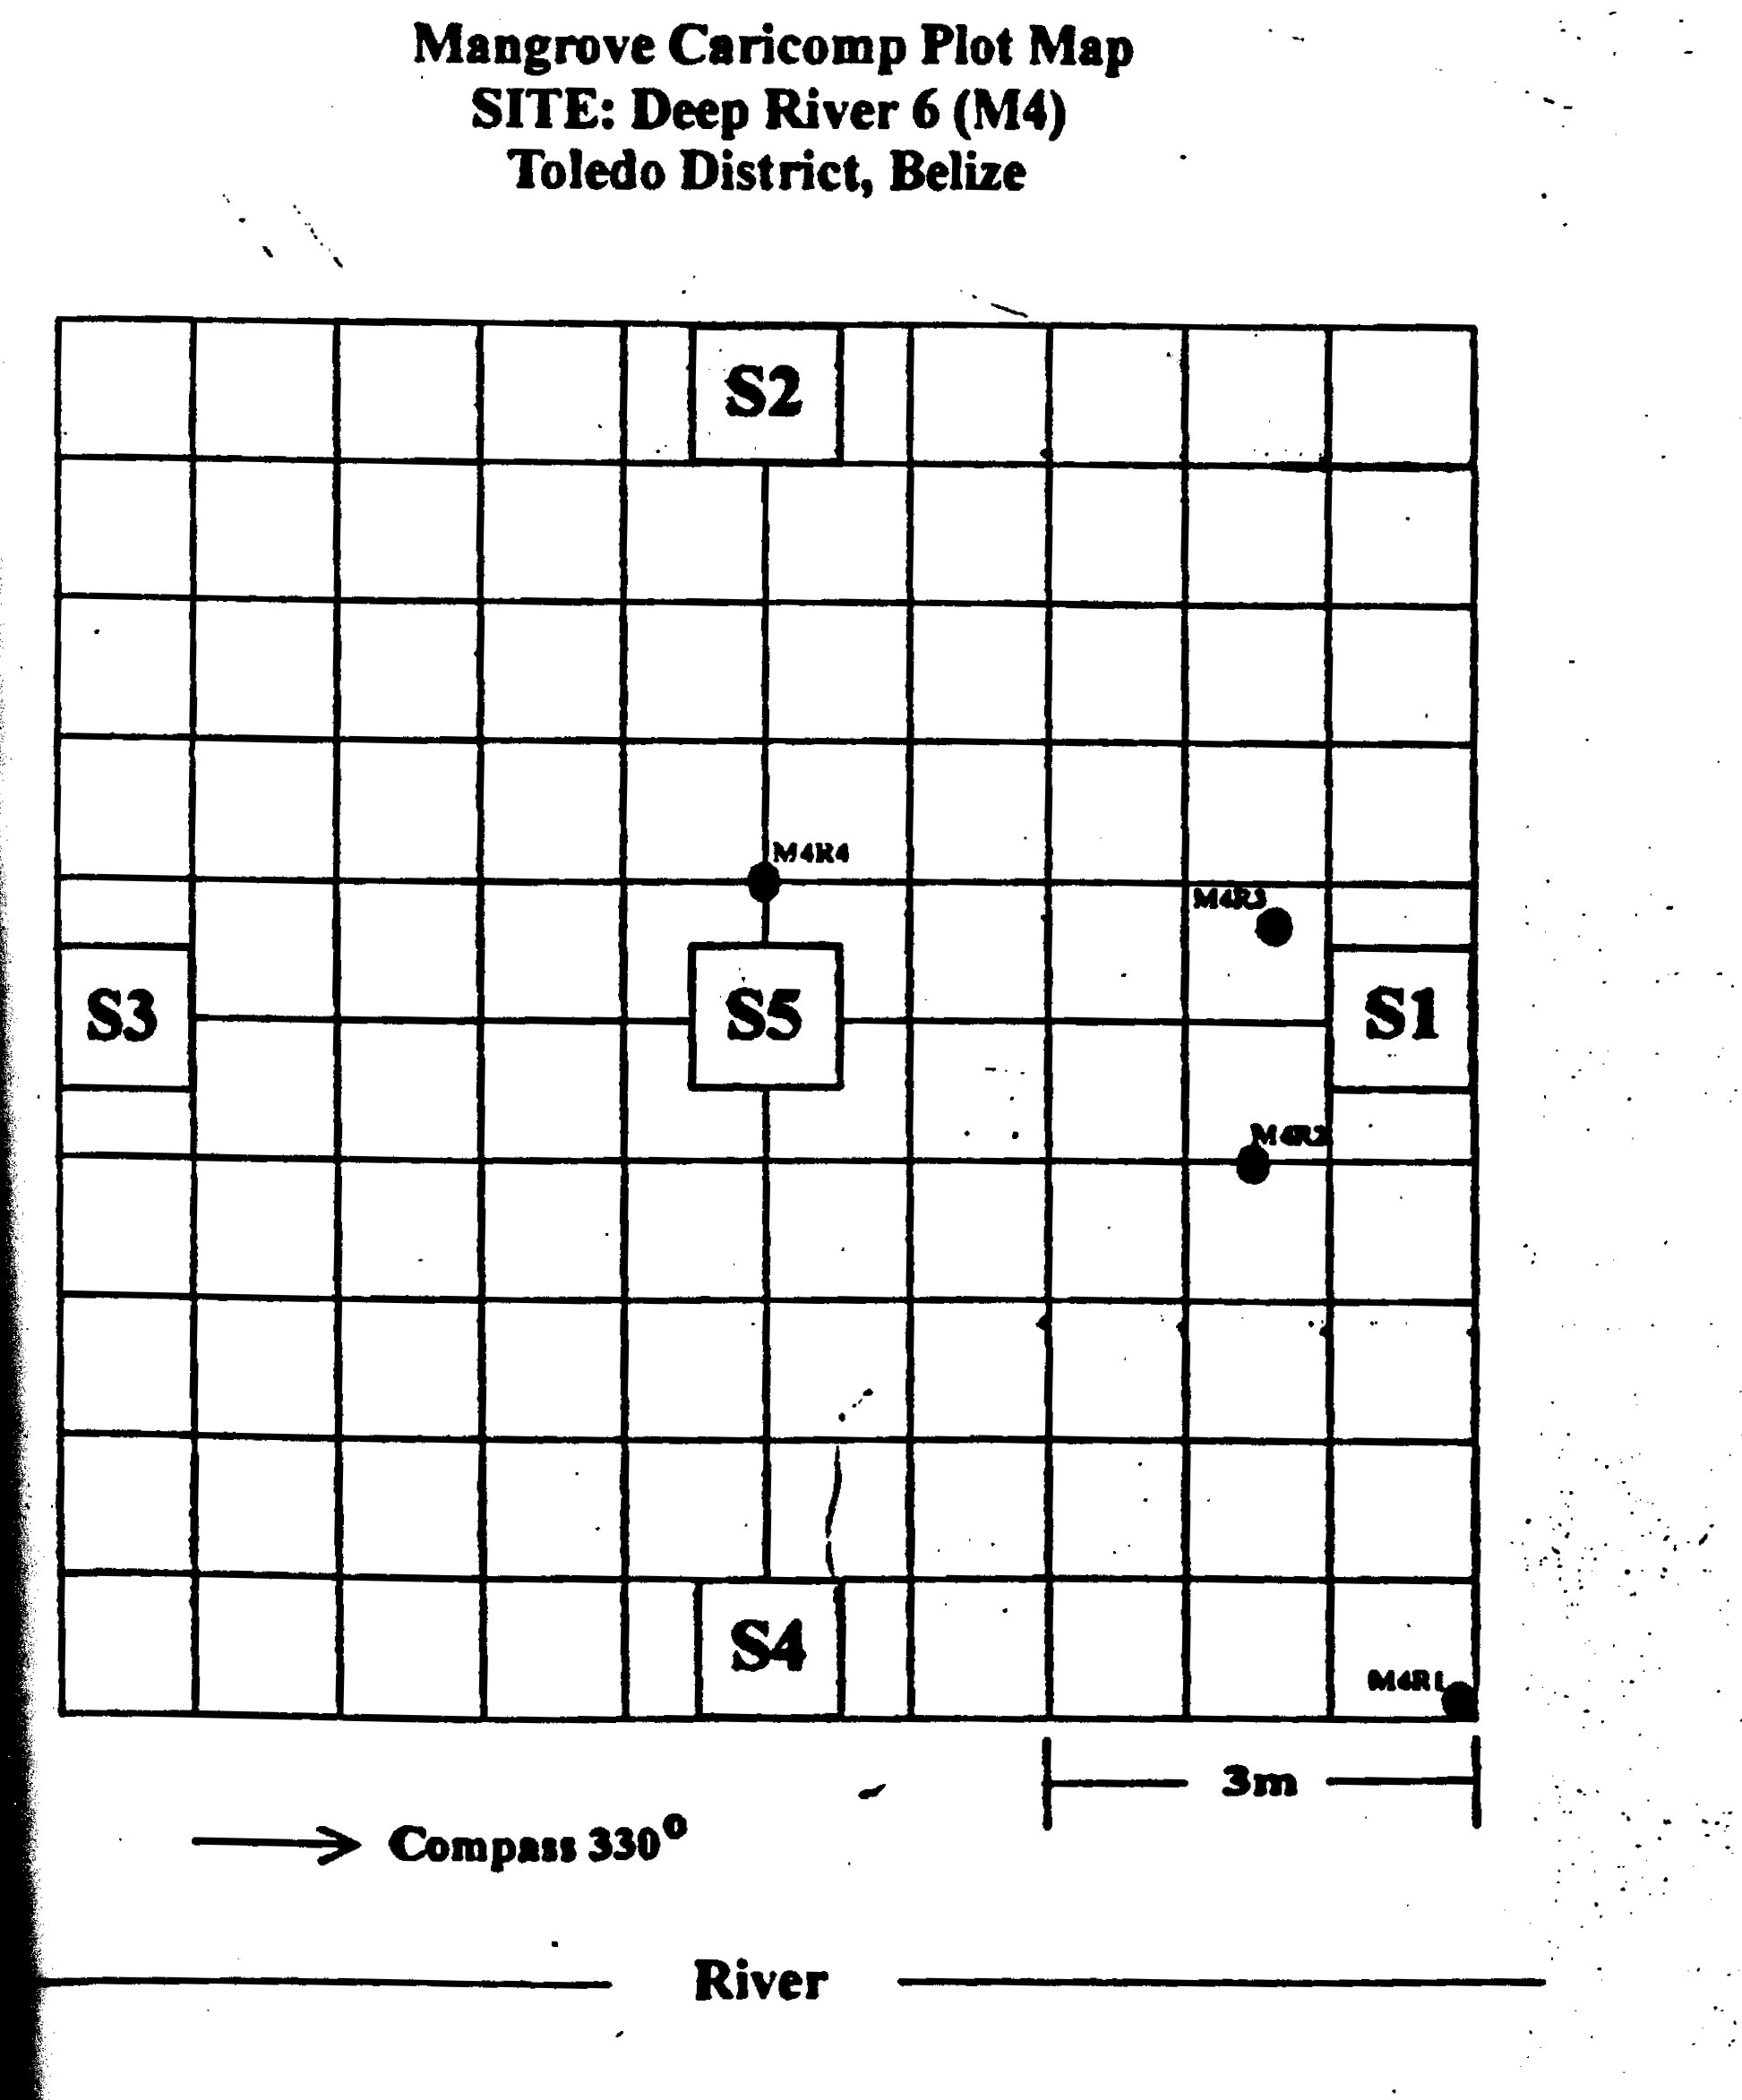
Plate 16 · original 1945×2345 px · line drawing
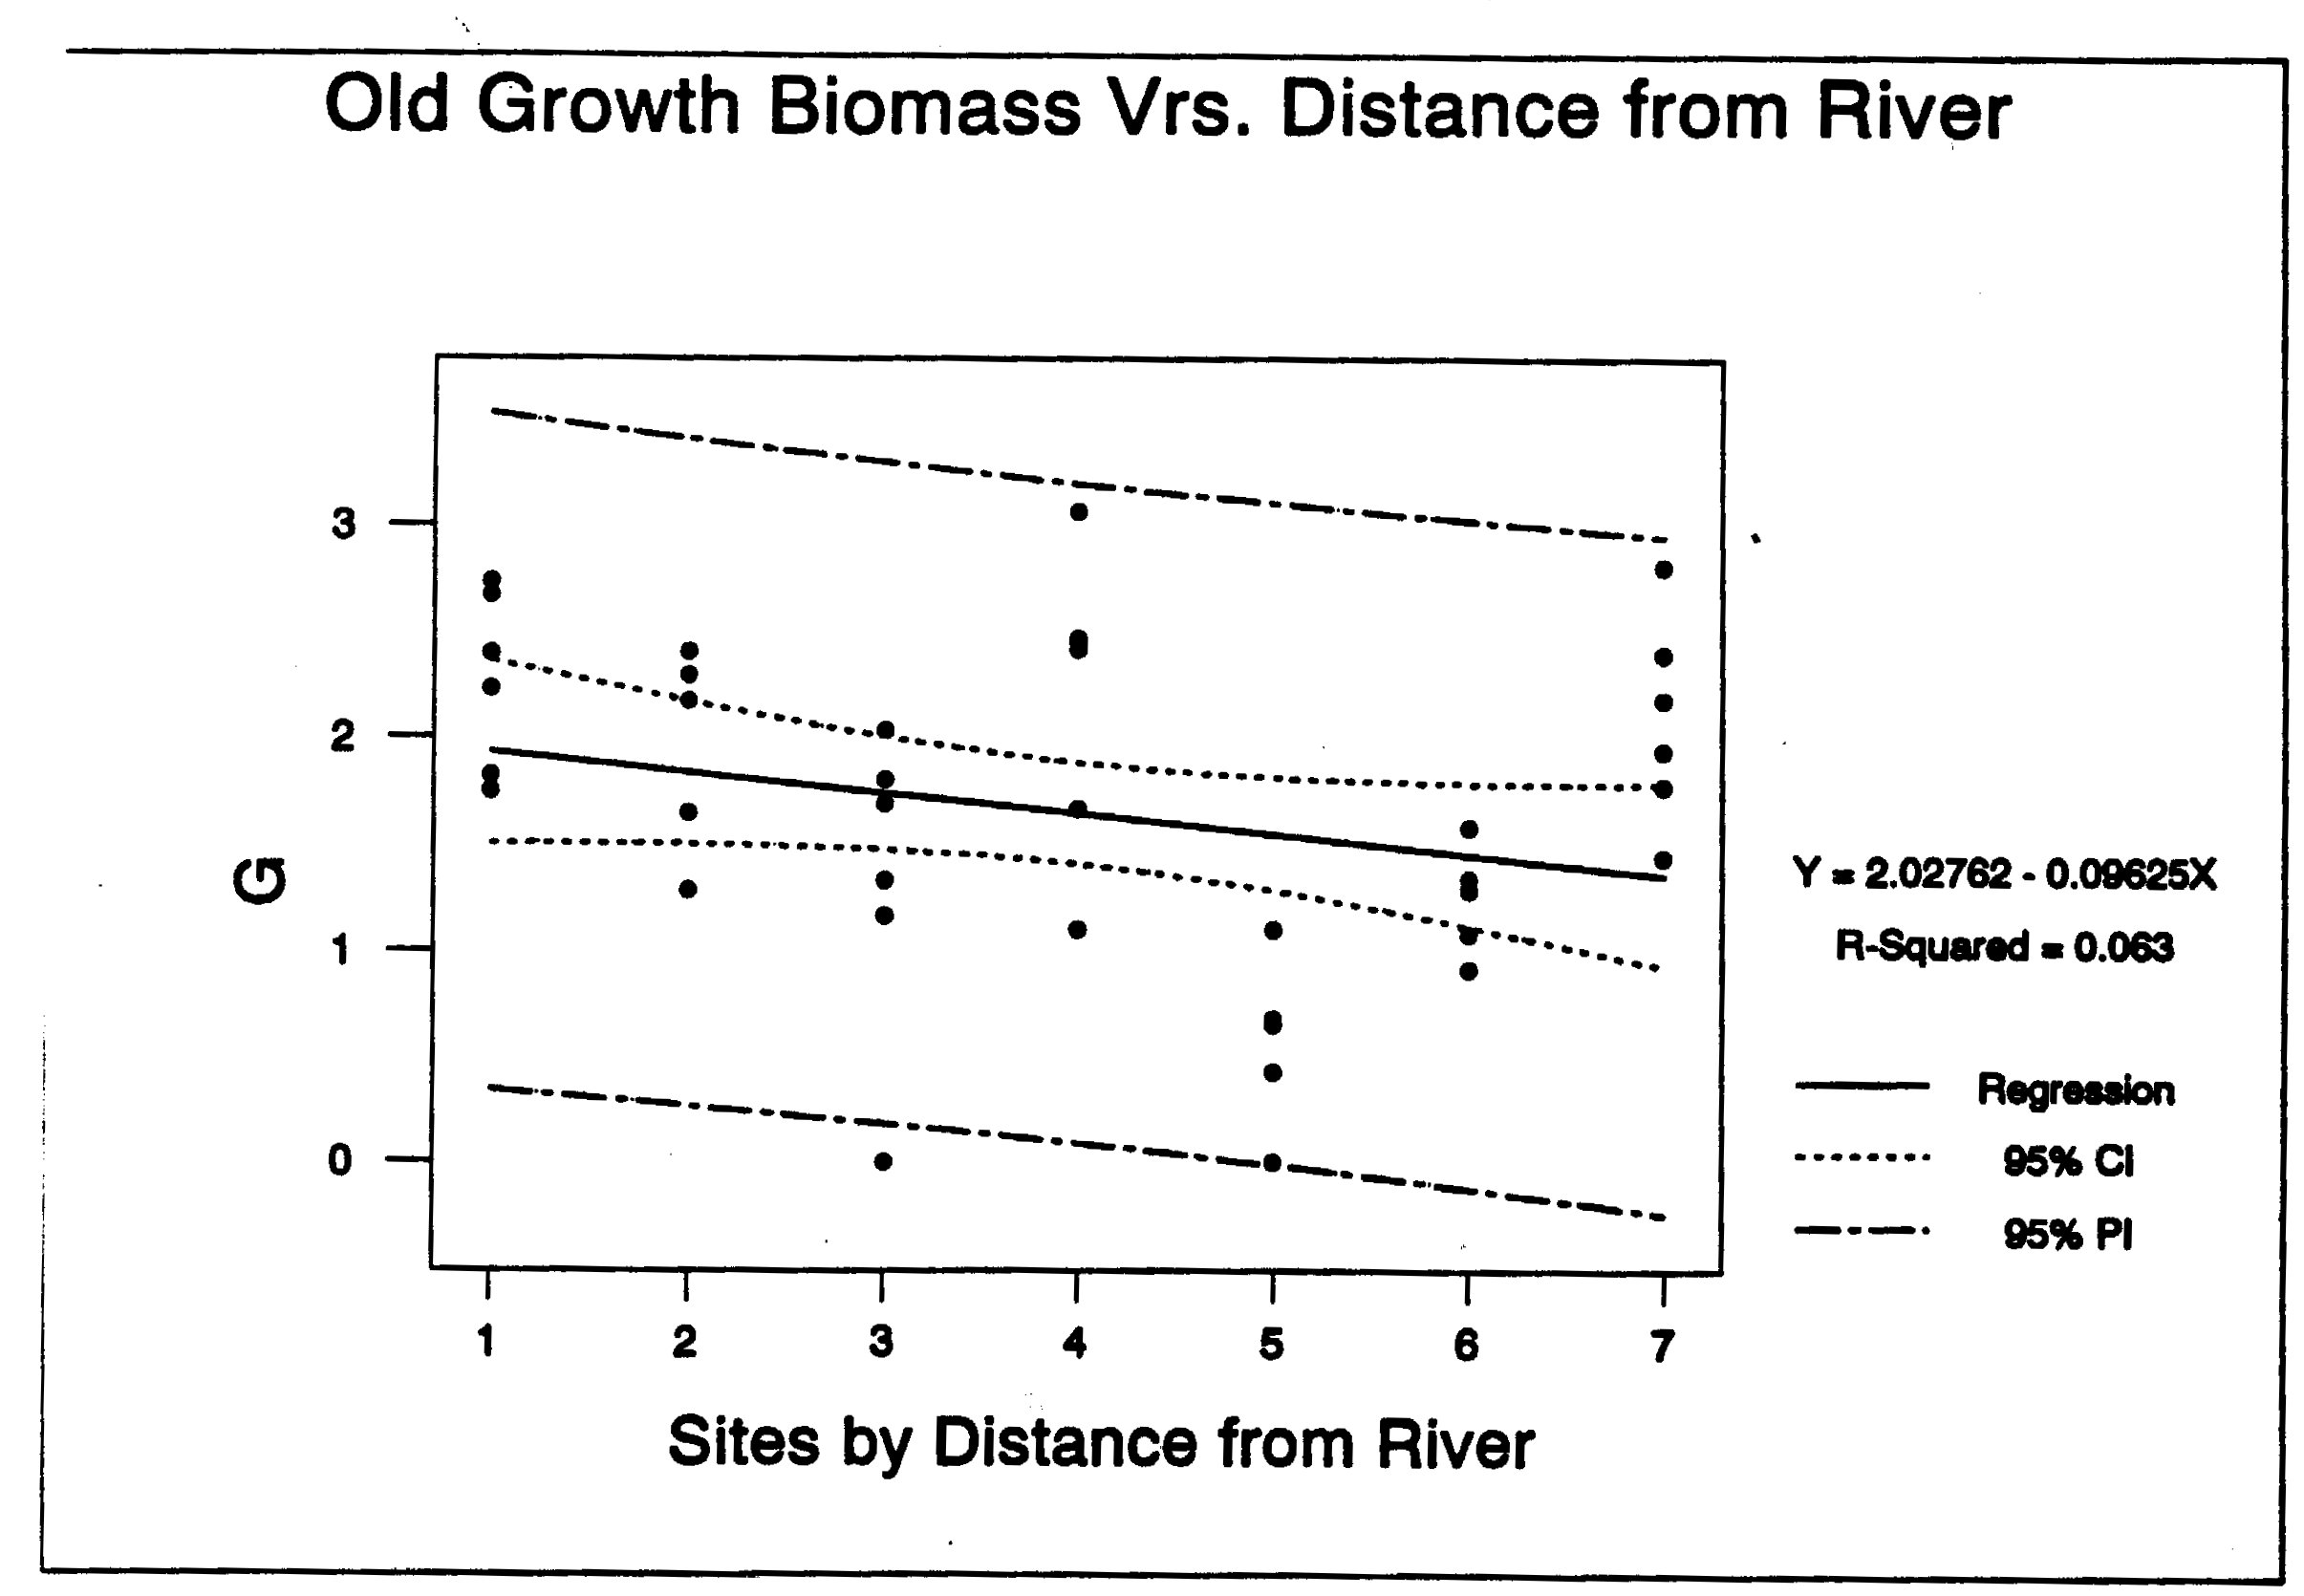
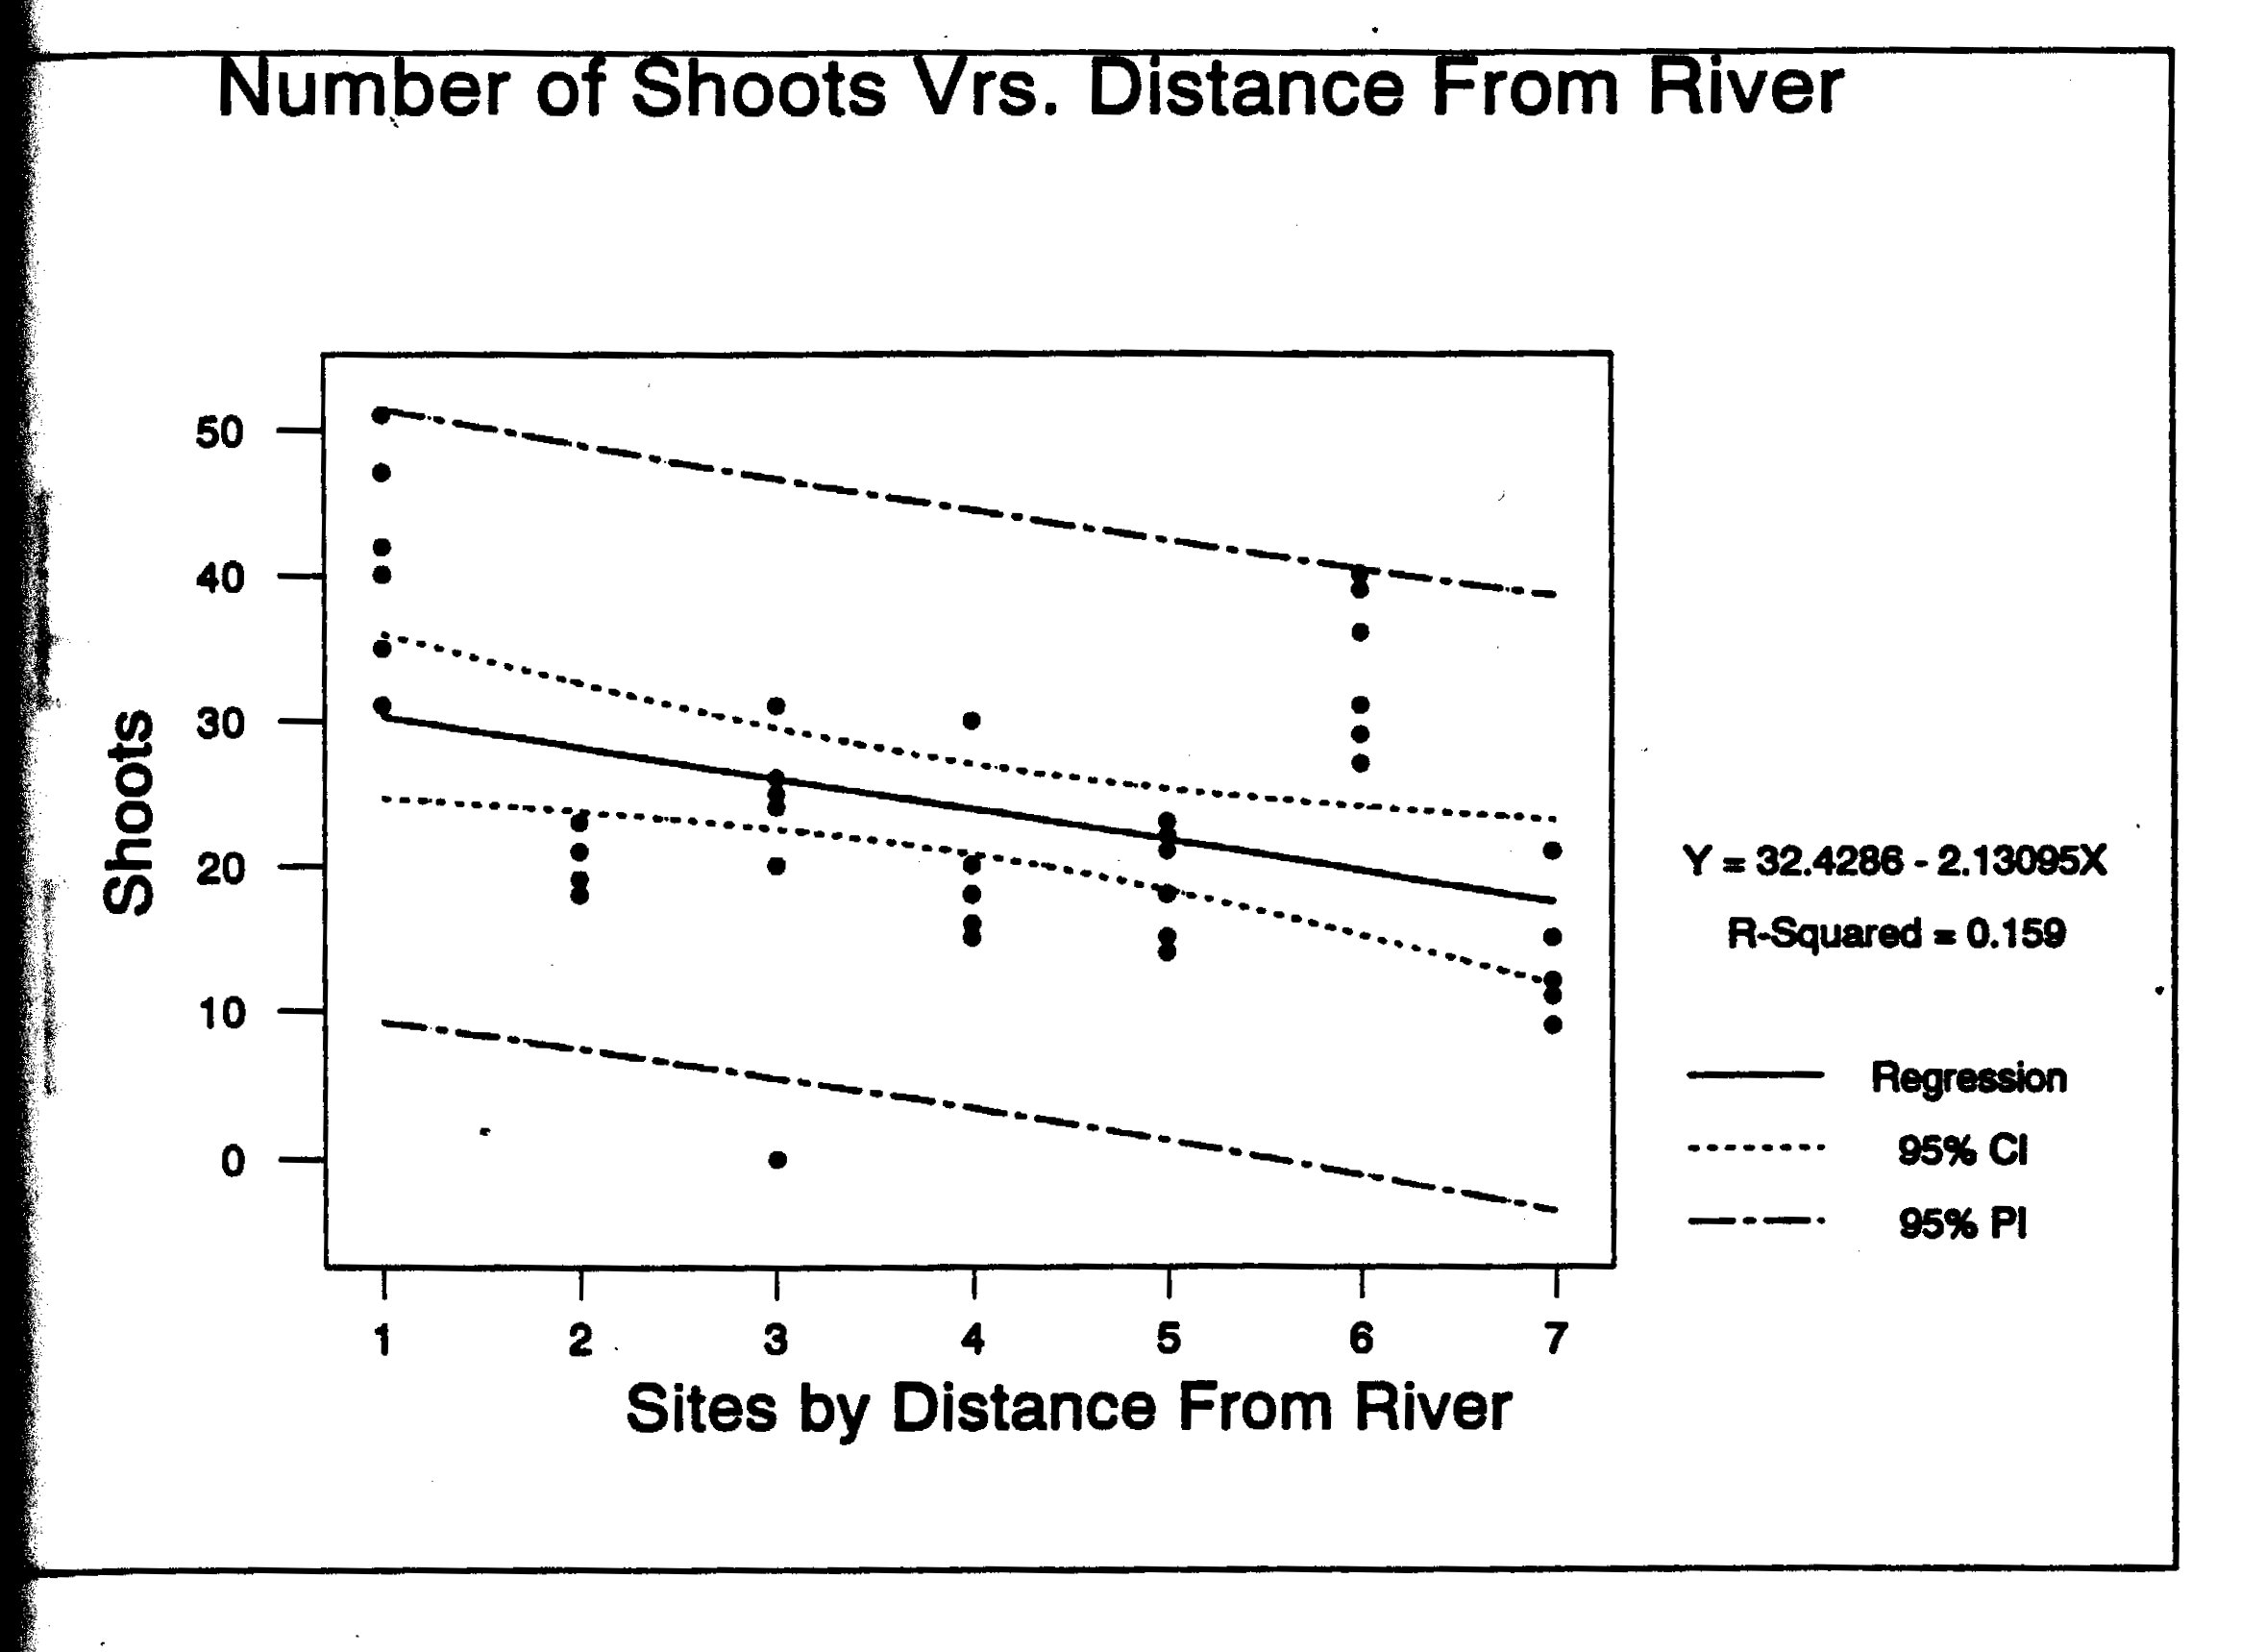
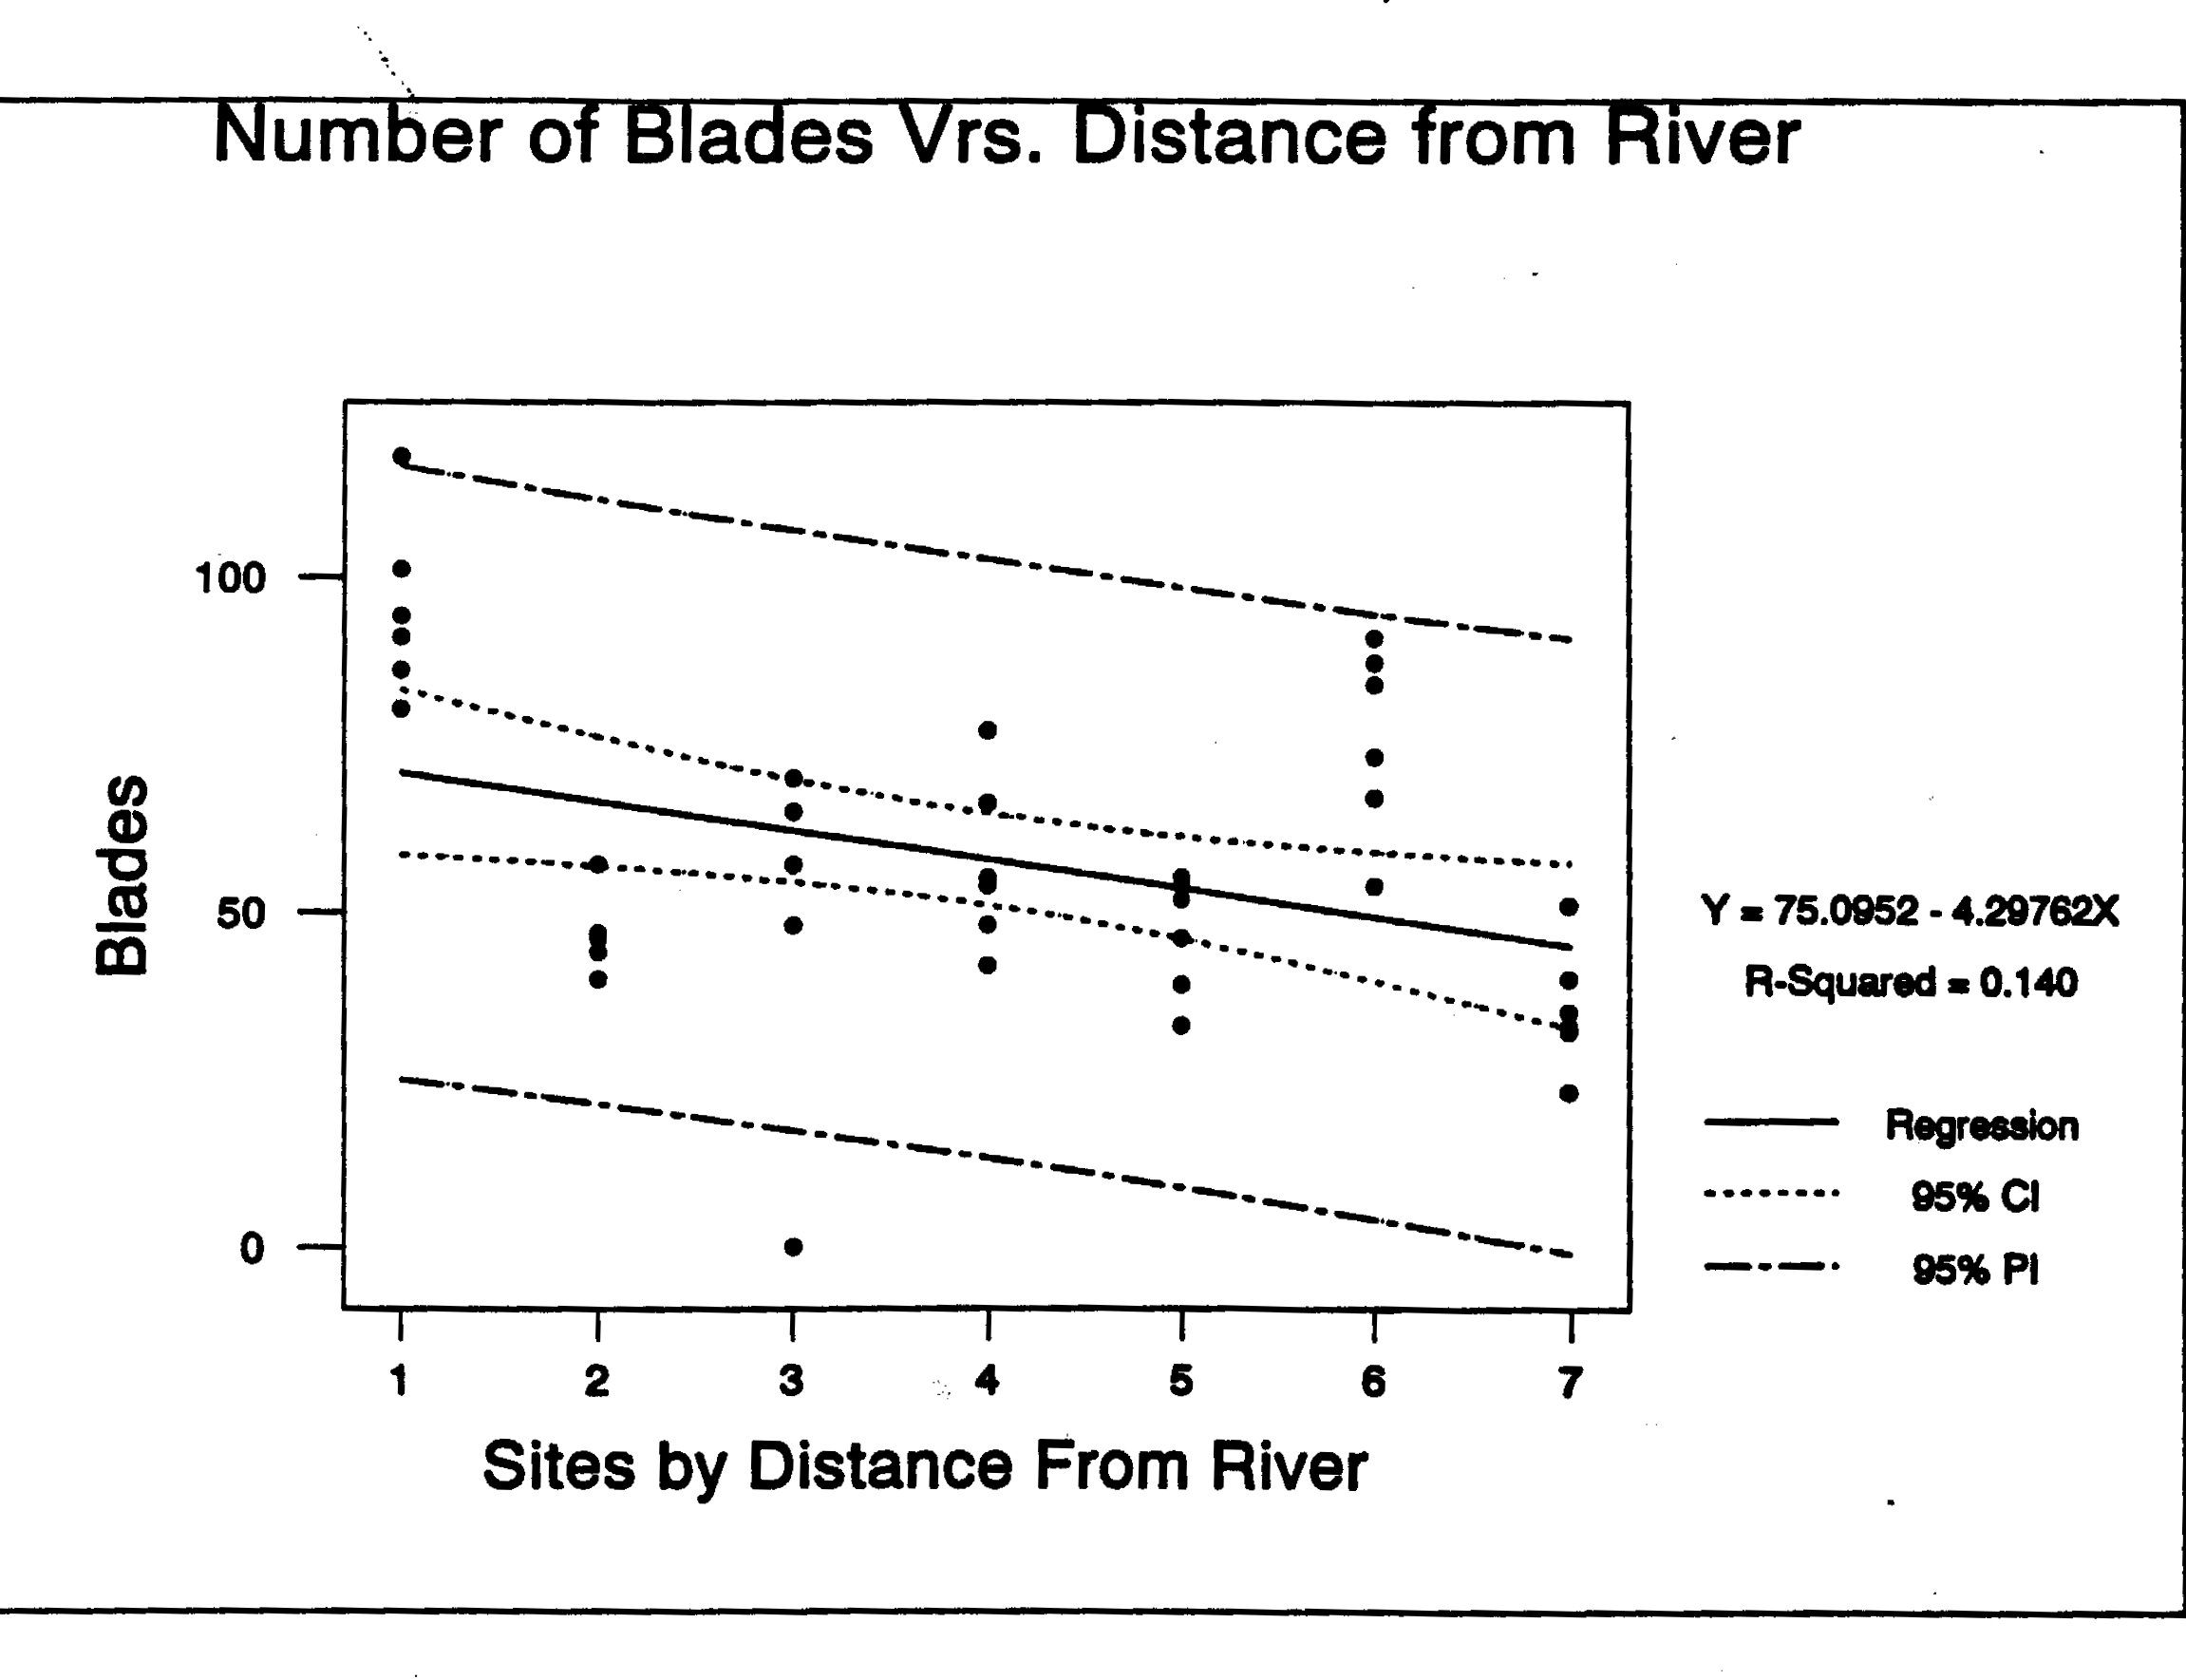
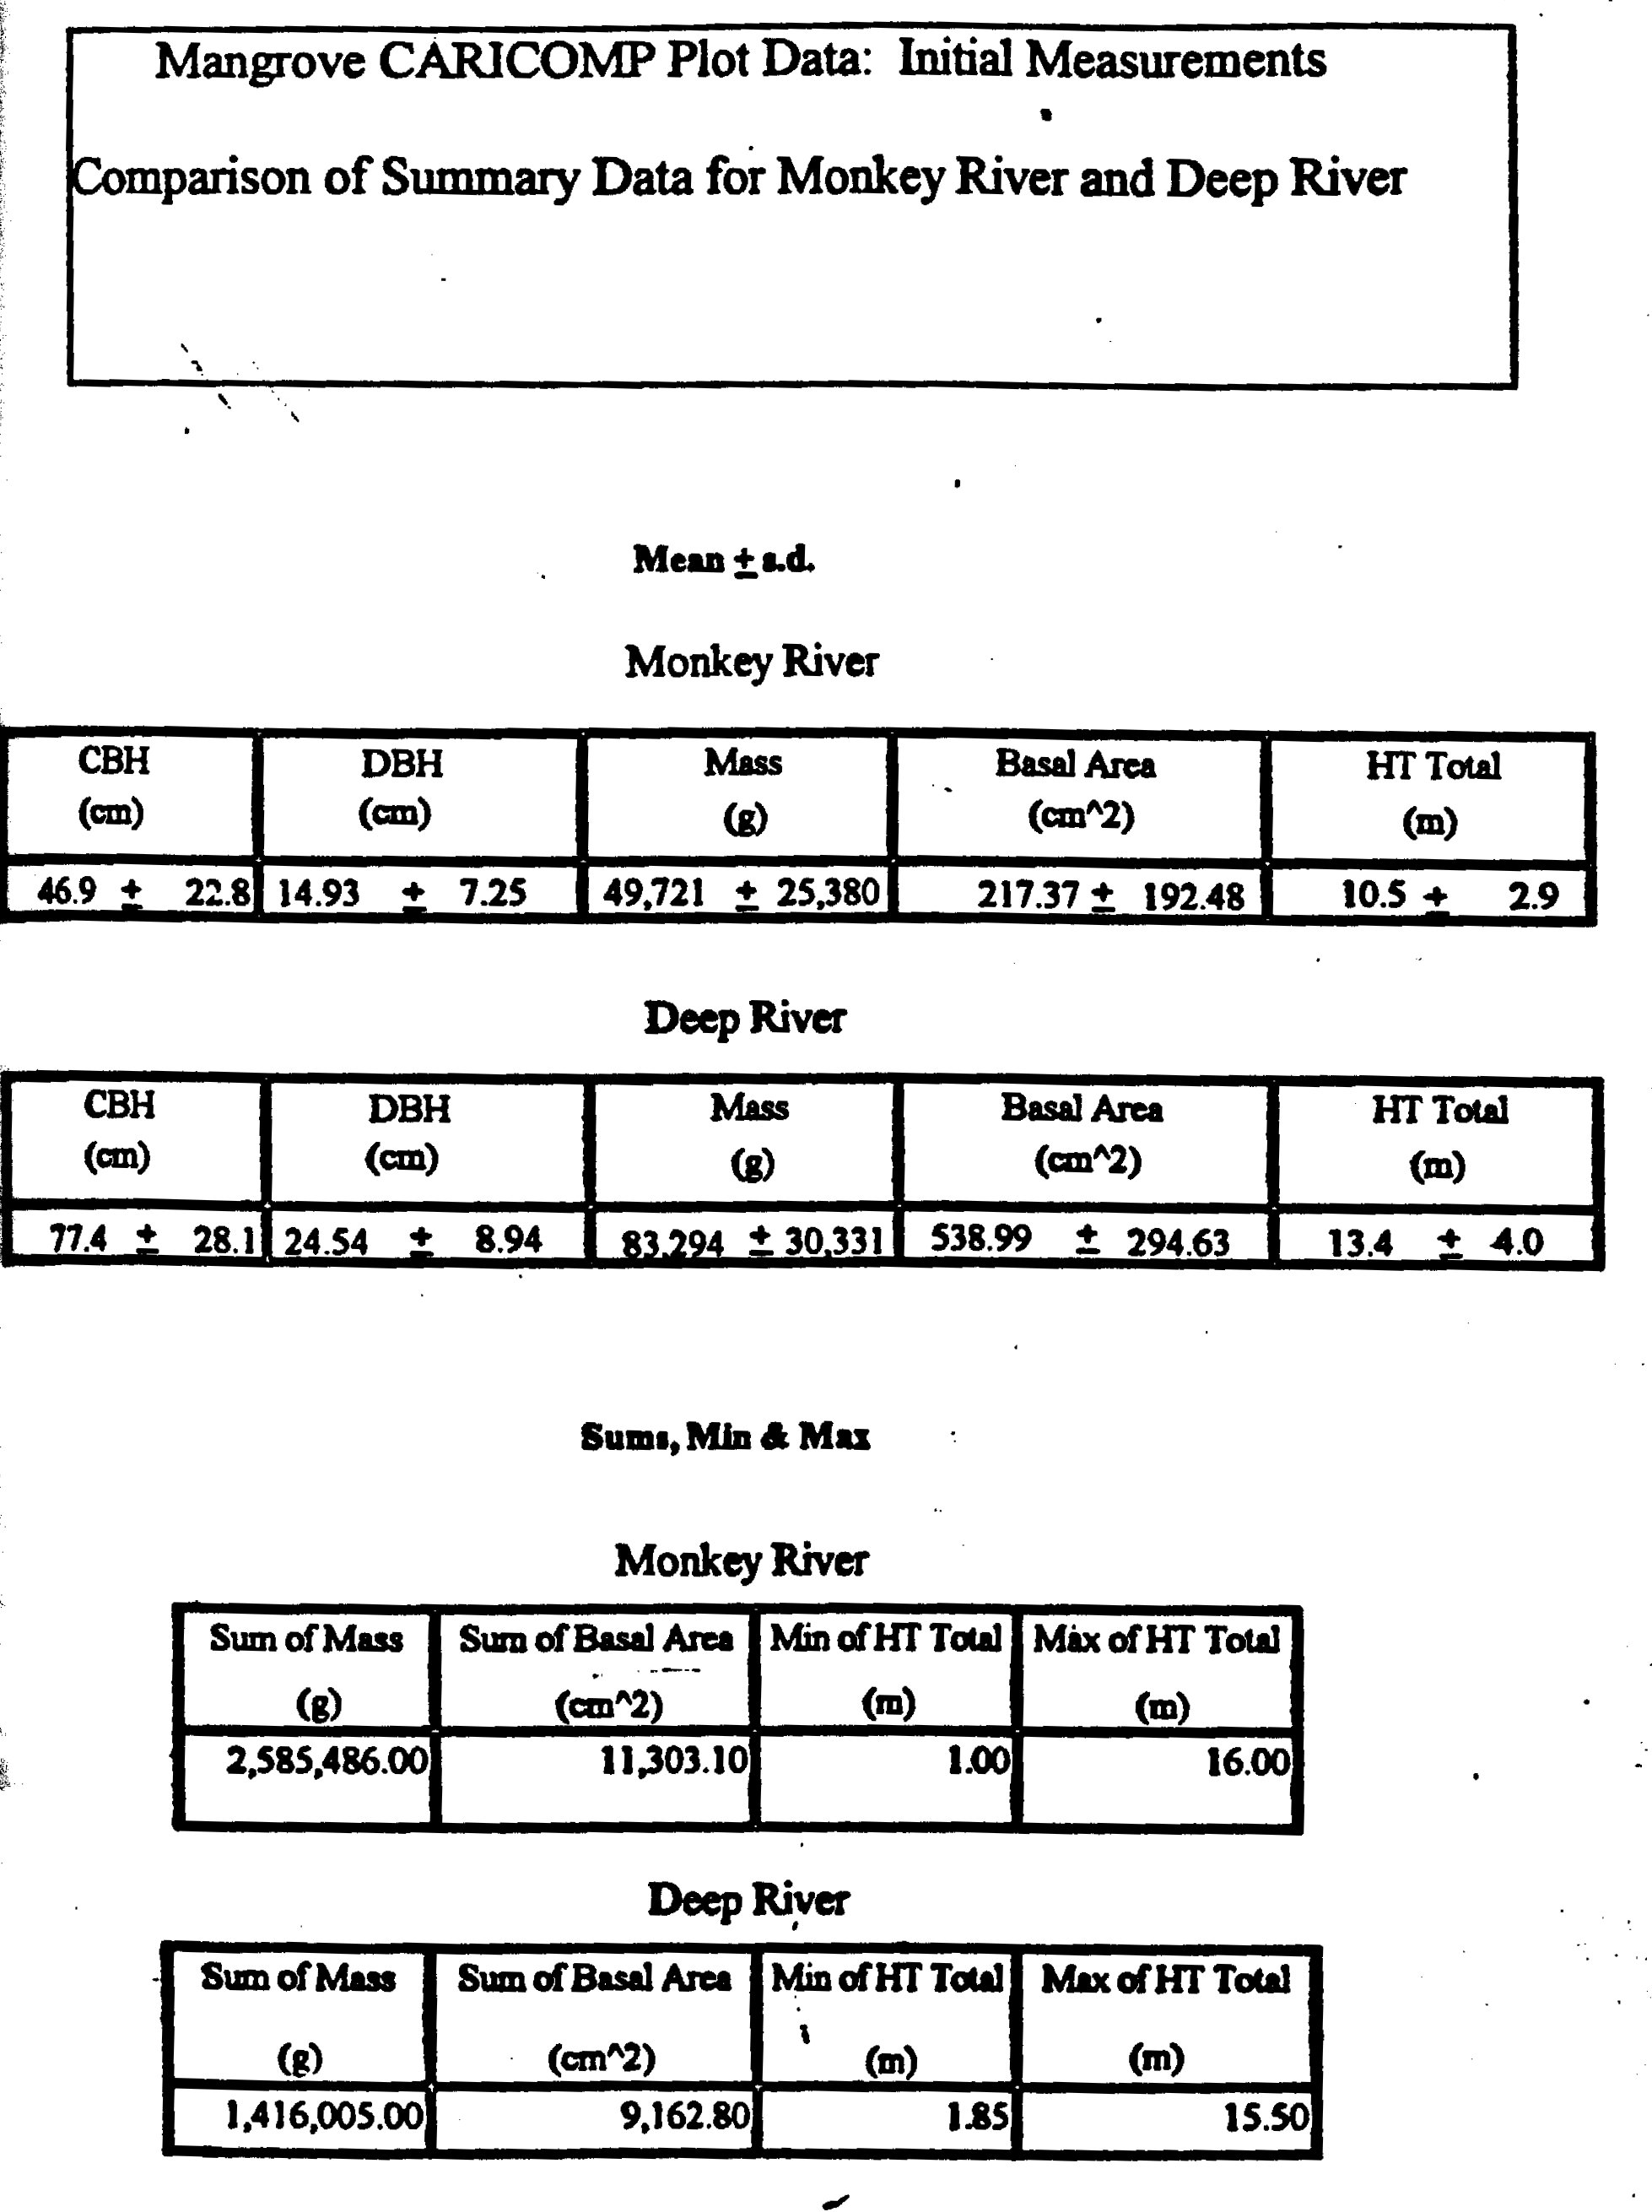
Plate 20 · original 1958×2621 px · line drawing
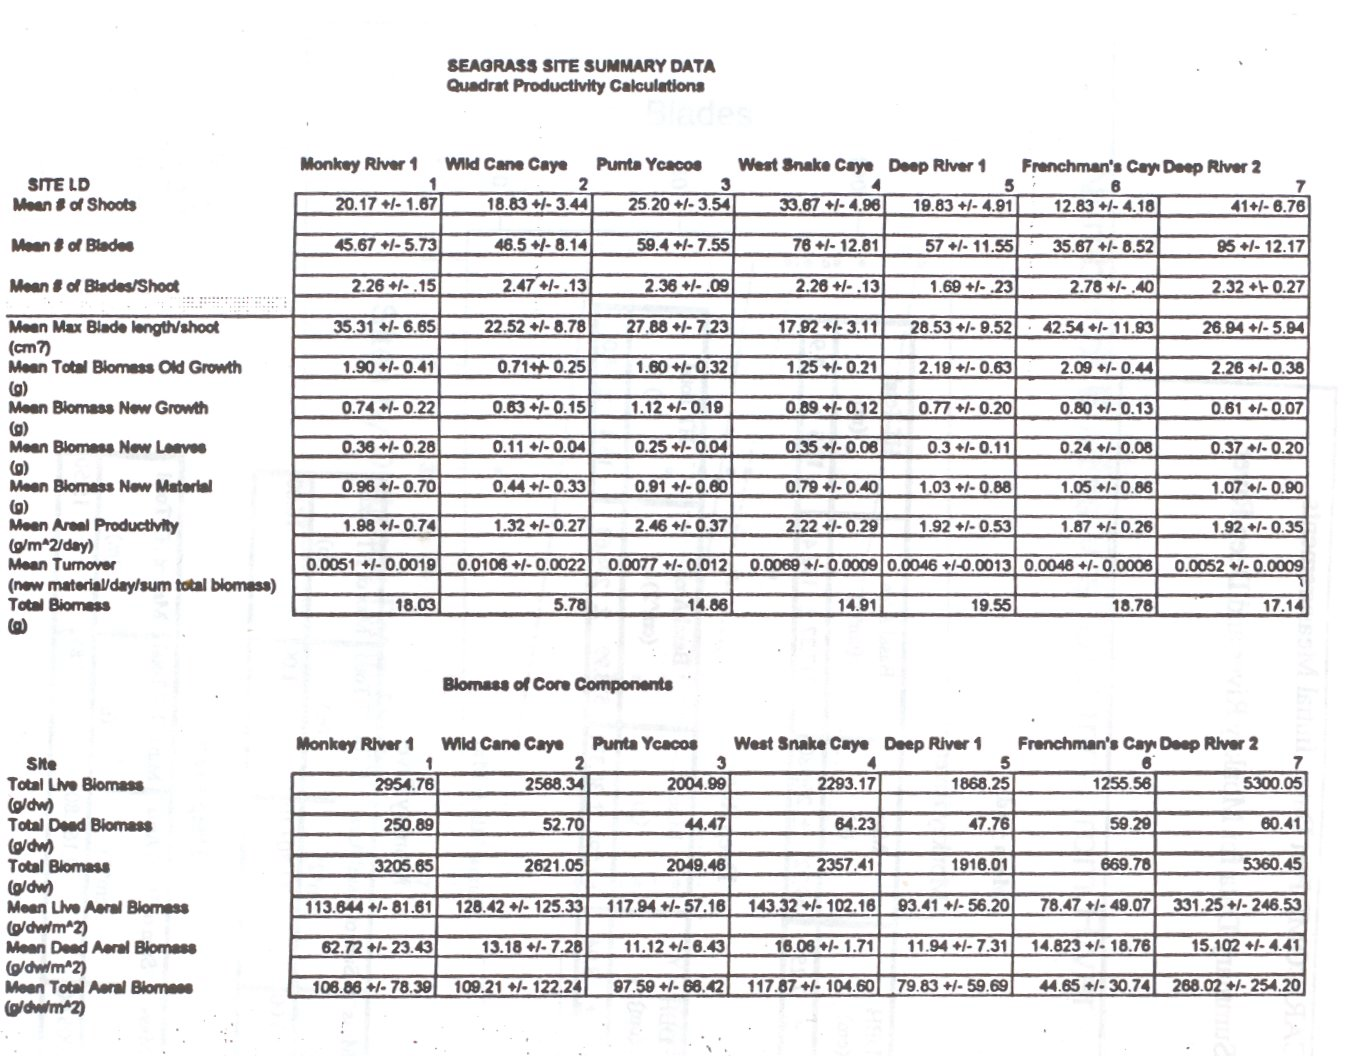
Plate 21 · original 1346×1056 px
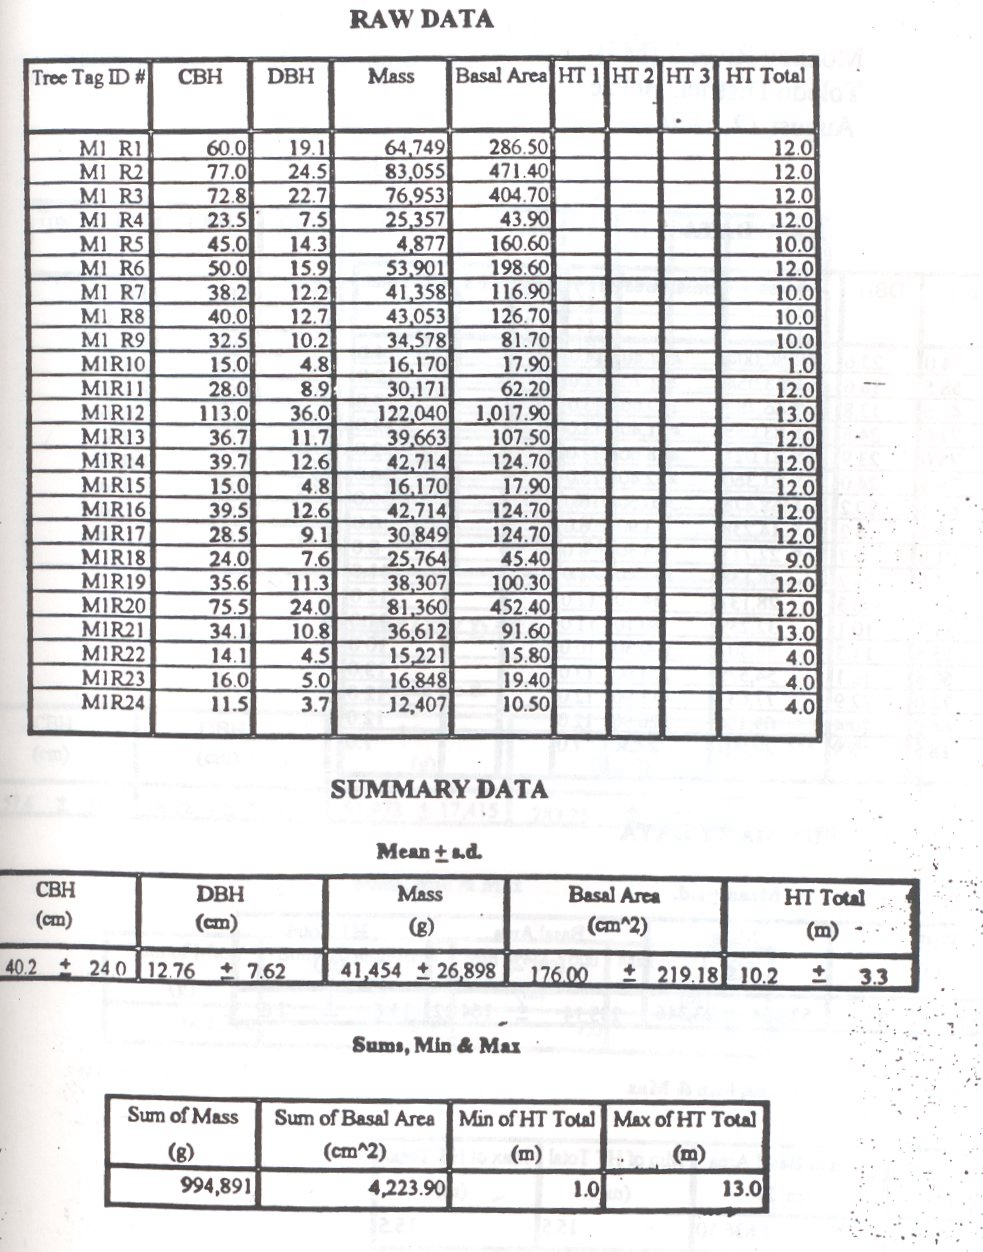
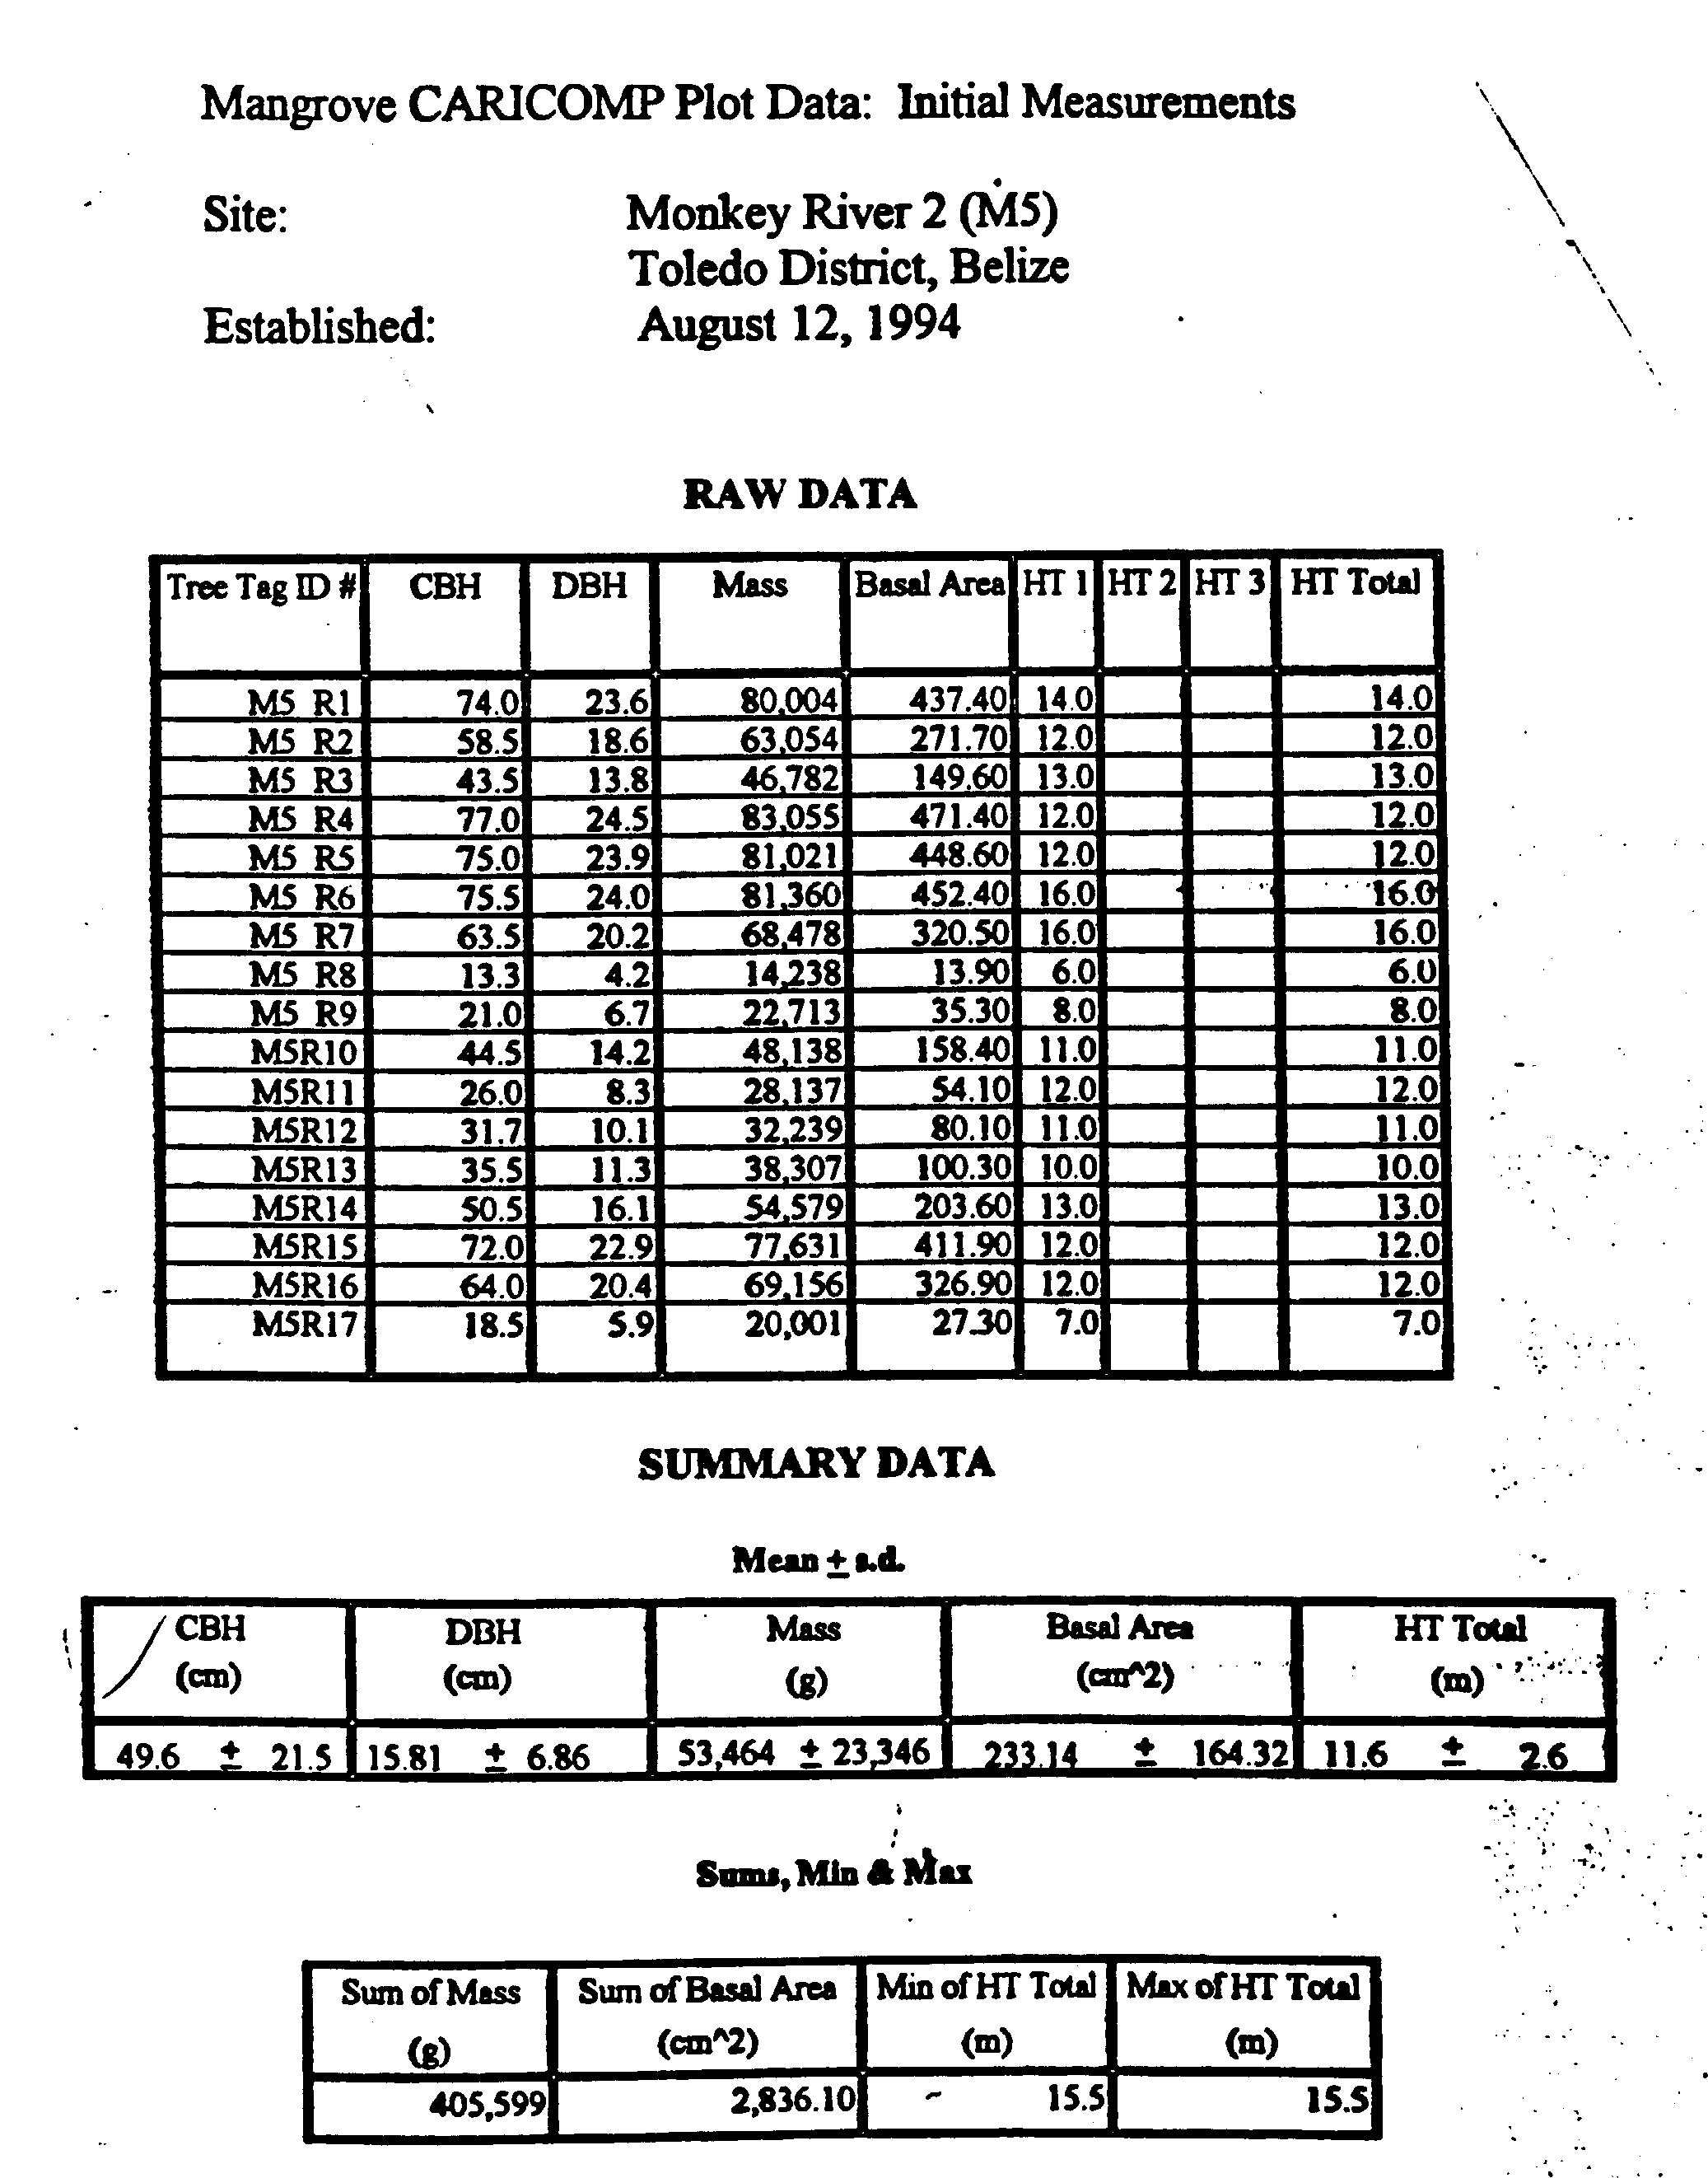
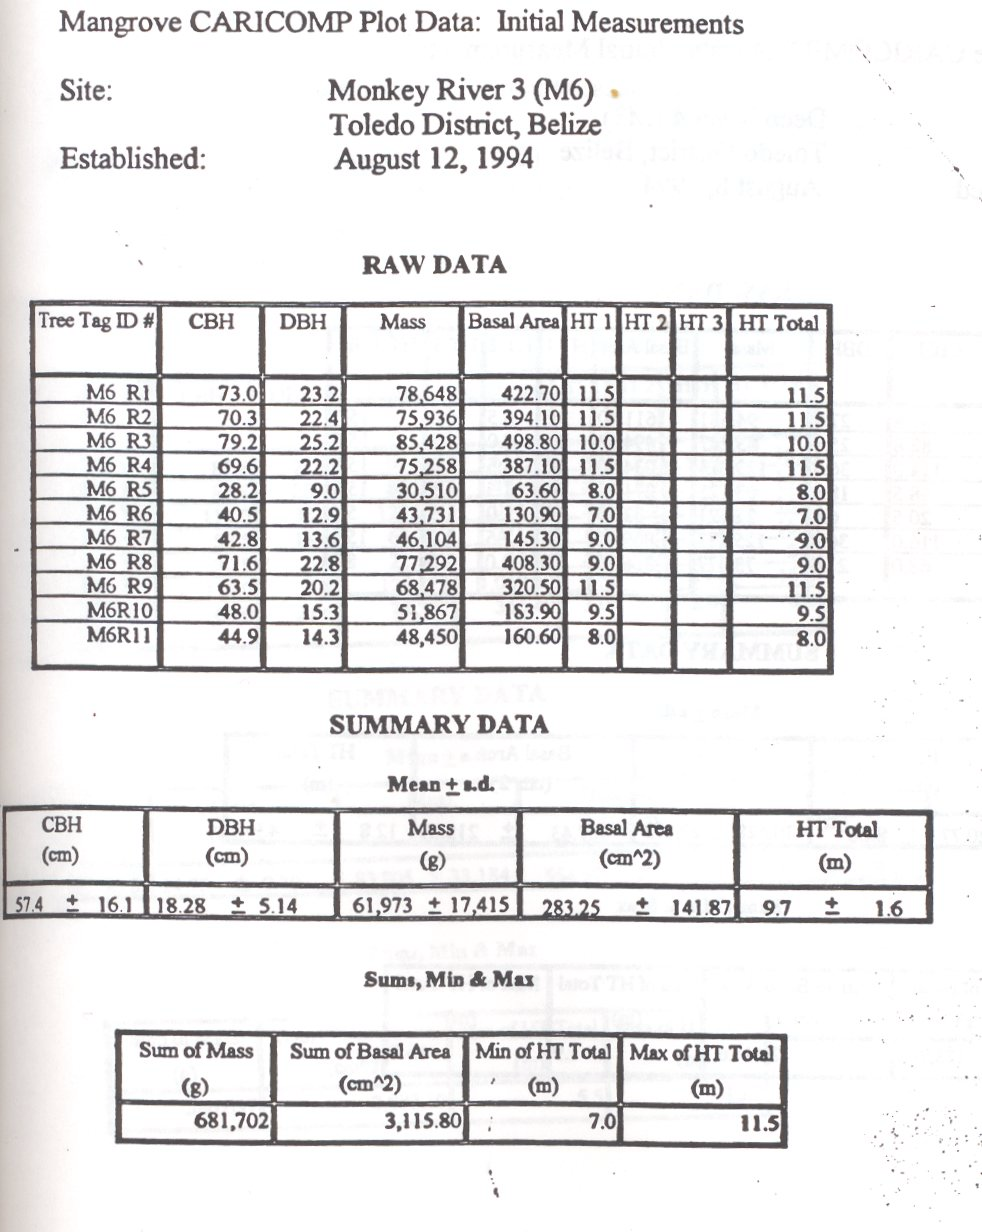
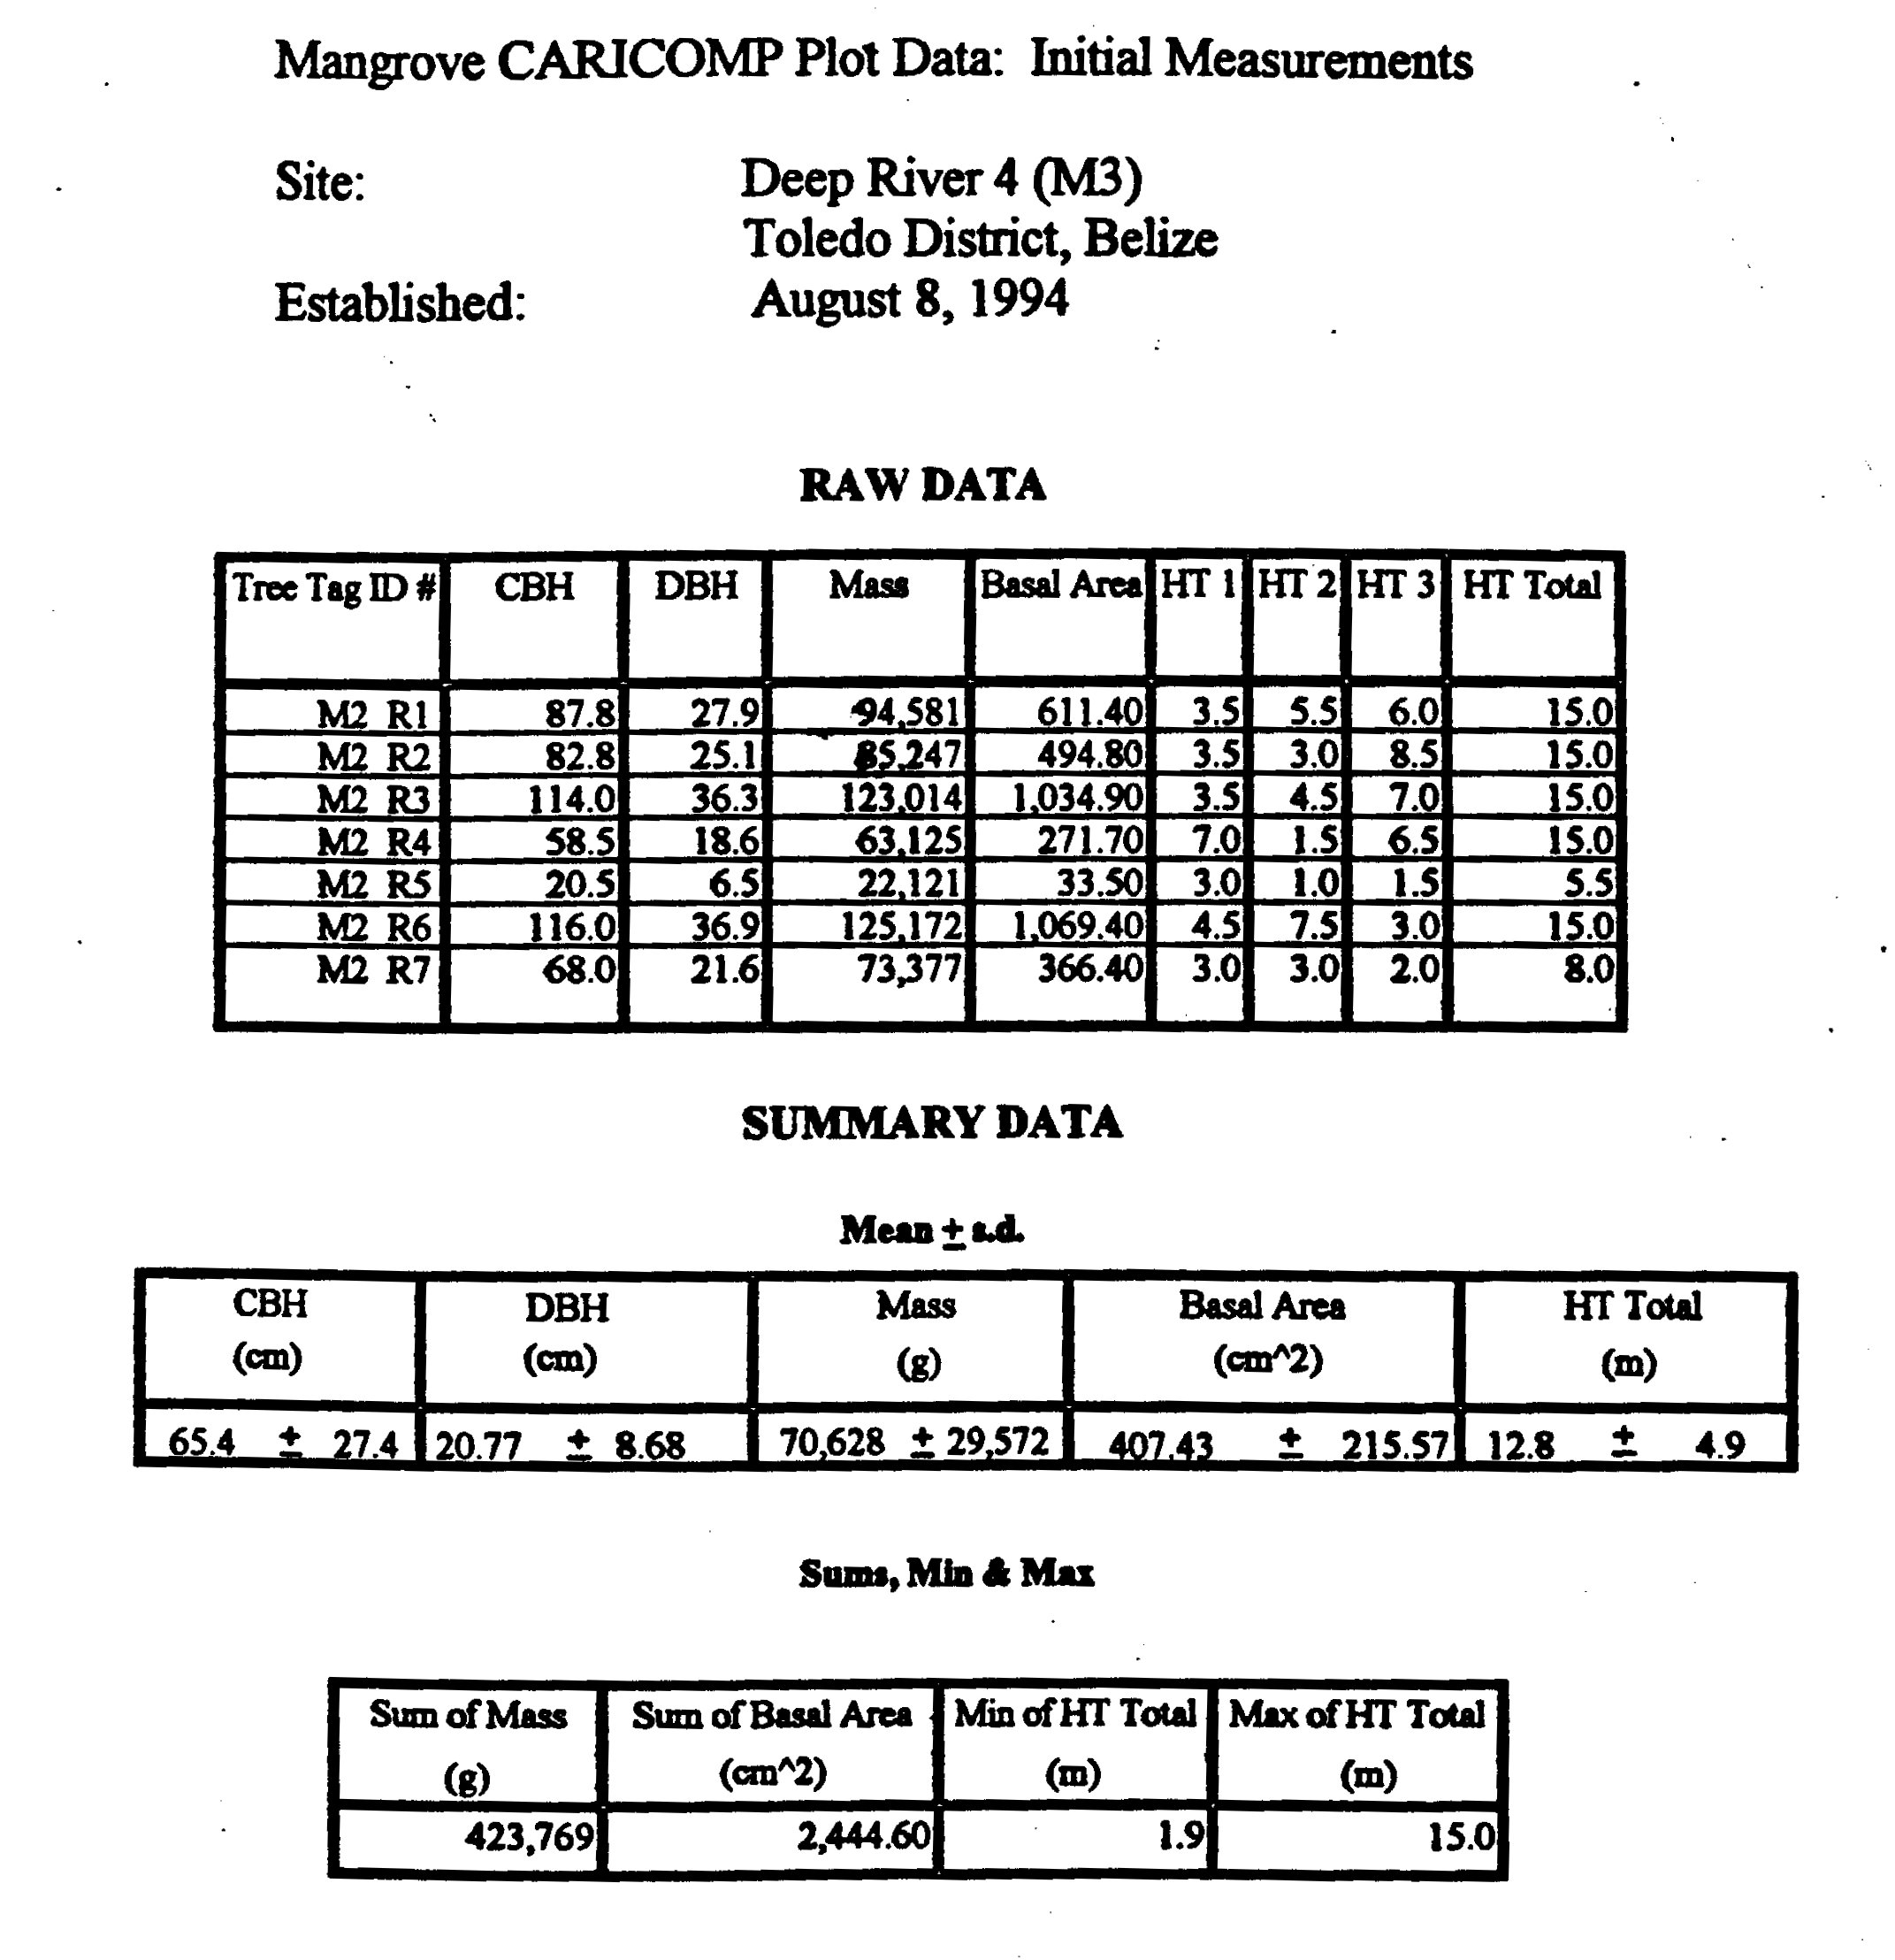
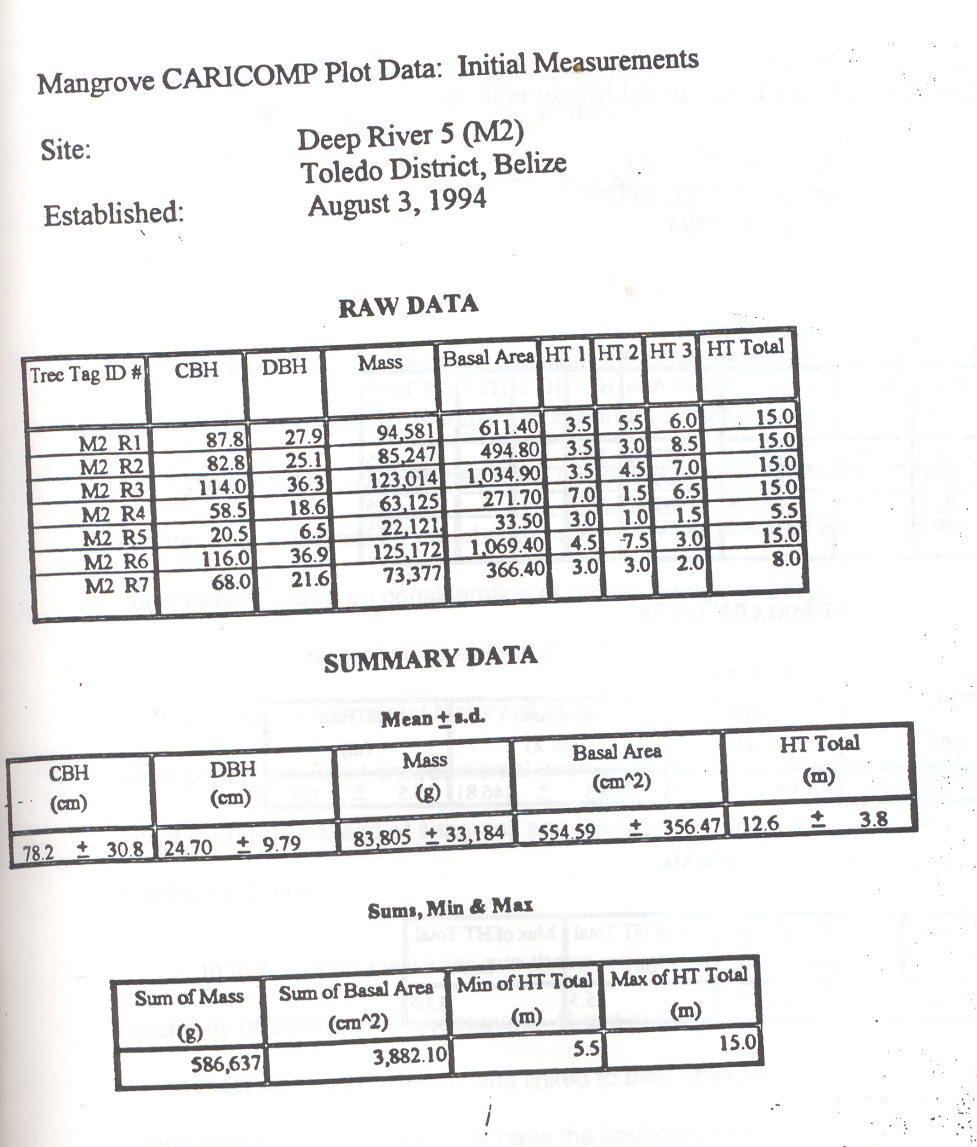
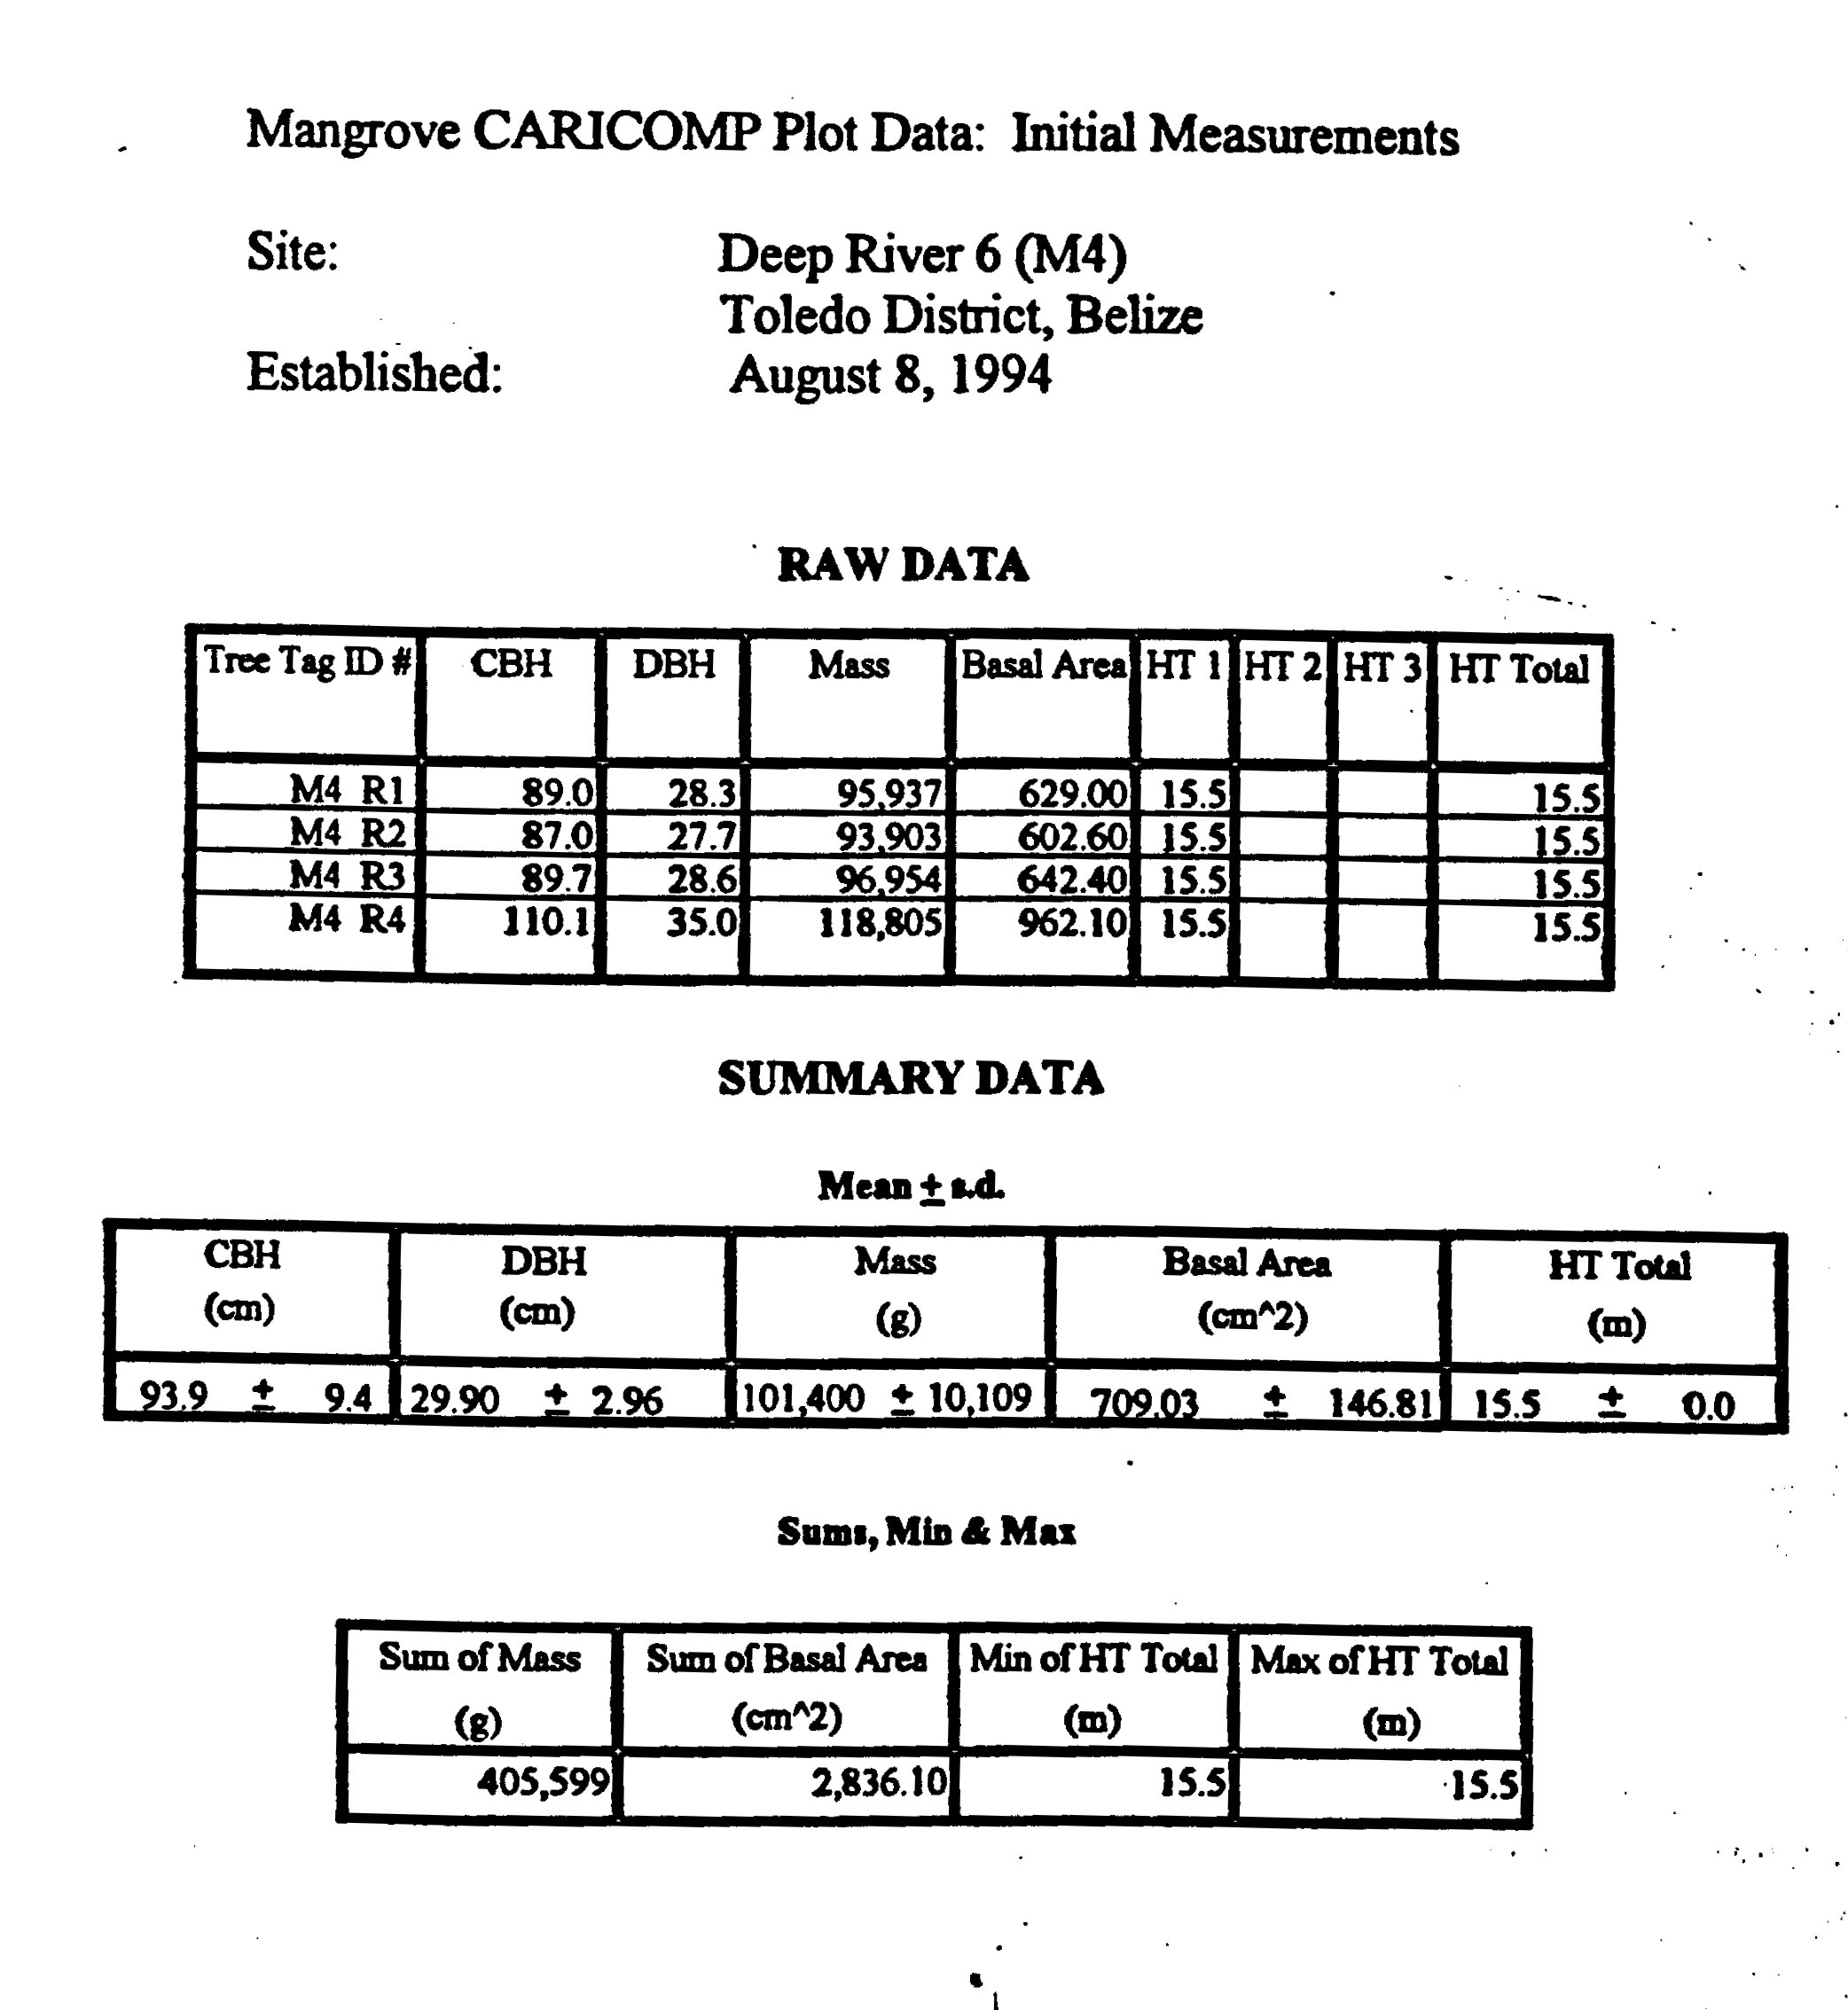
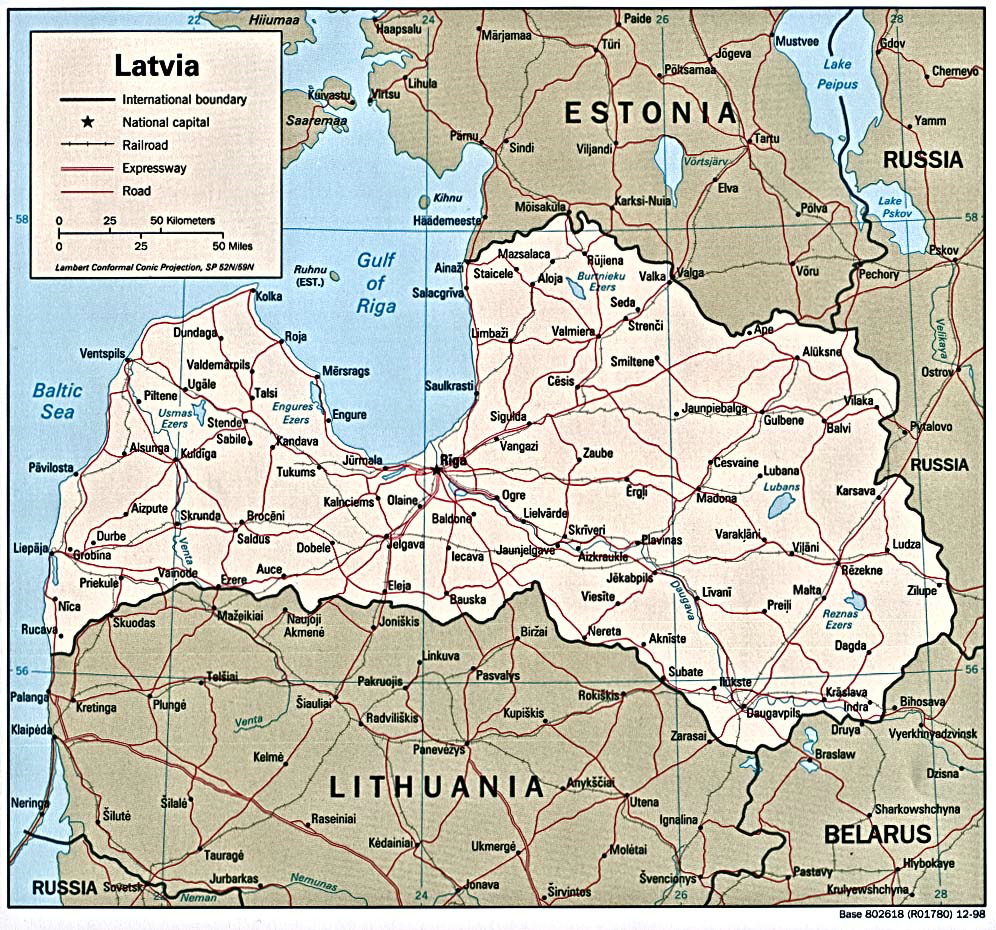
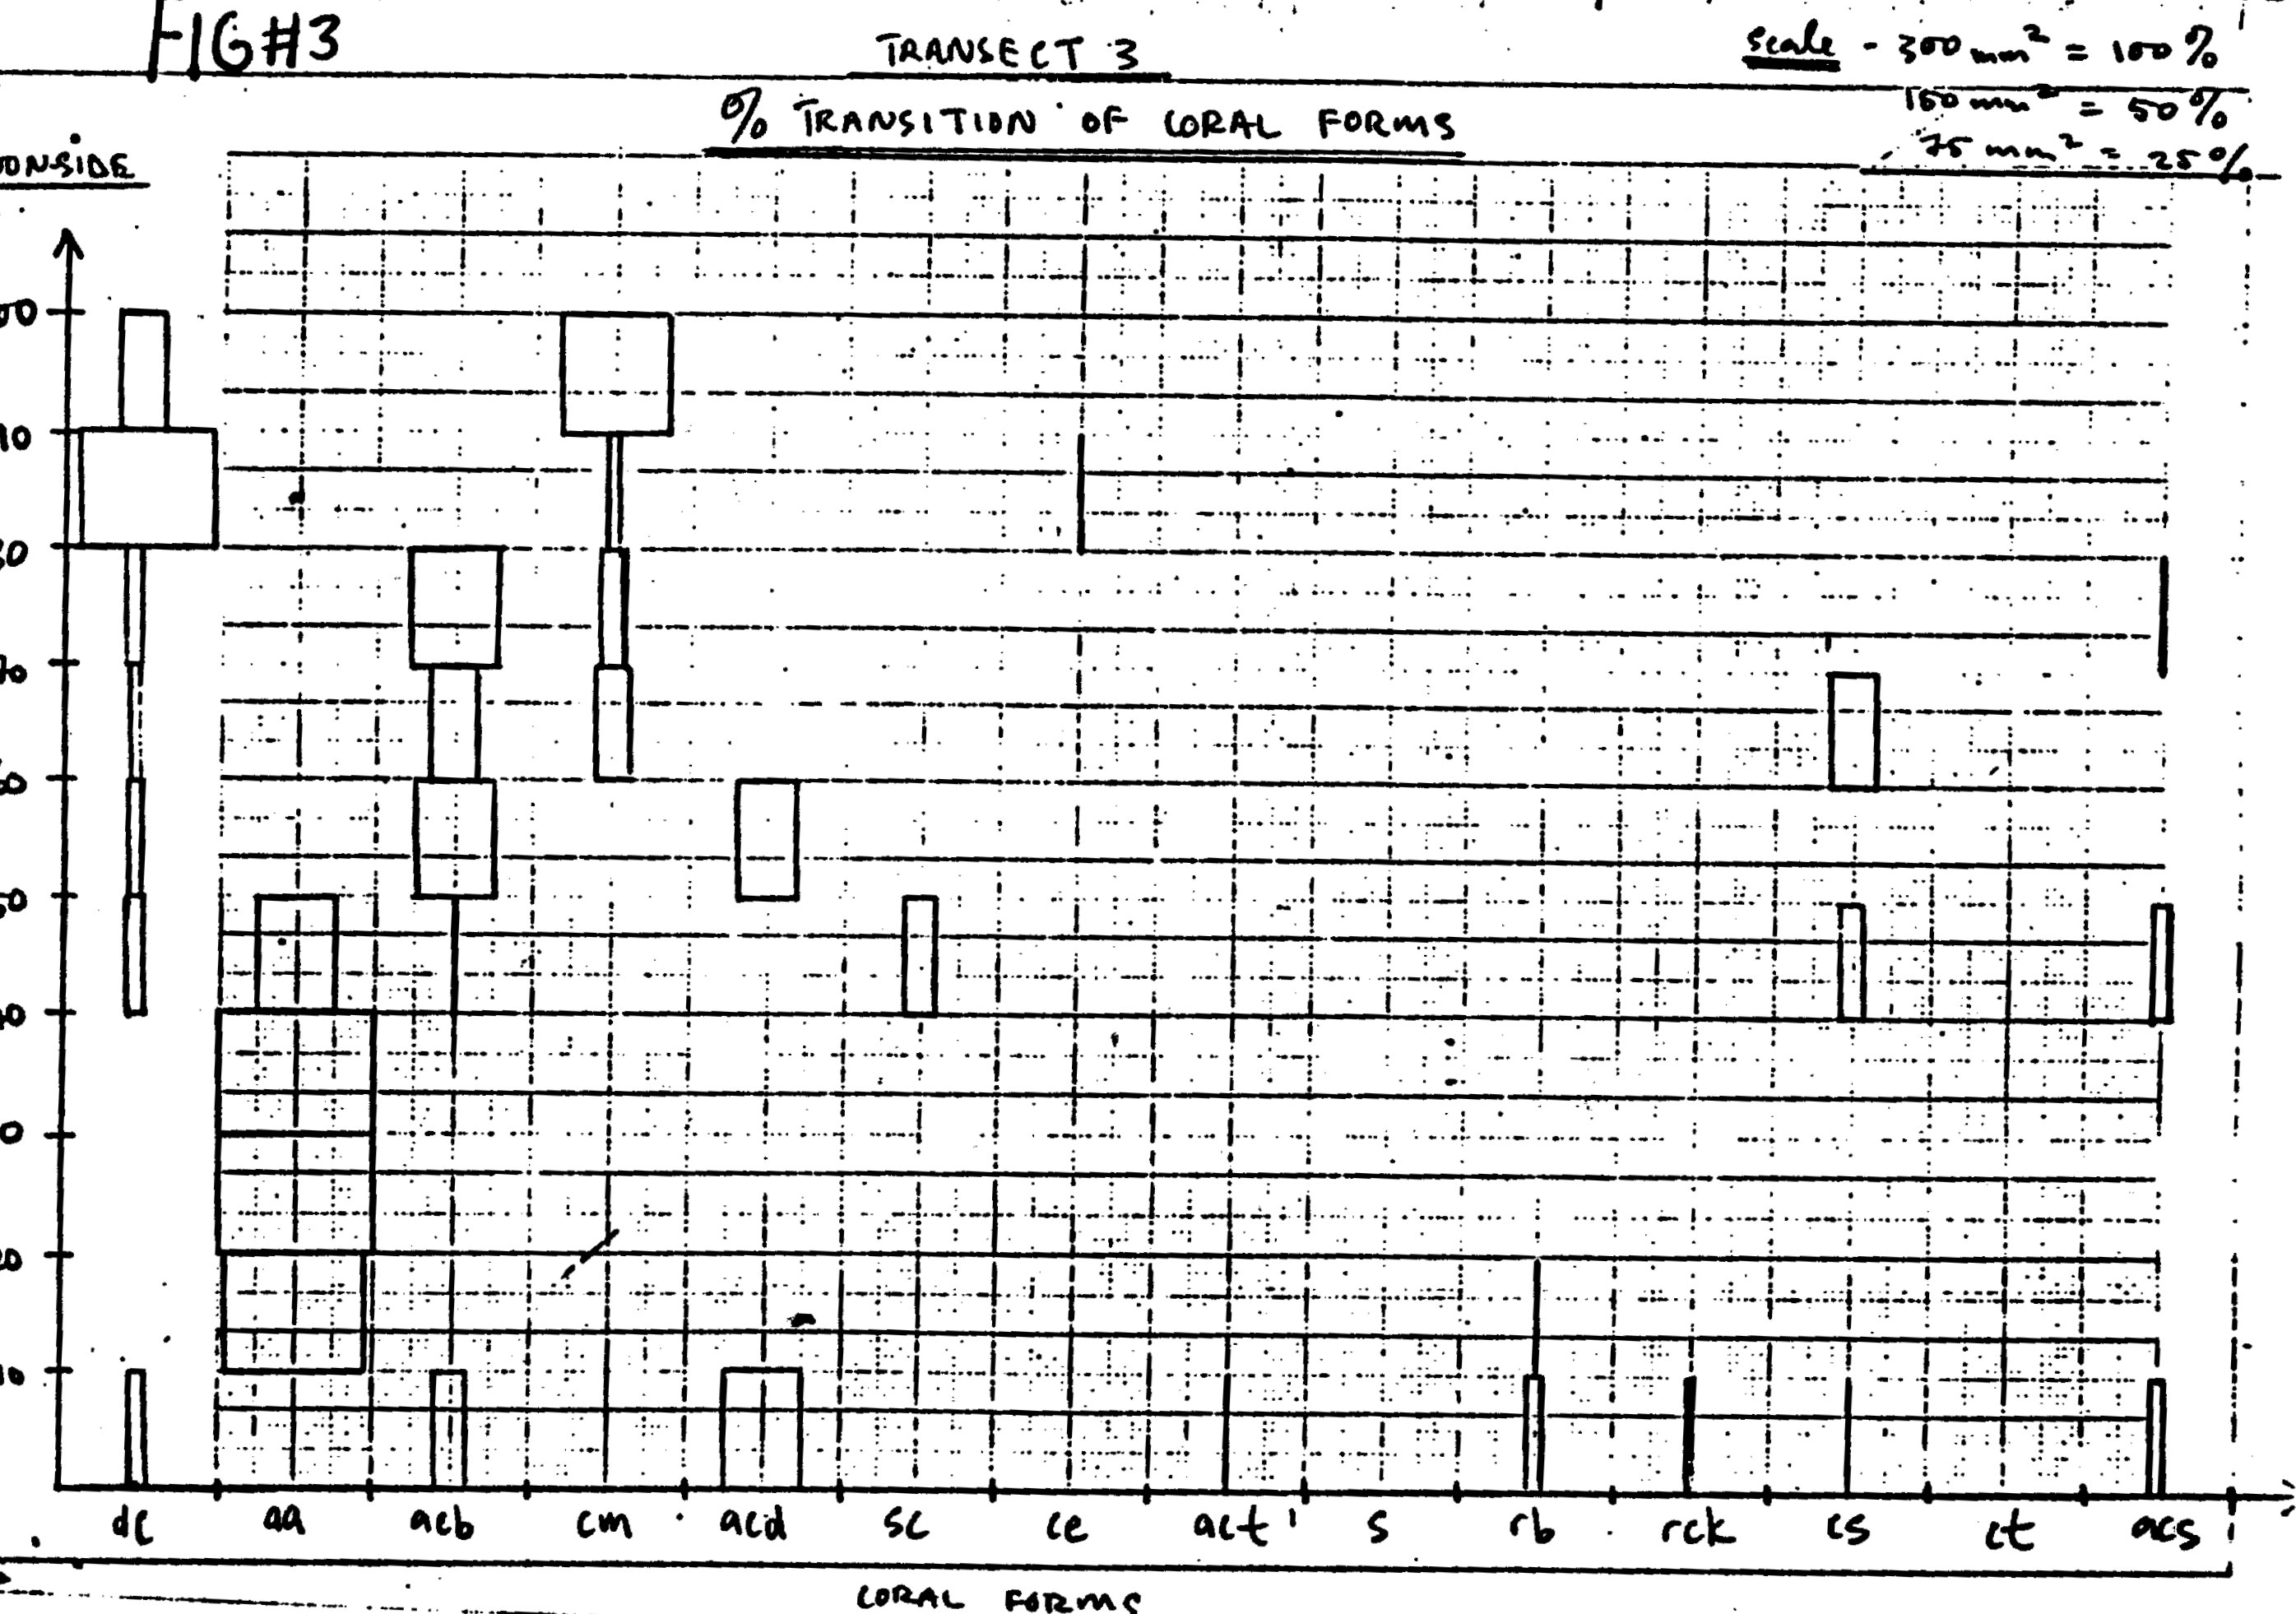
Plate 29 · original 2791×1962 px · line drawing
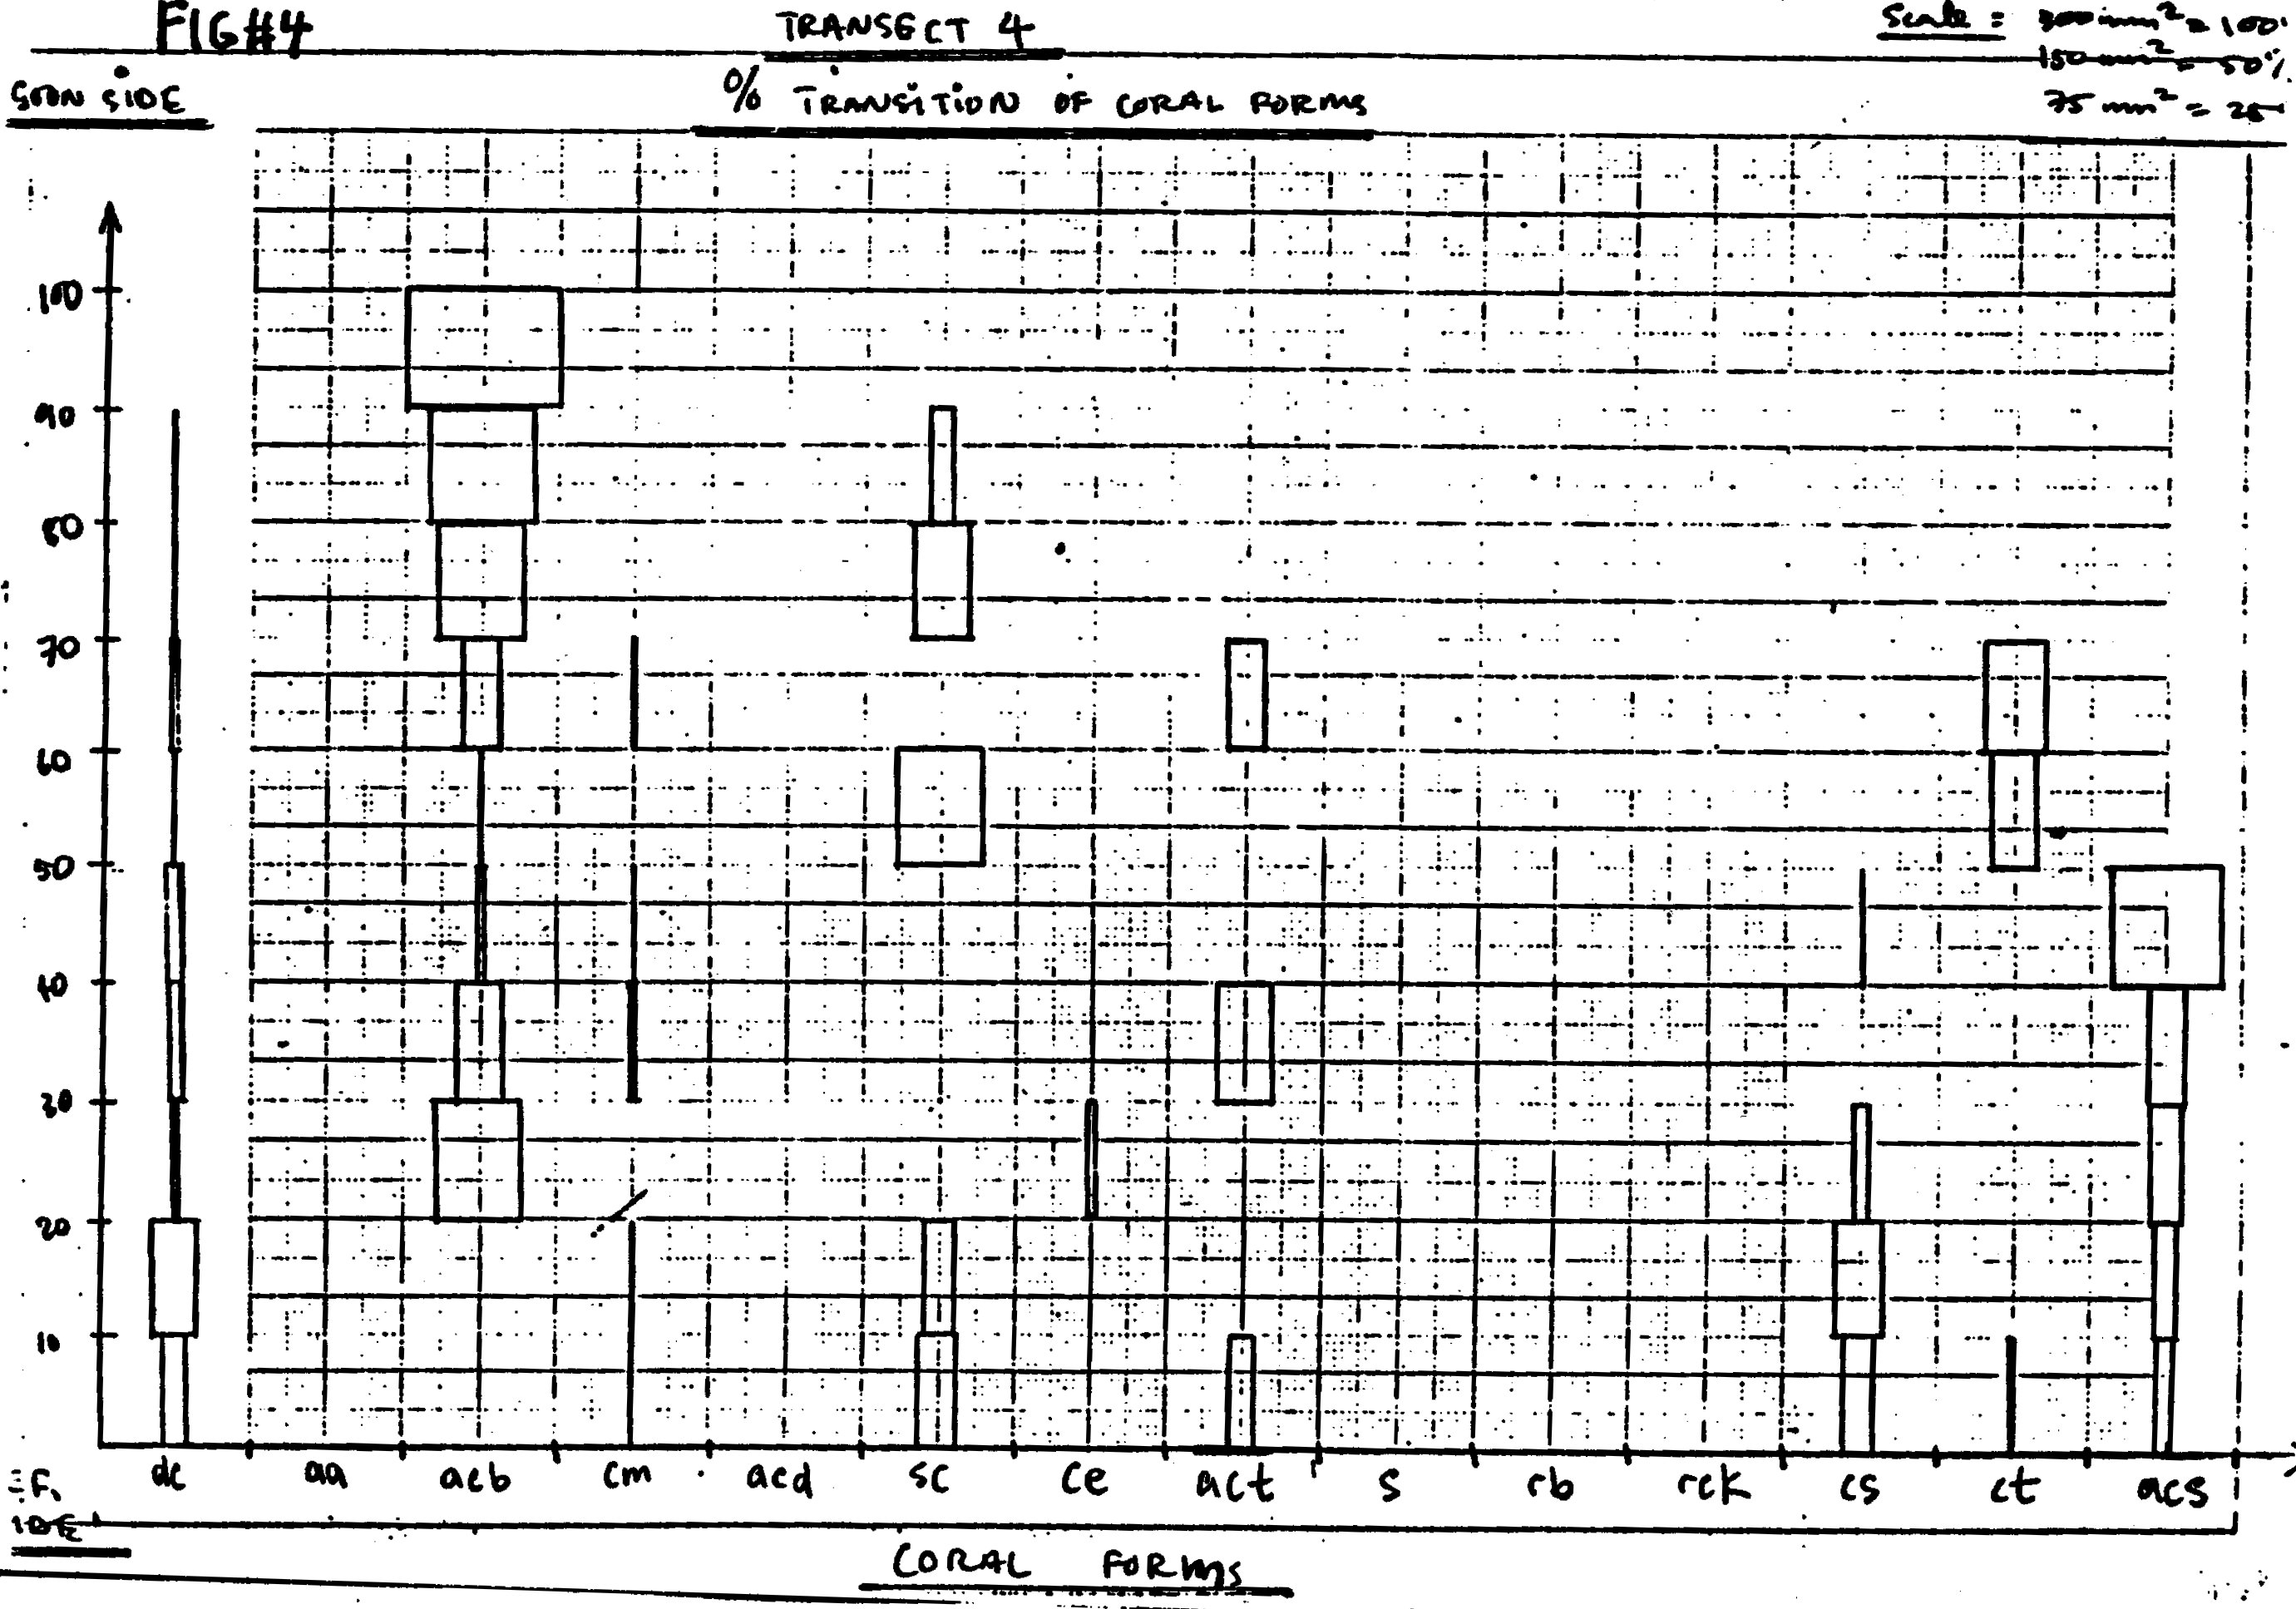
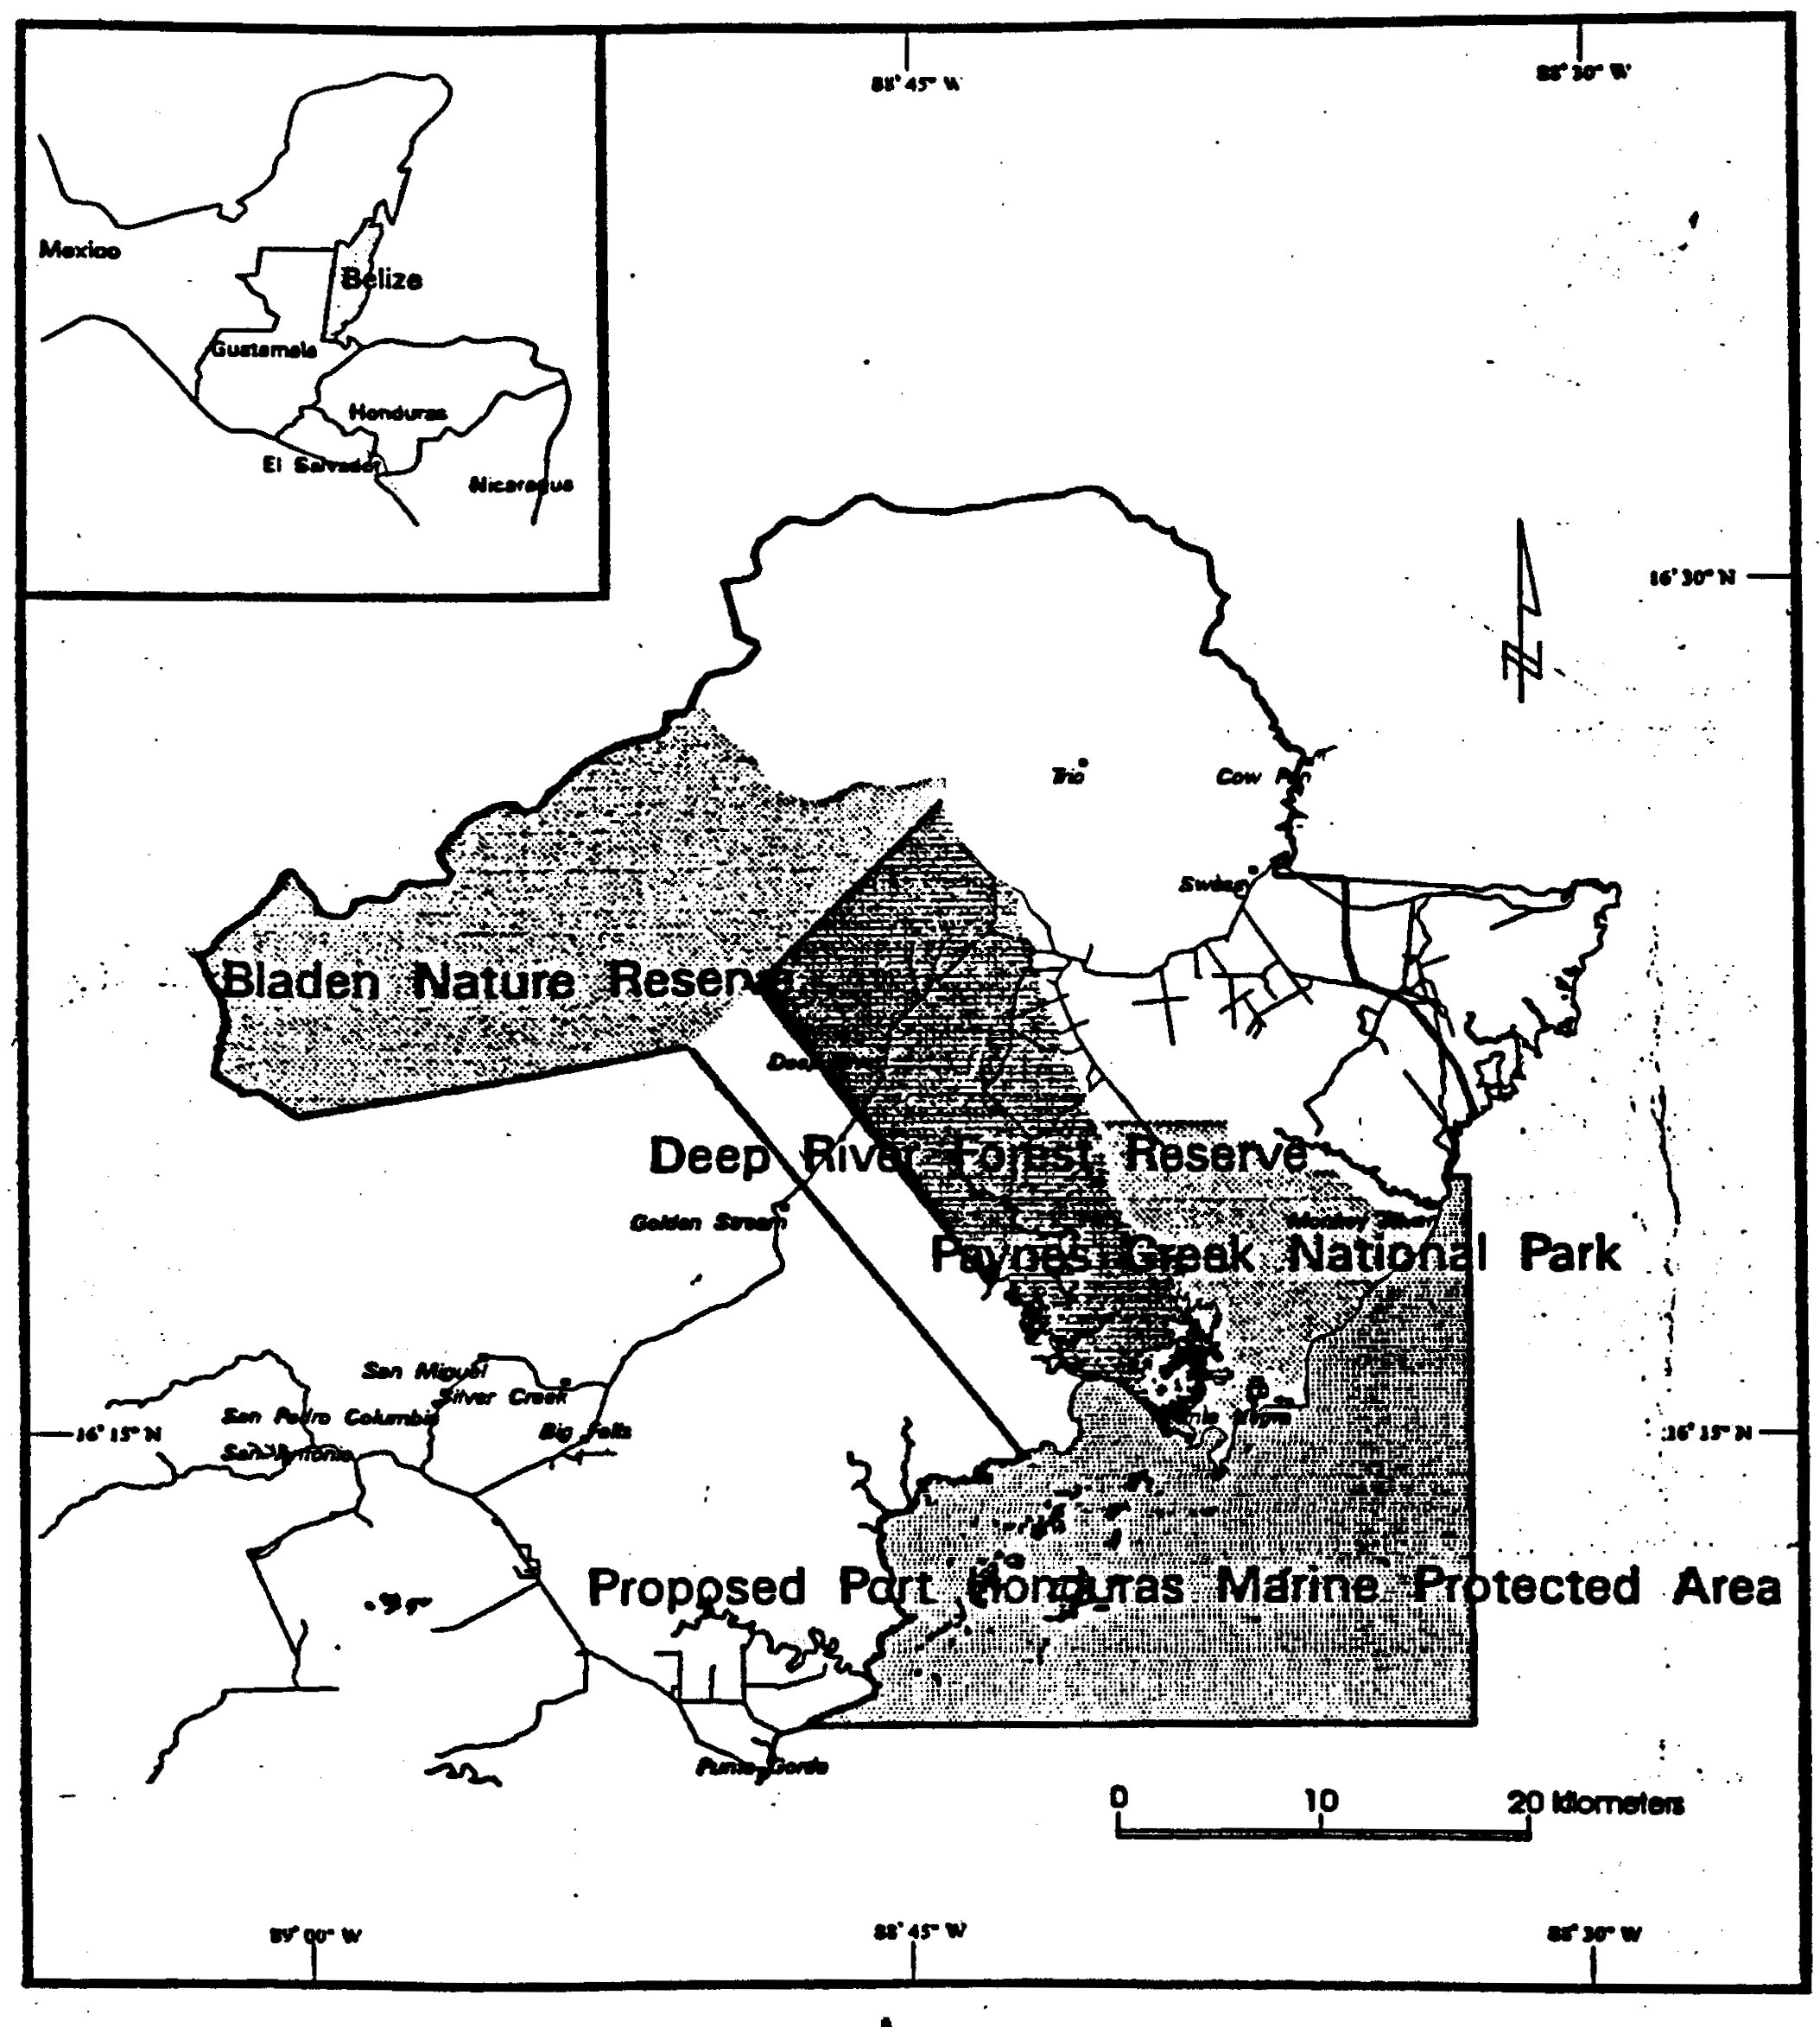
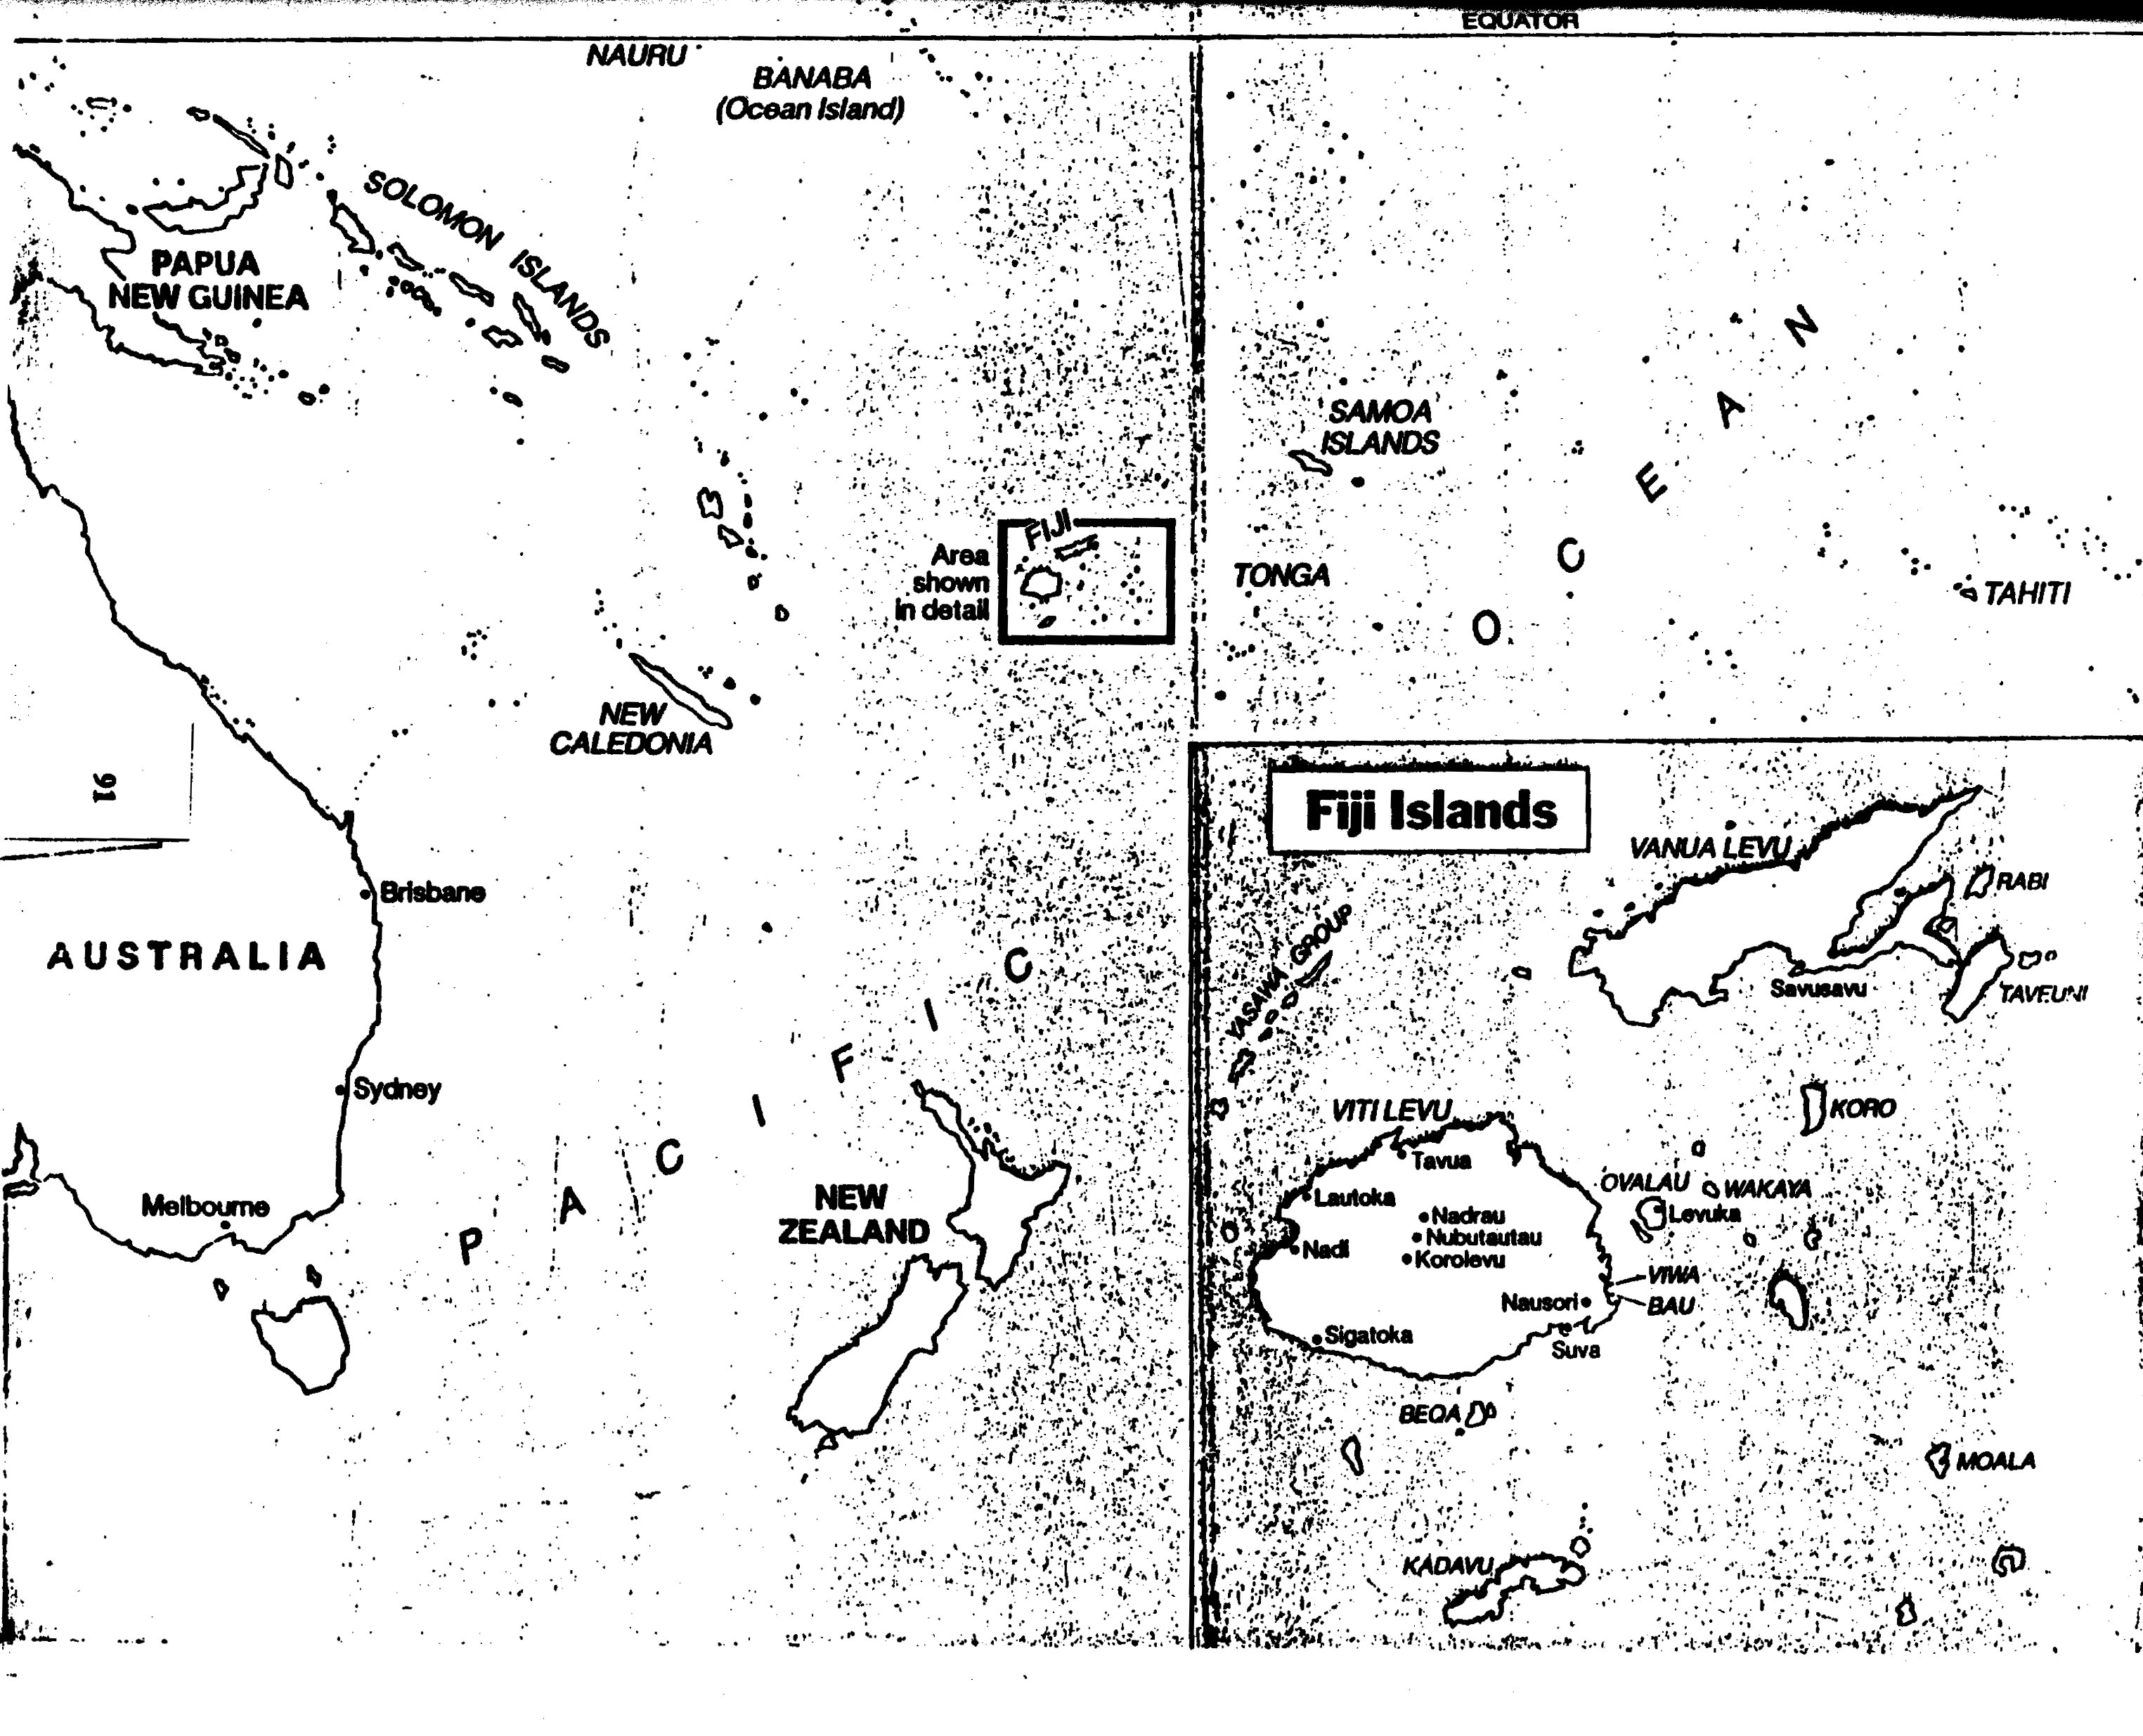
Plate 32 · original 3049×2470 px · line drawing
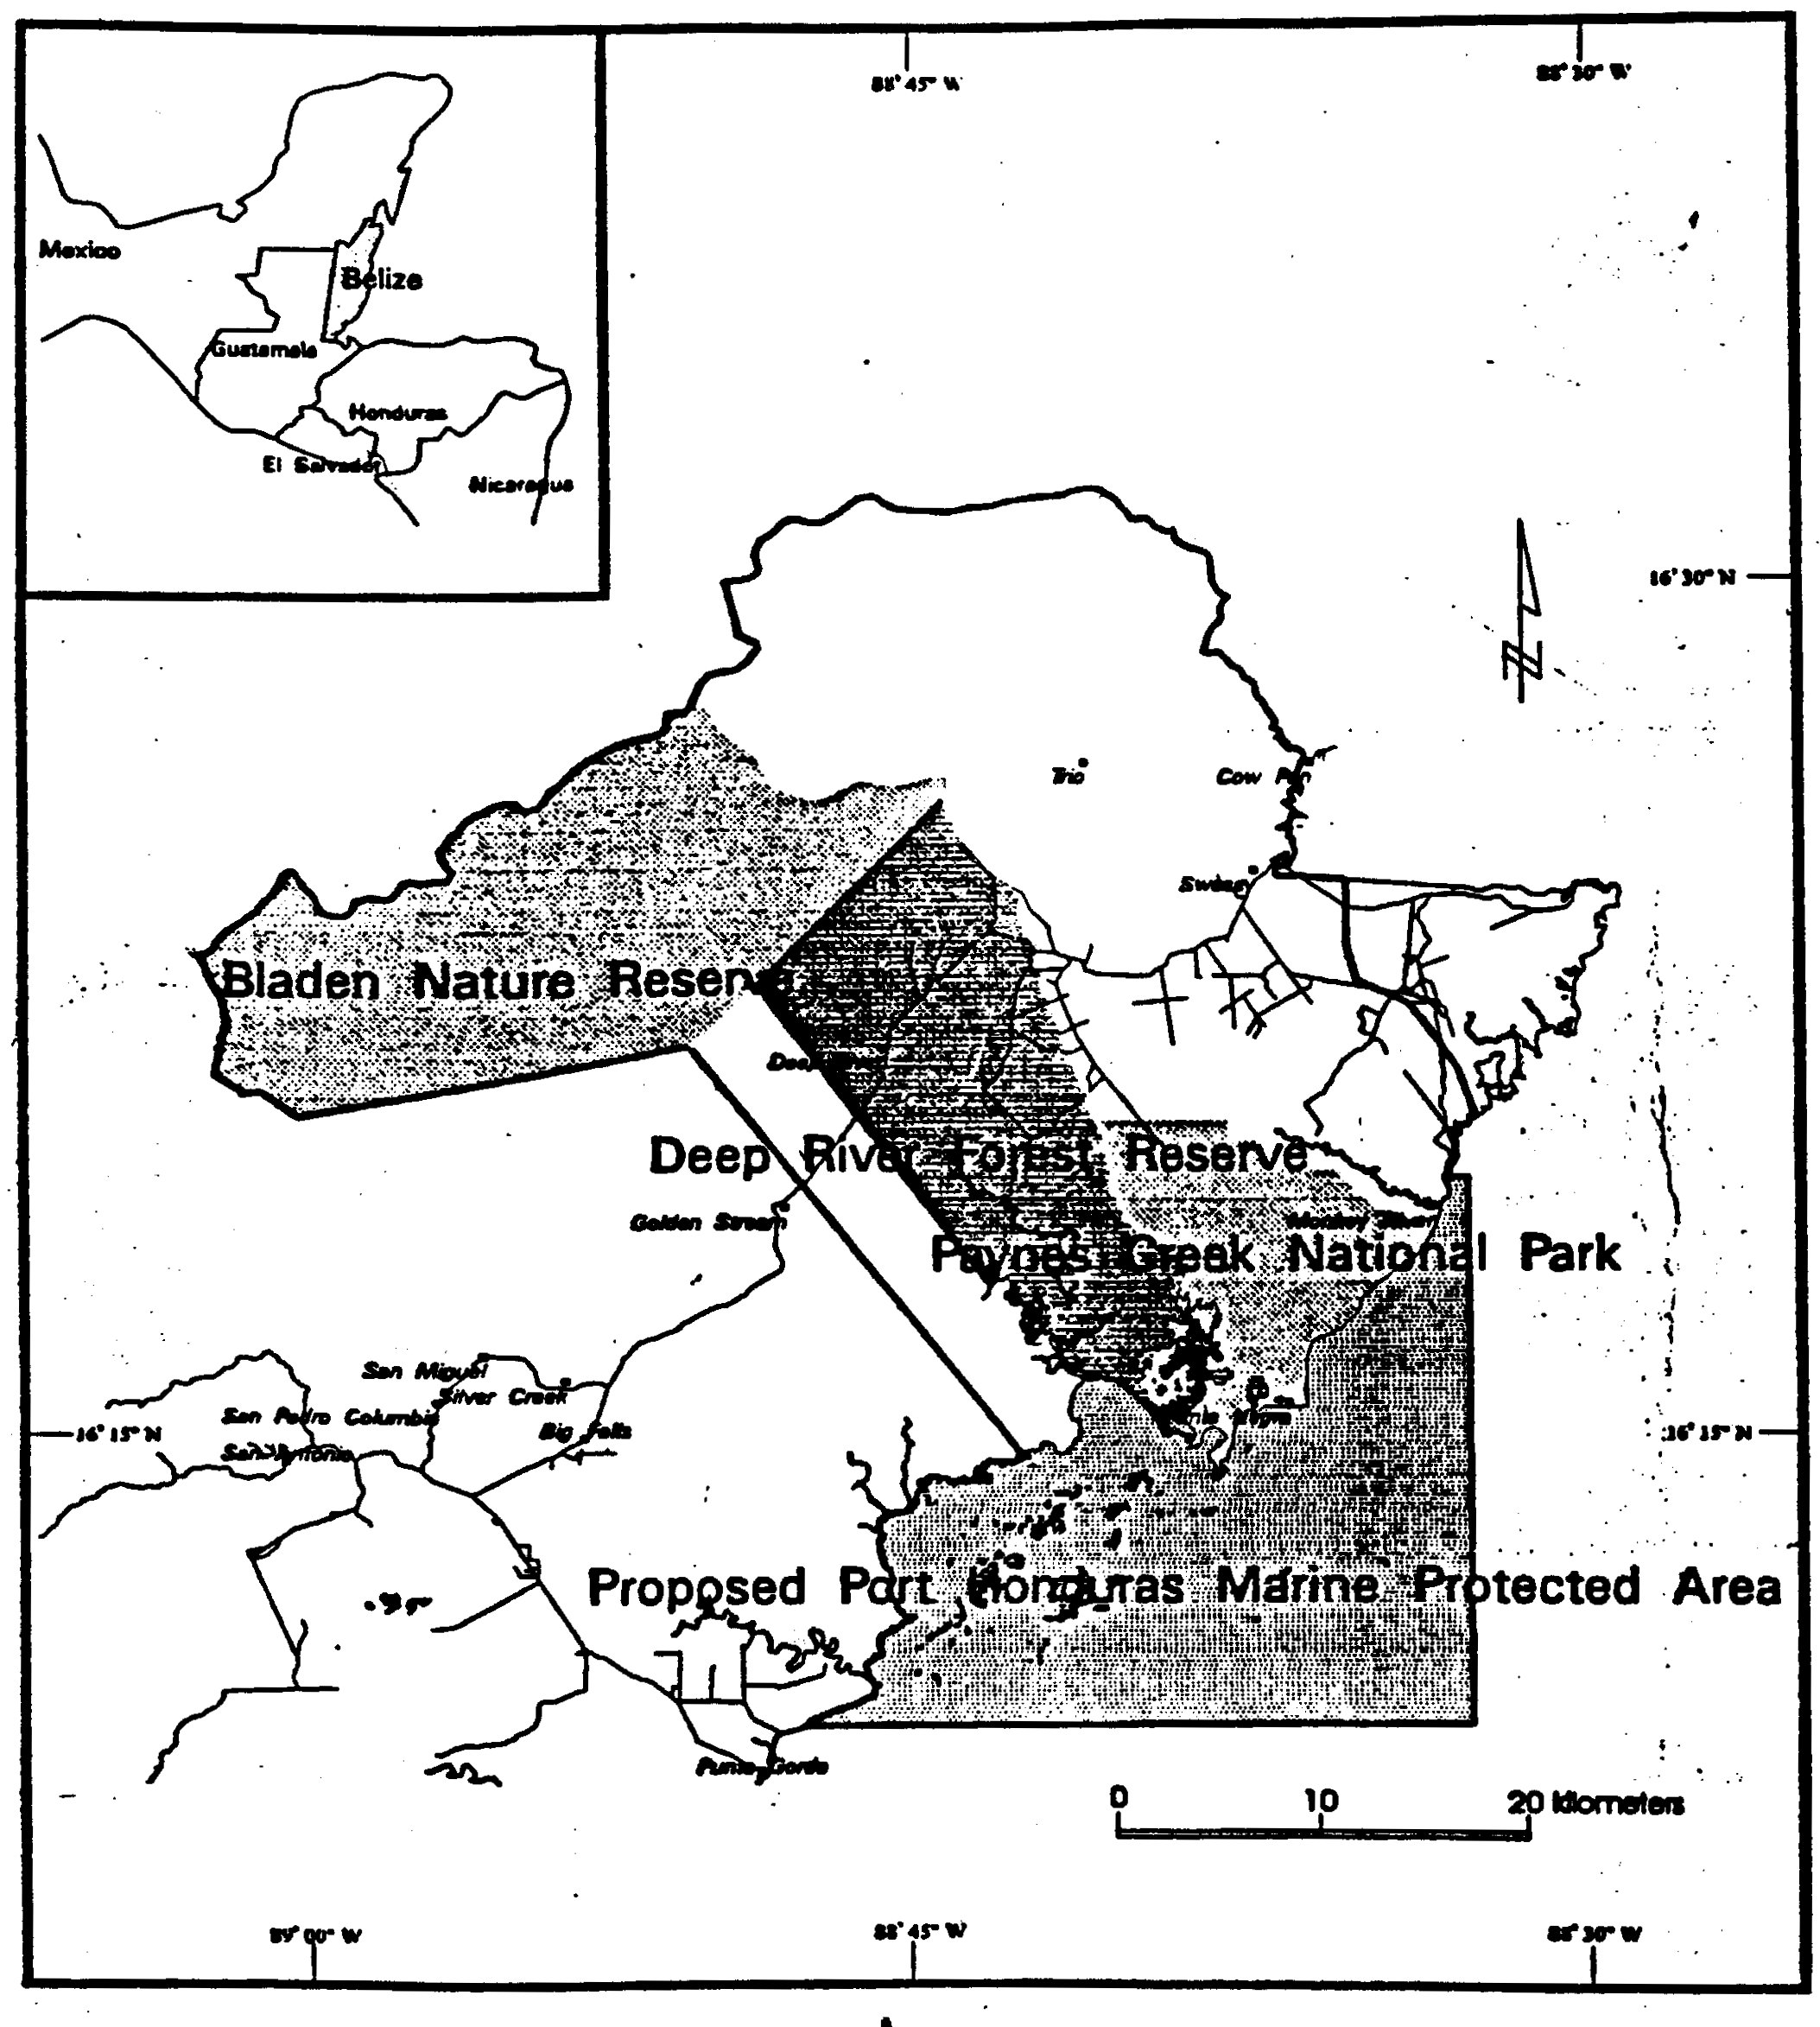
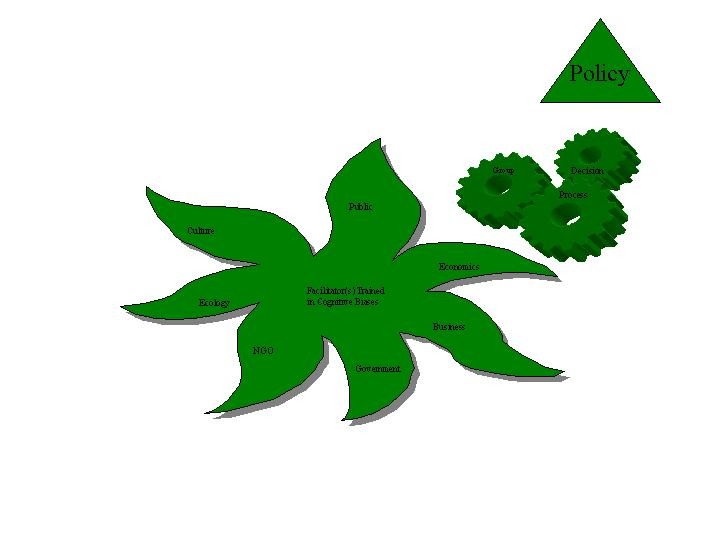
Plate 34 · original 720×540 px
The charts, redrawn from their own instructions
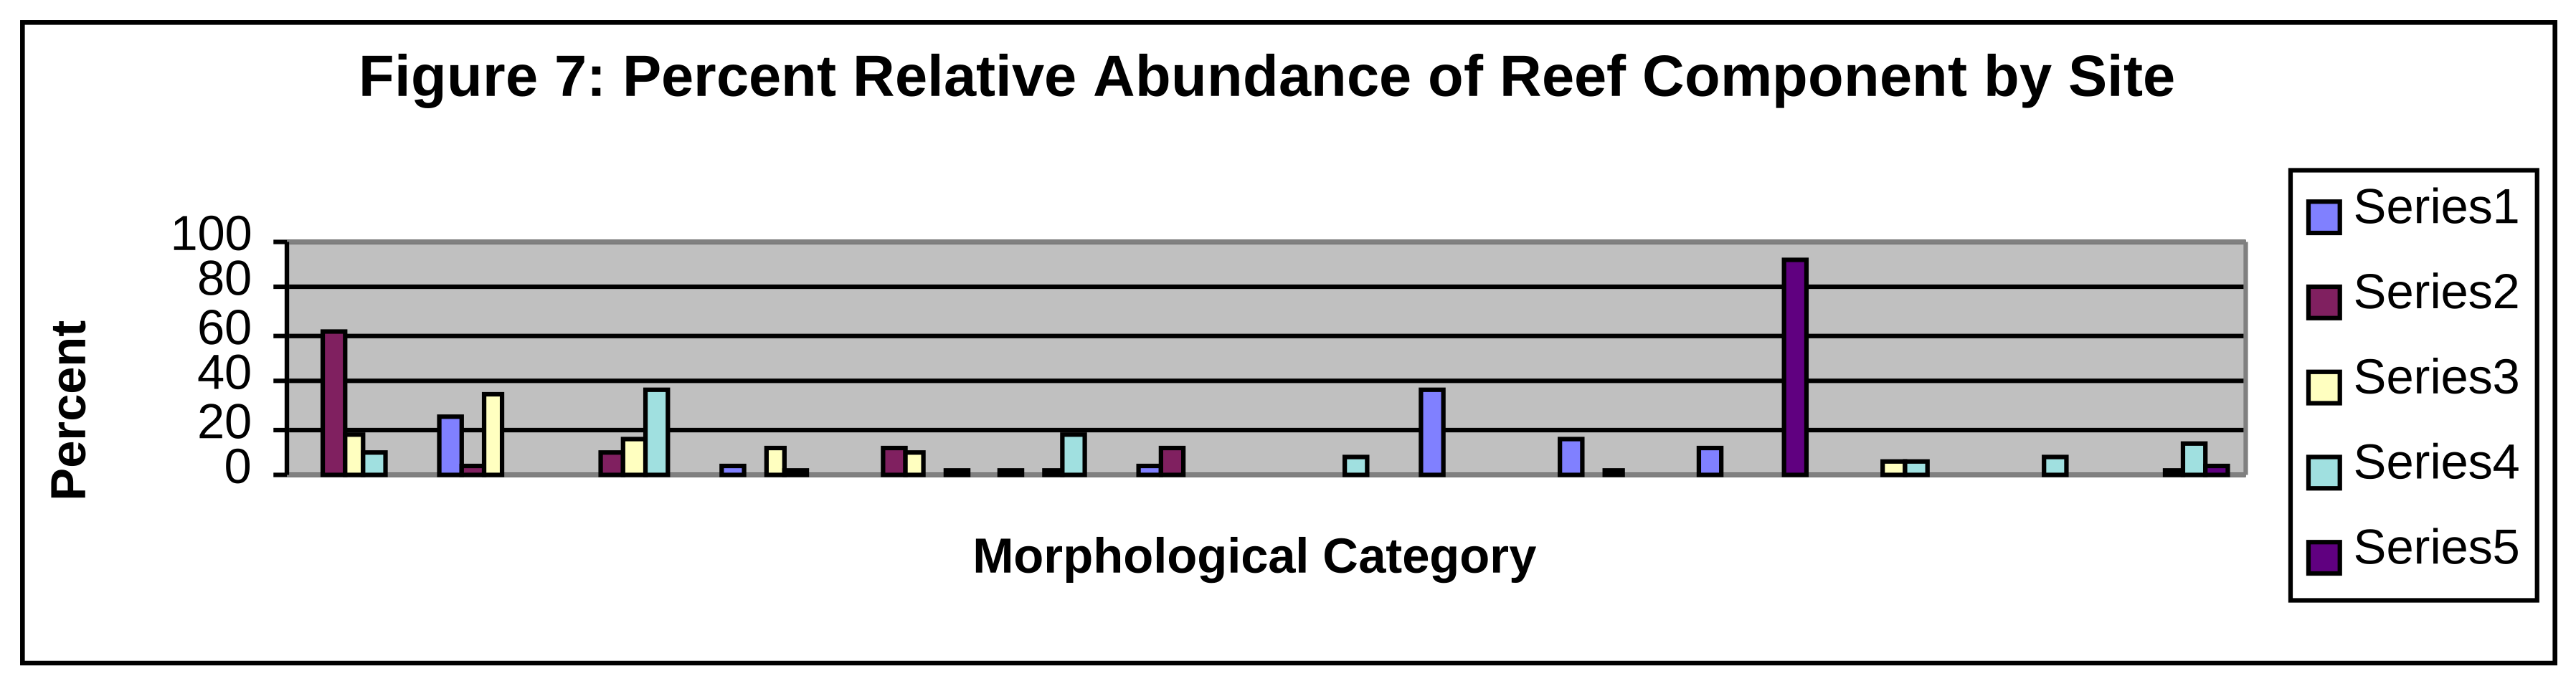
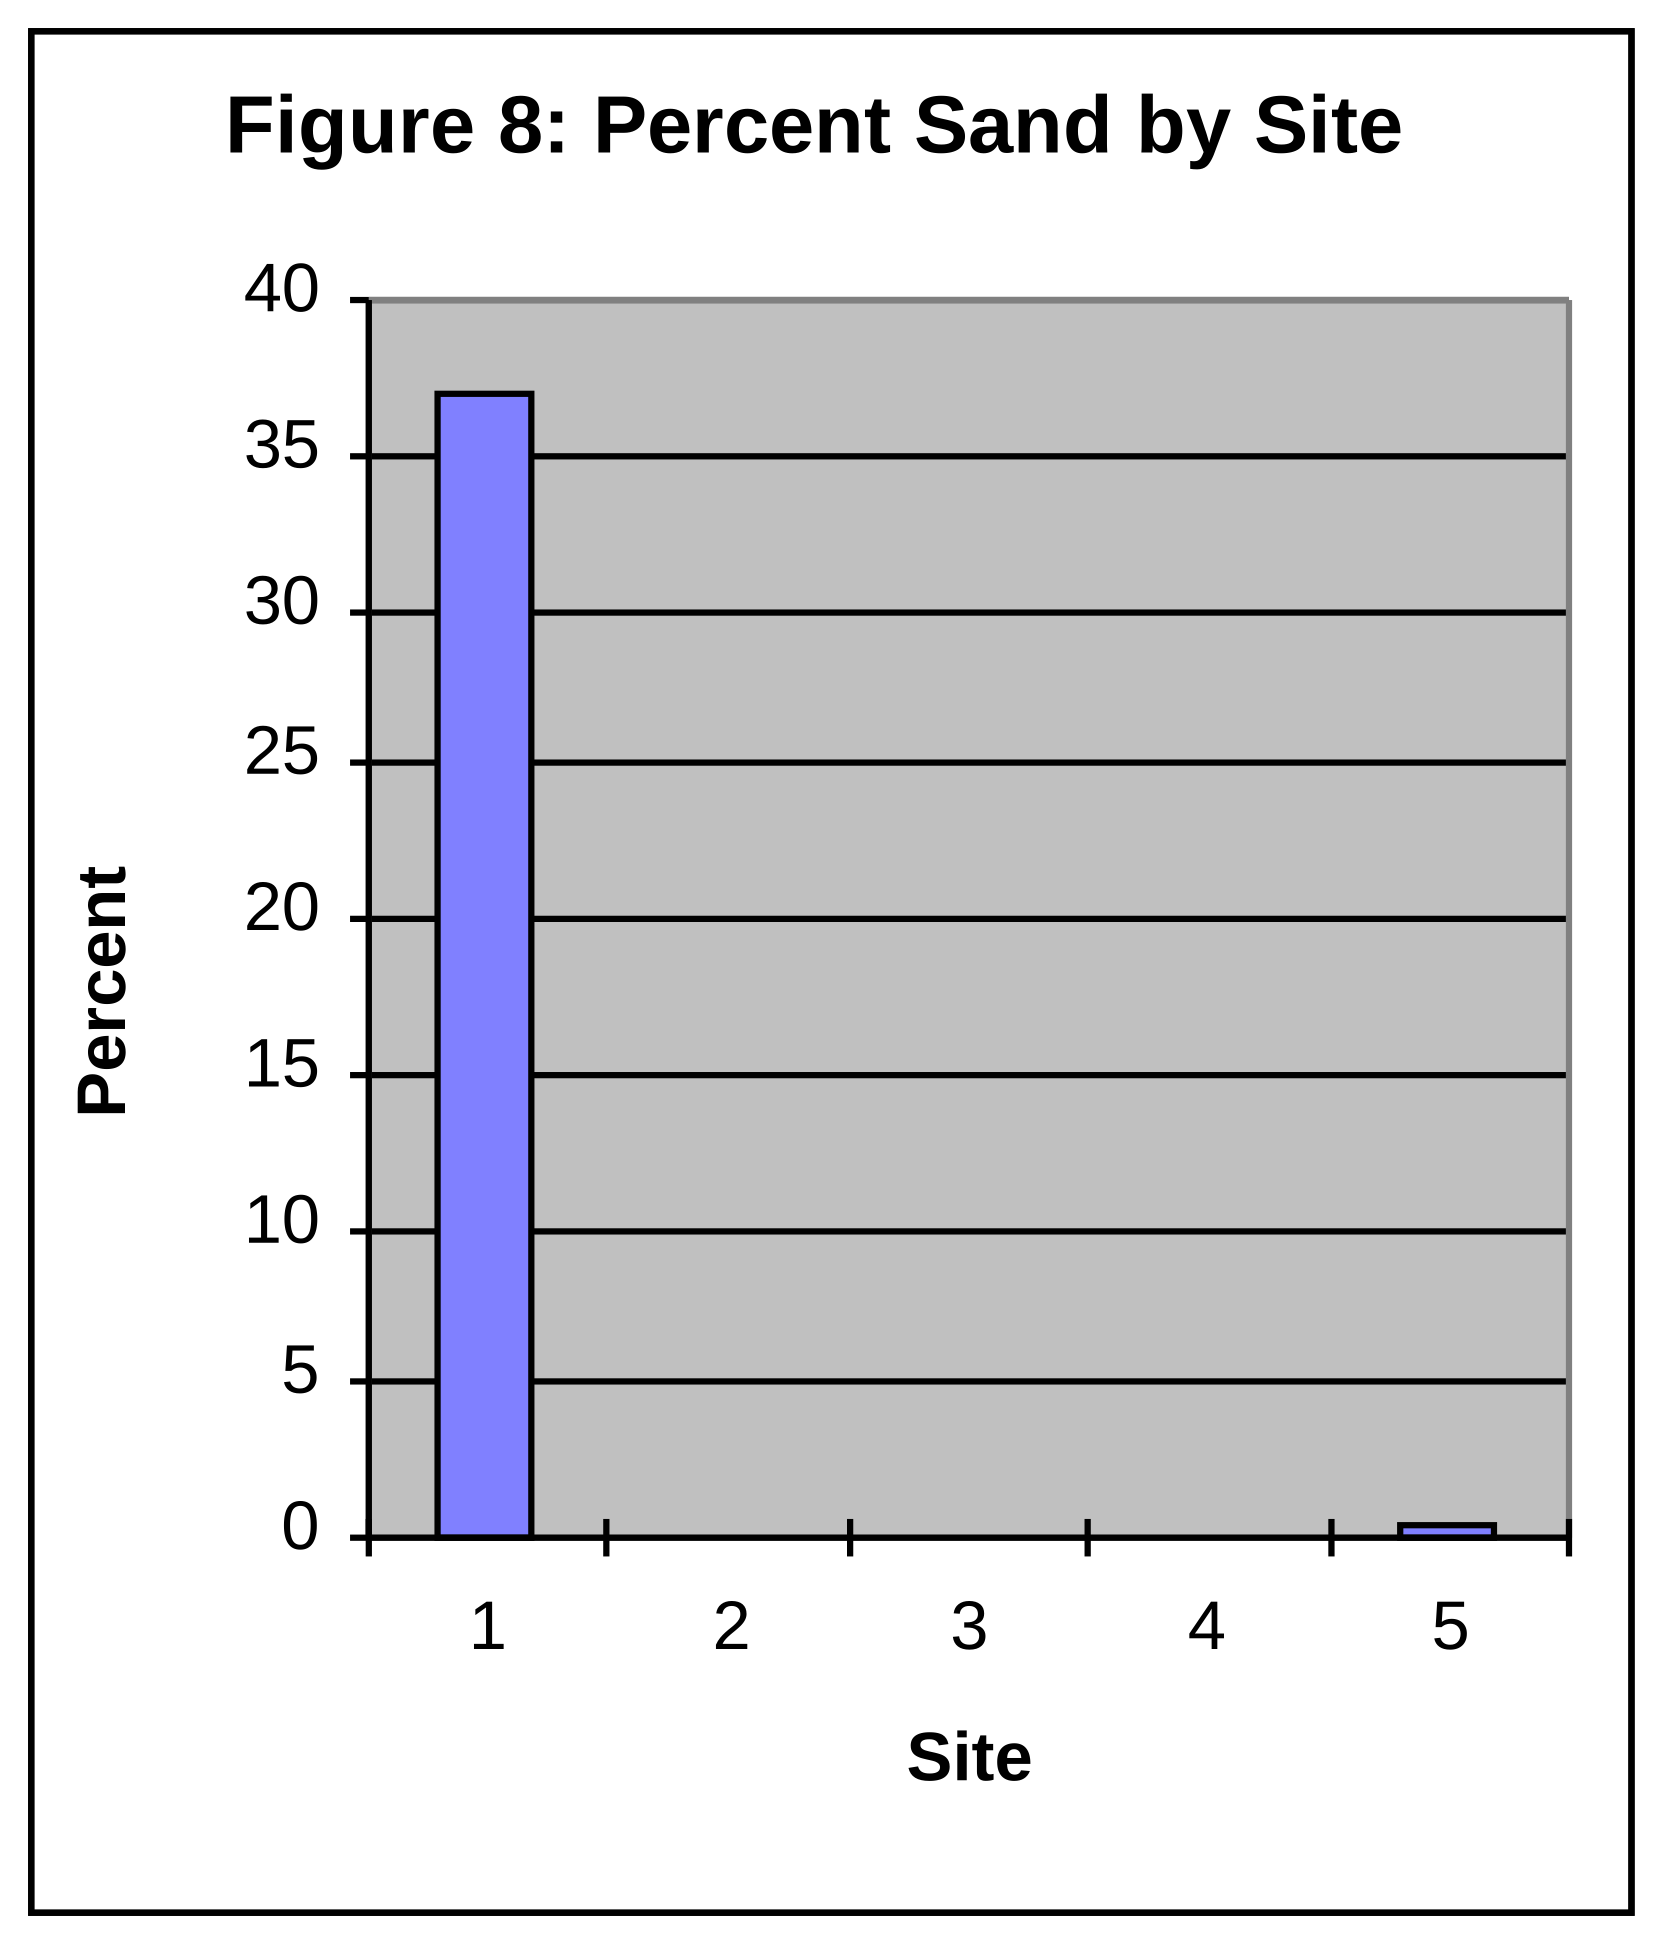
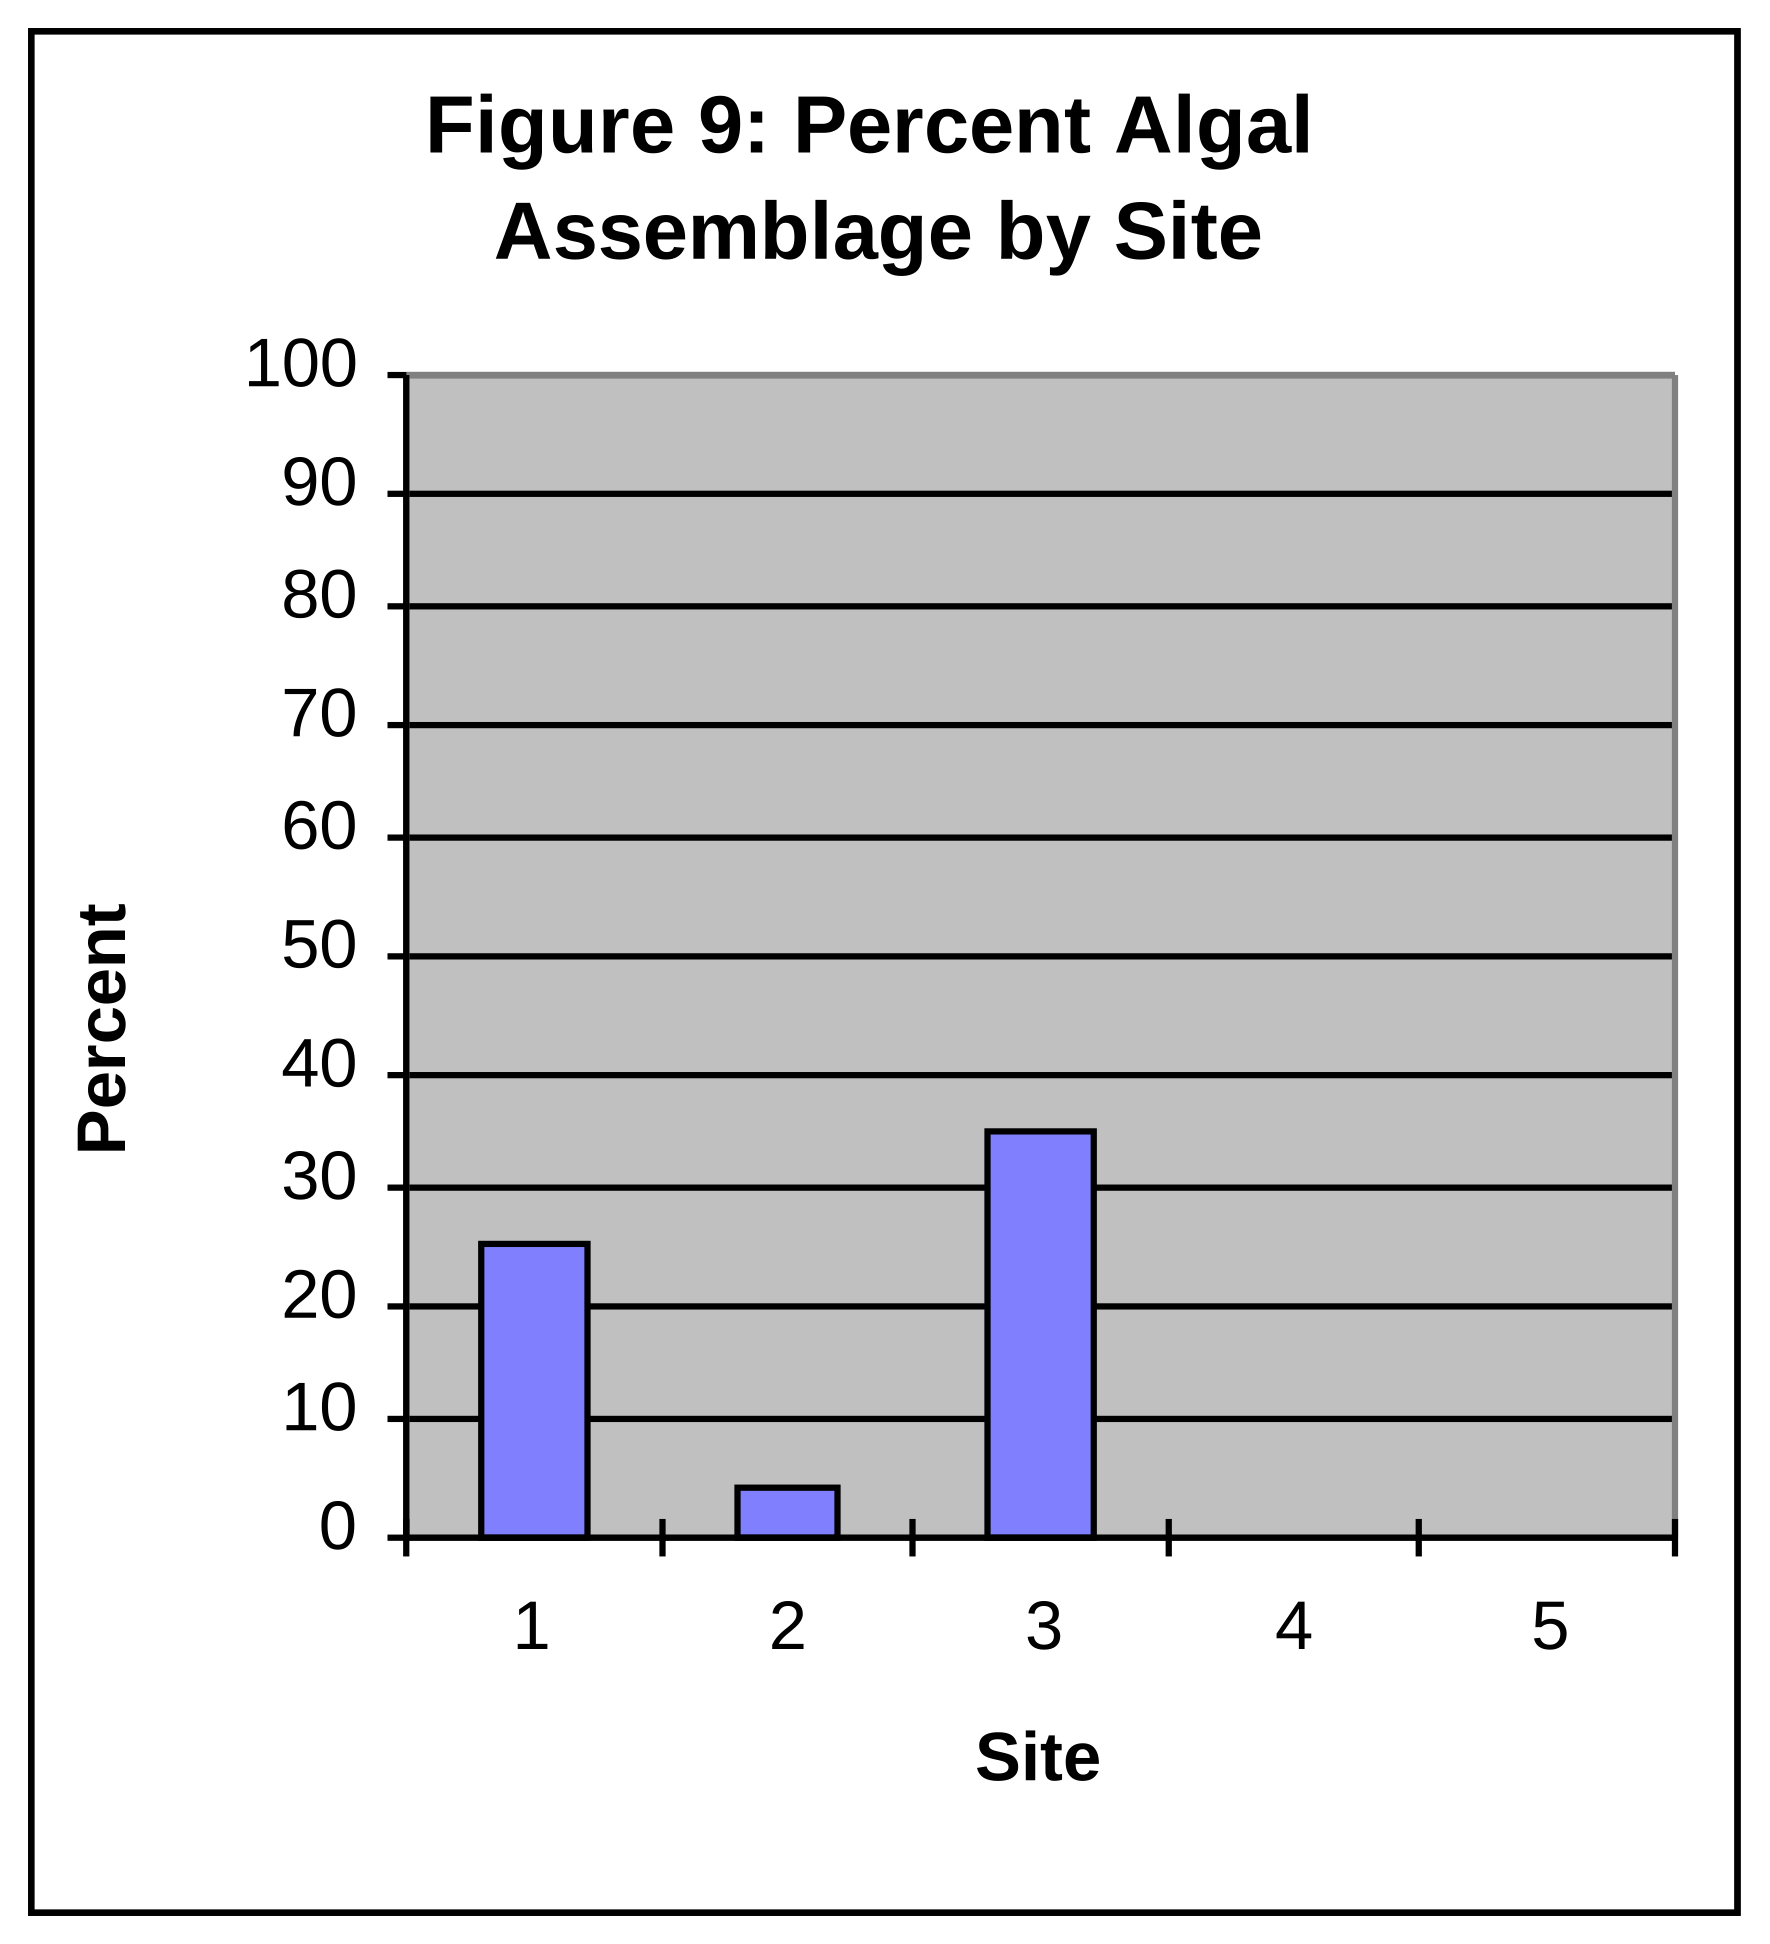
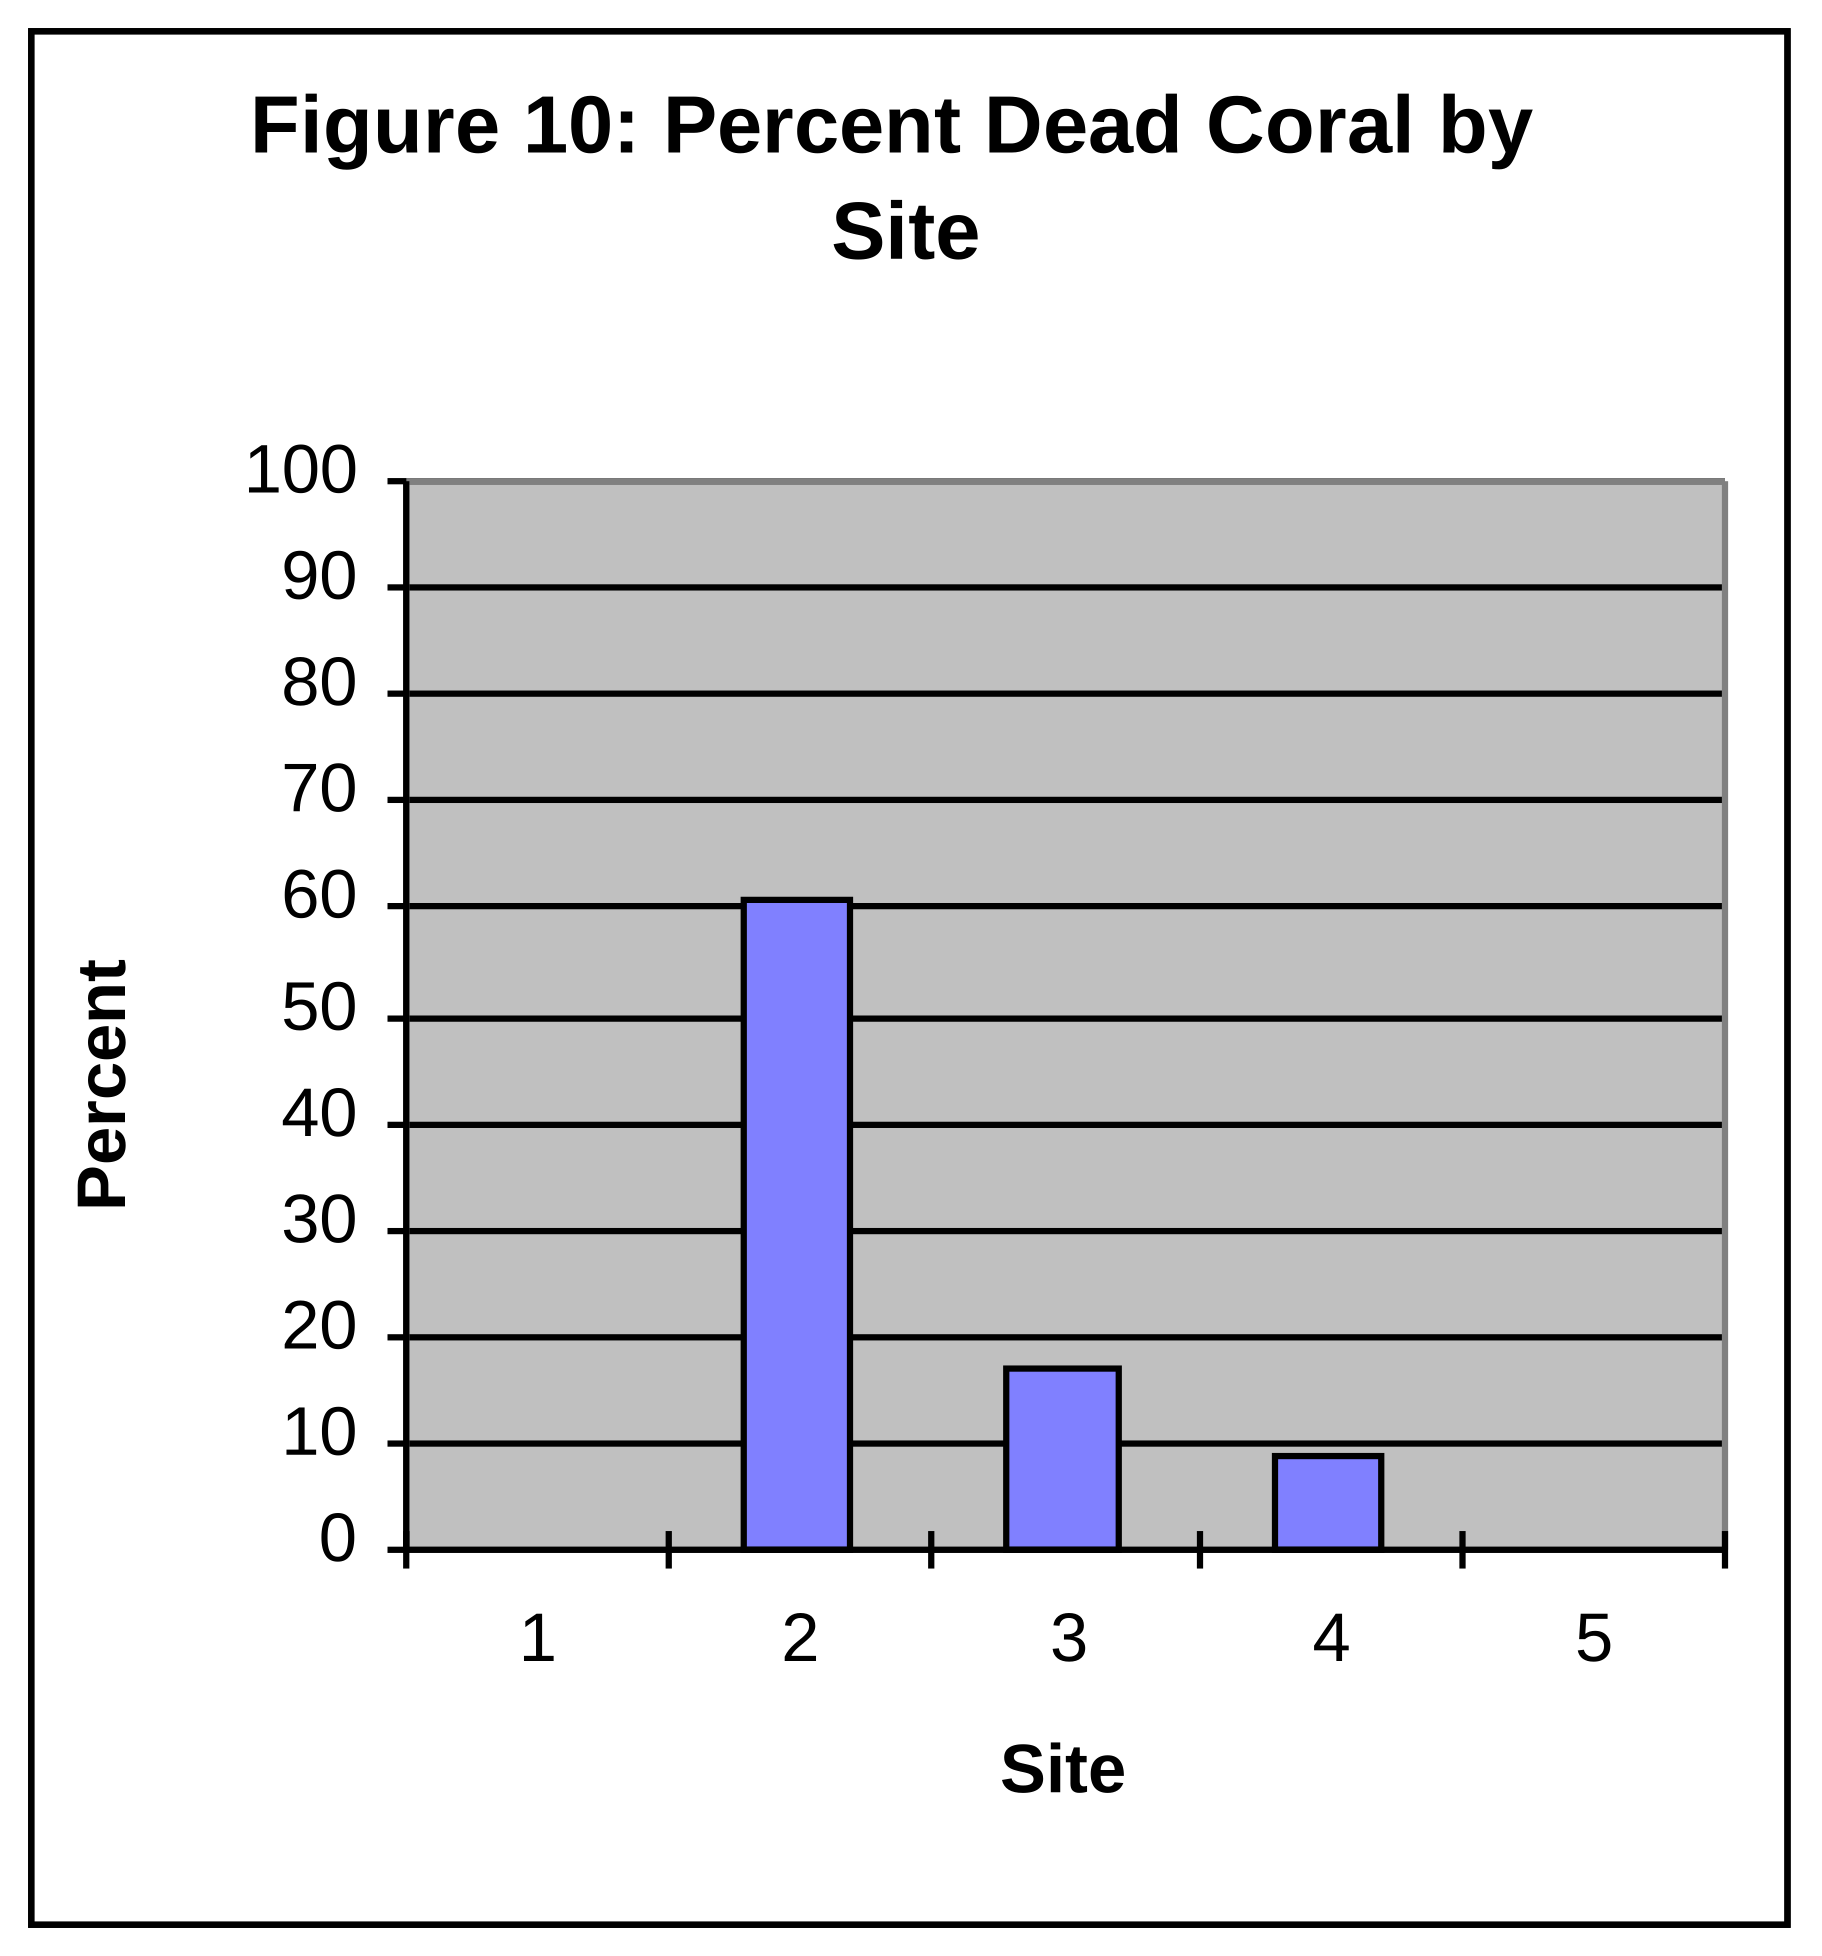
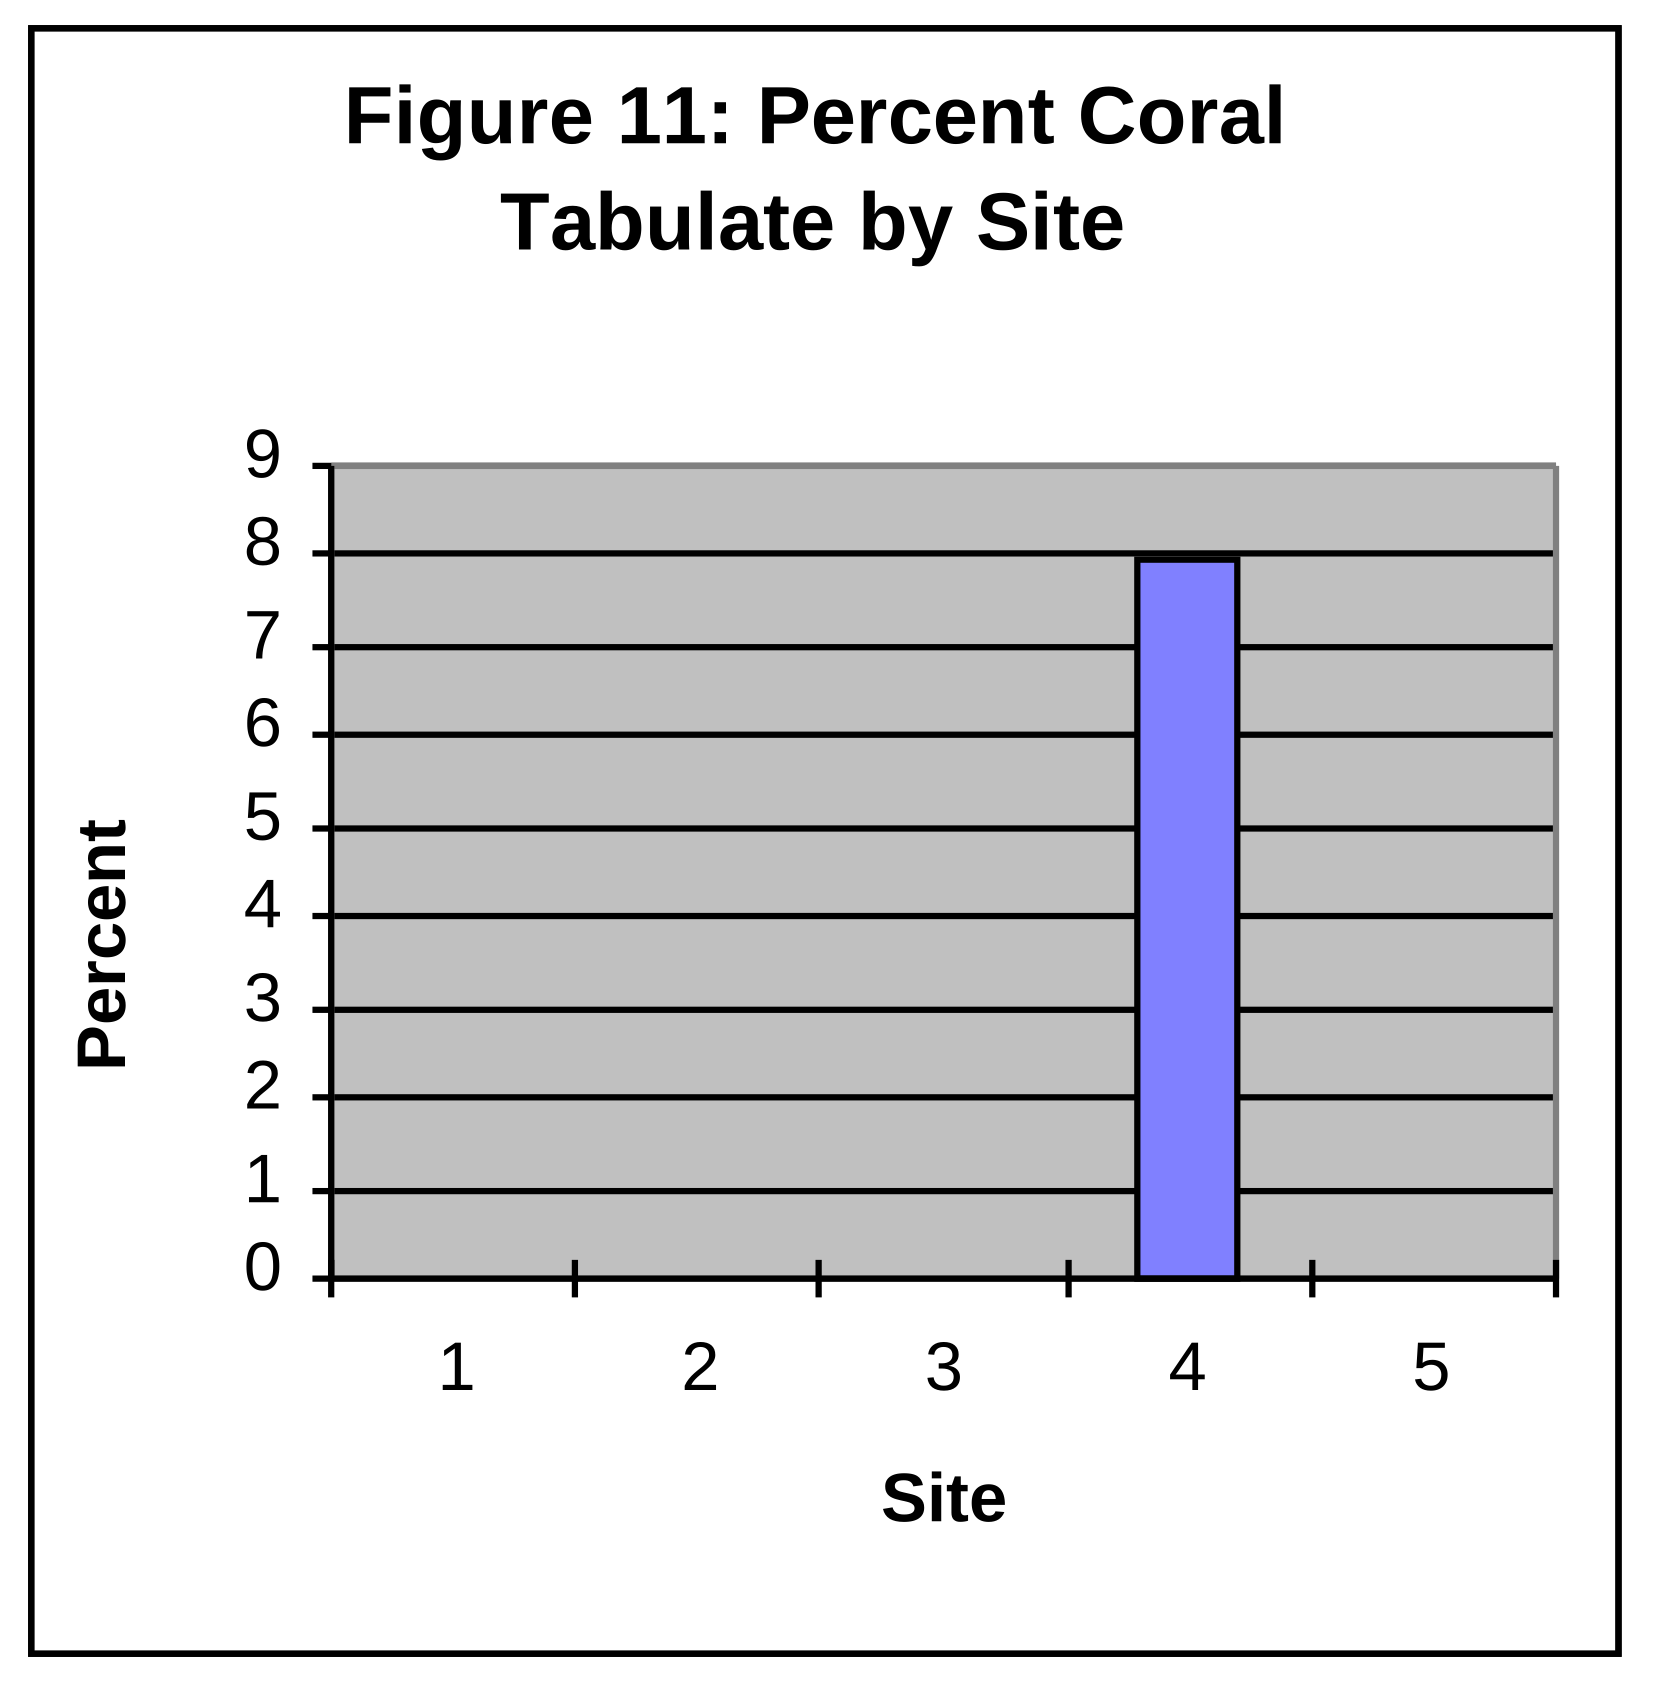
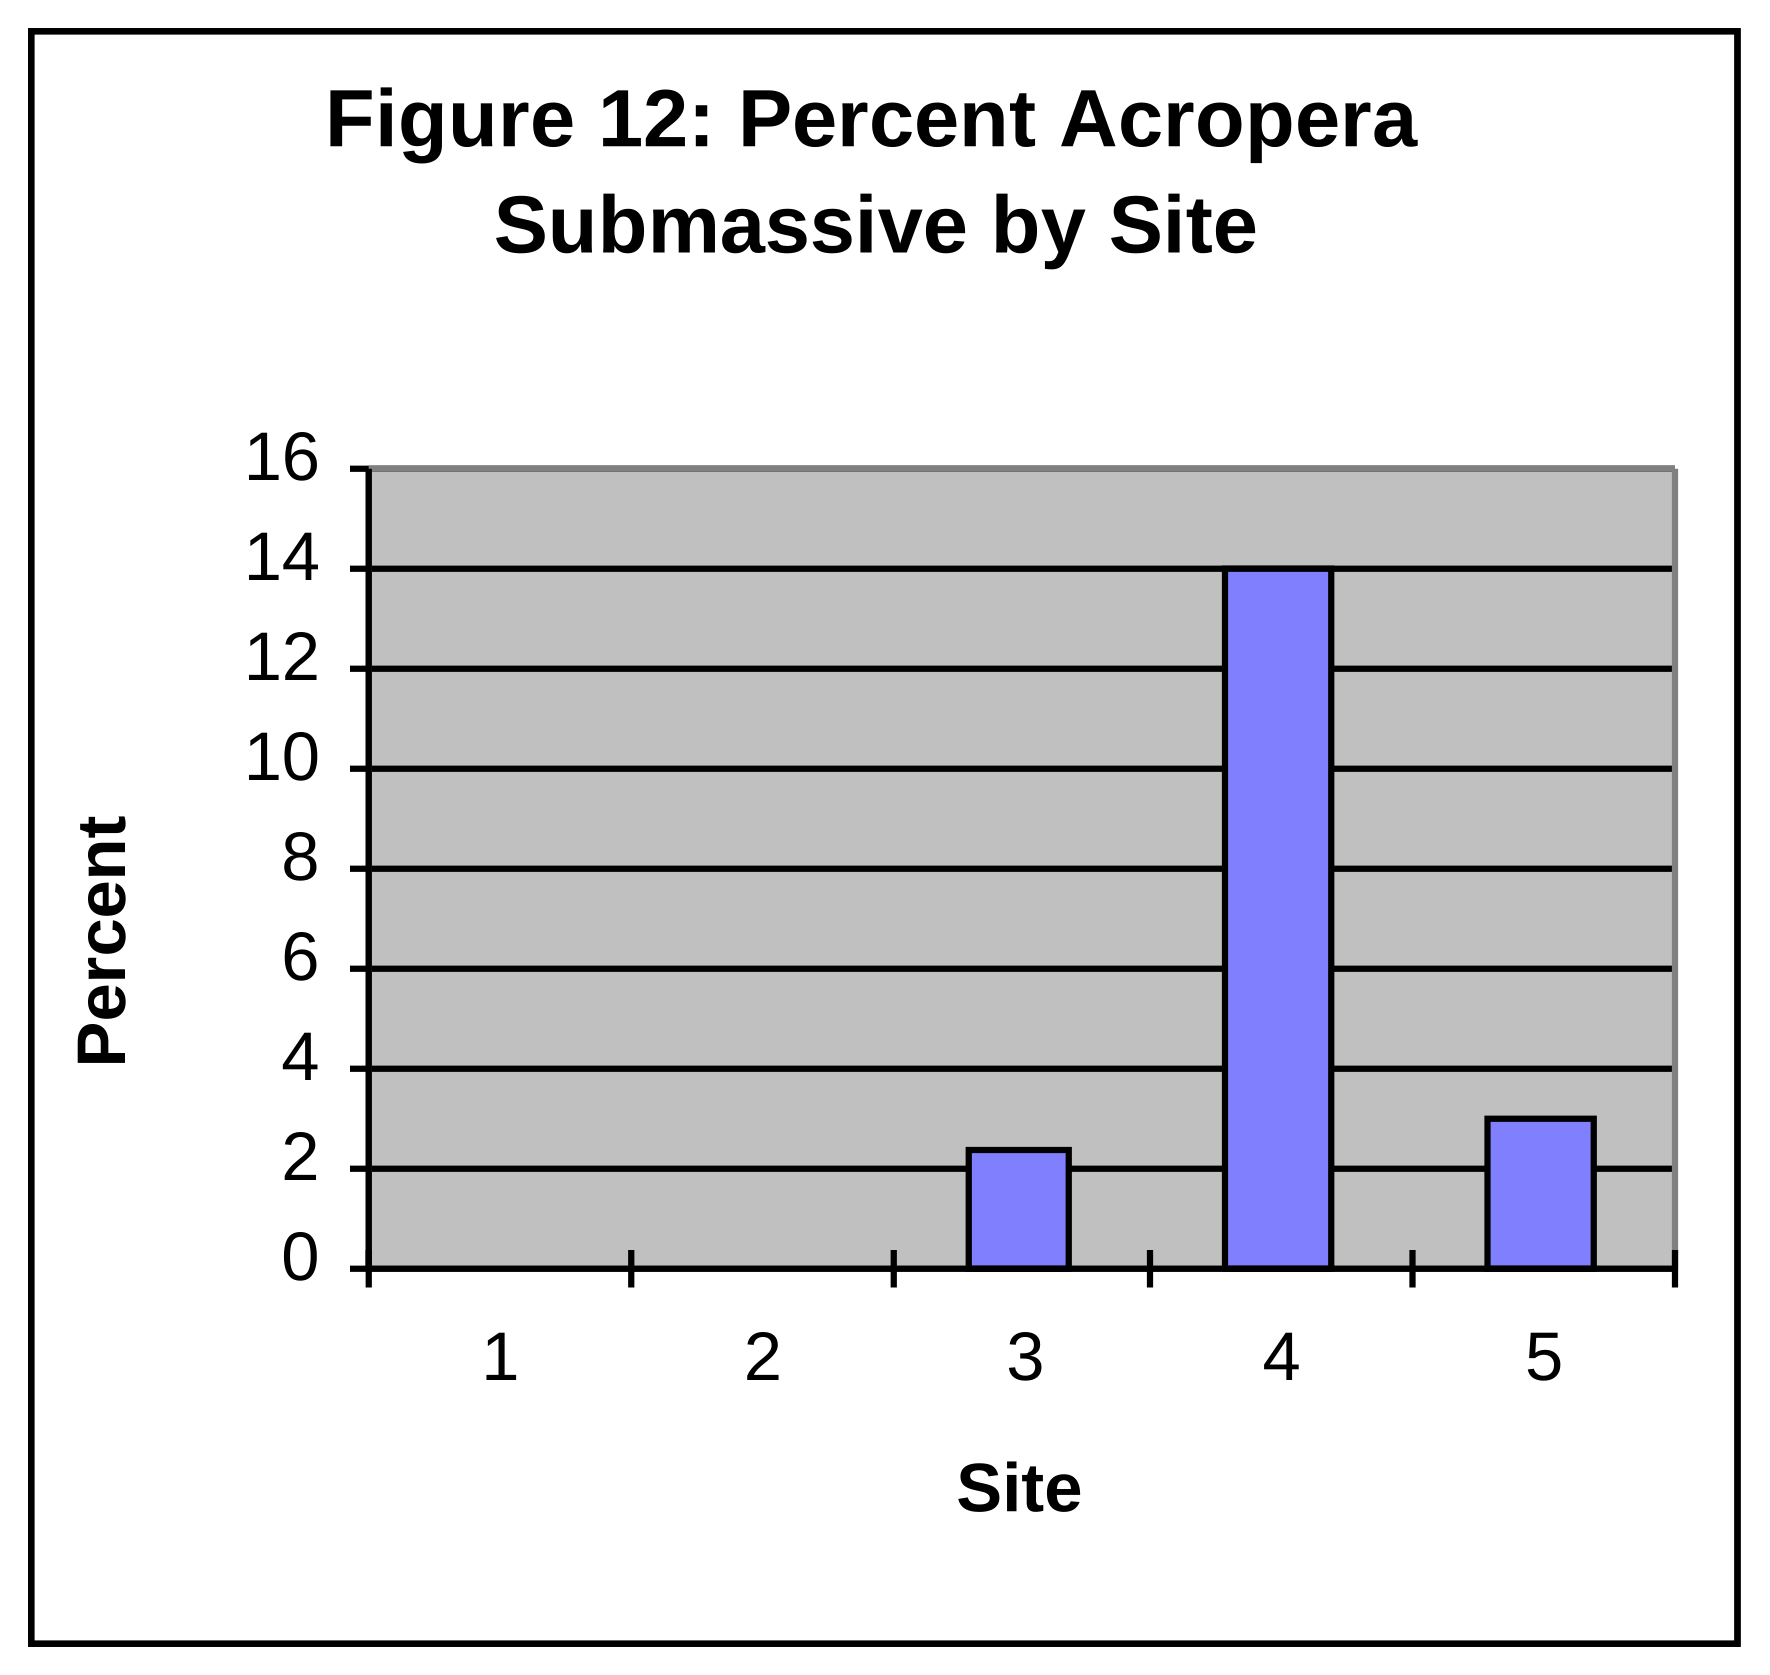
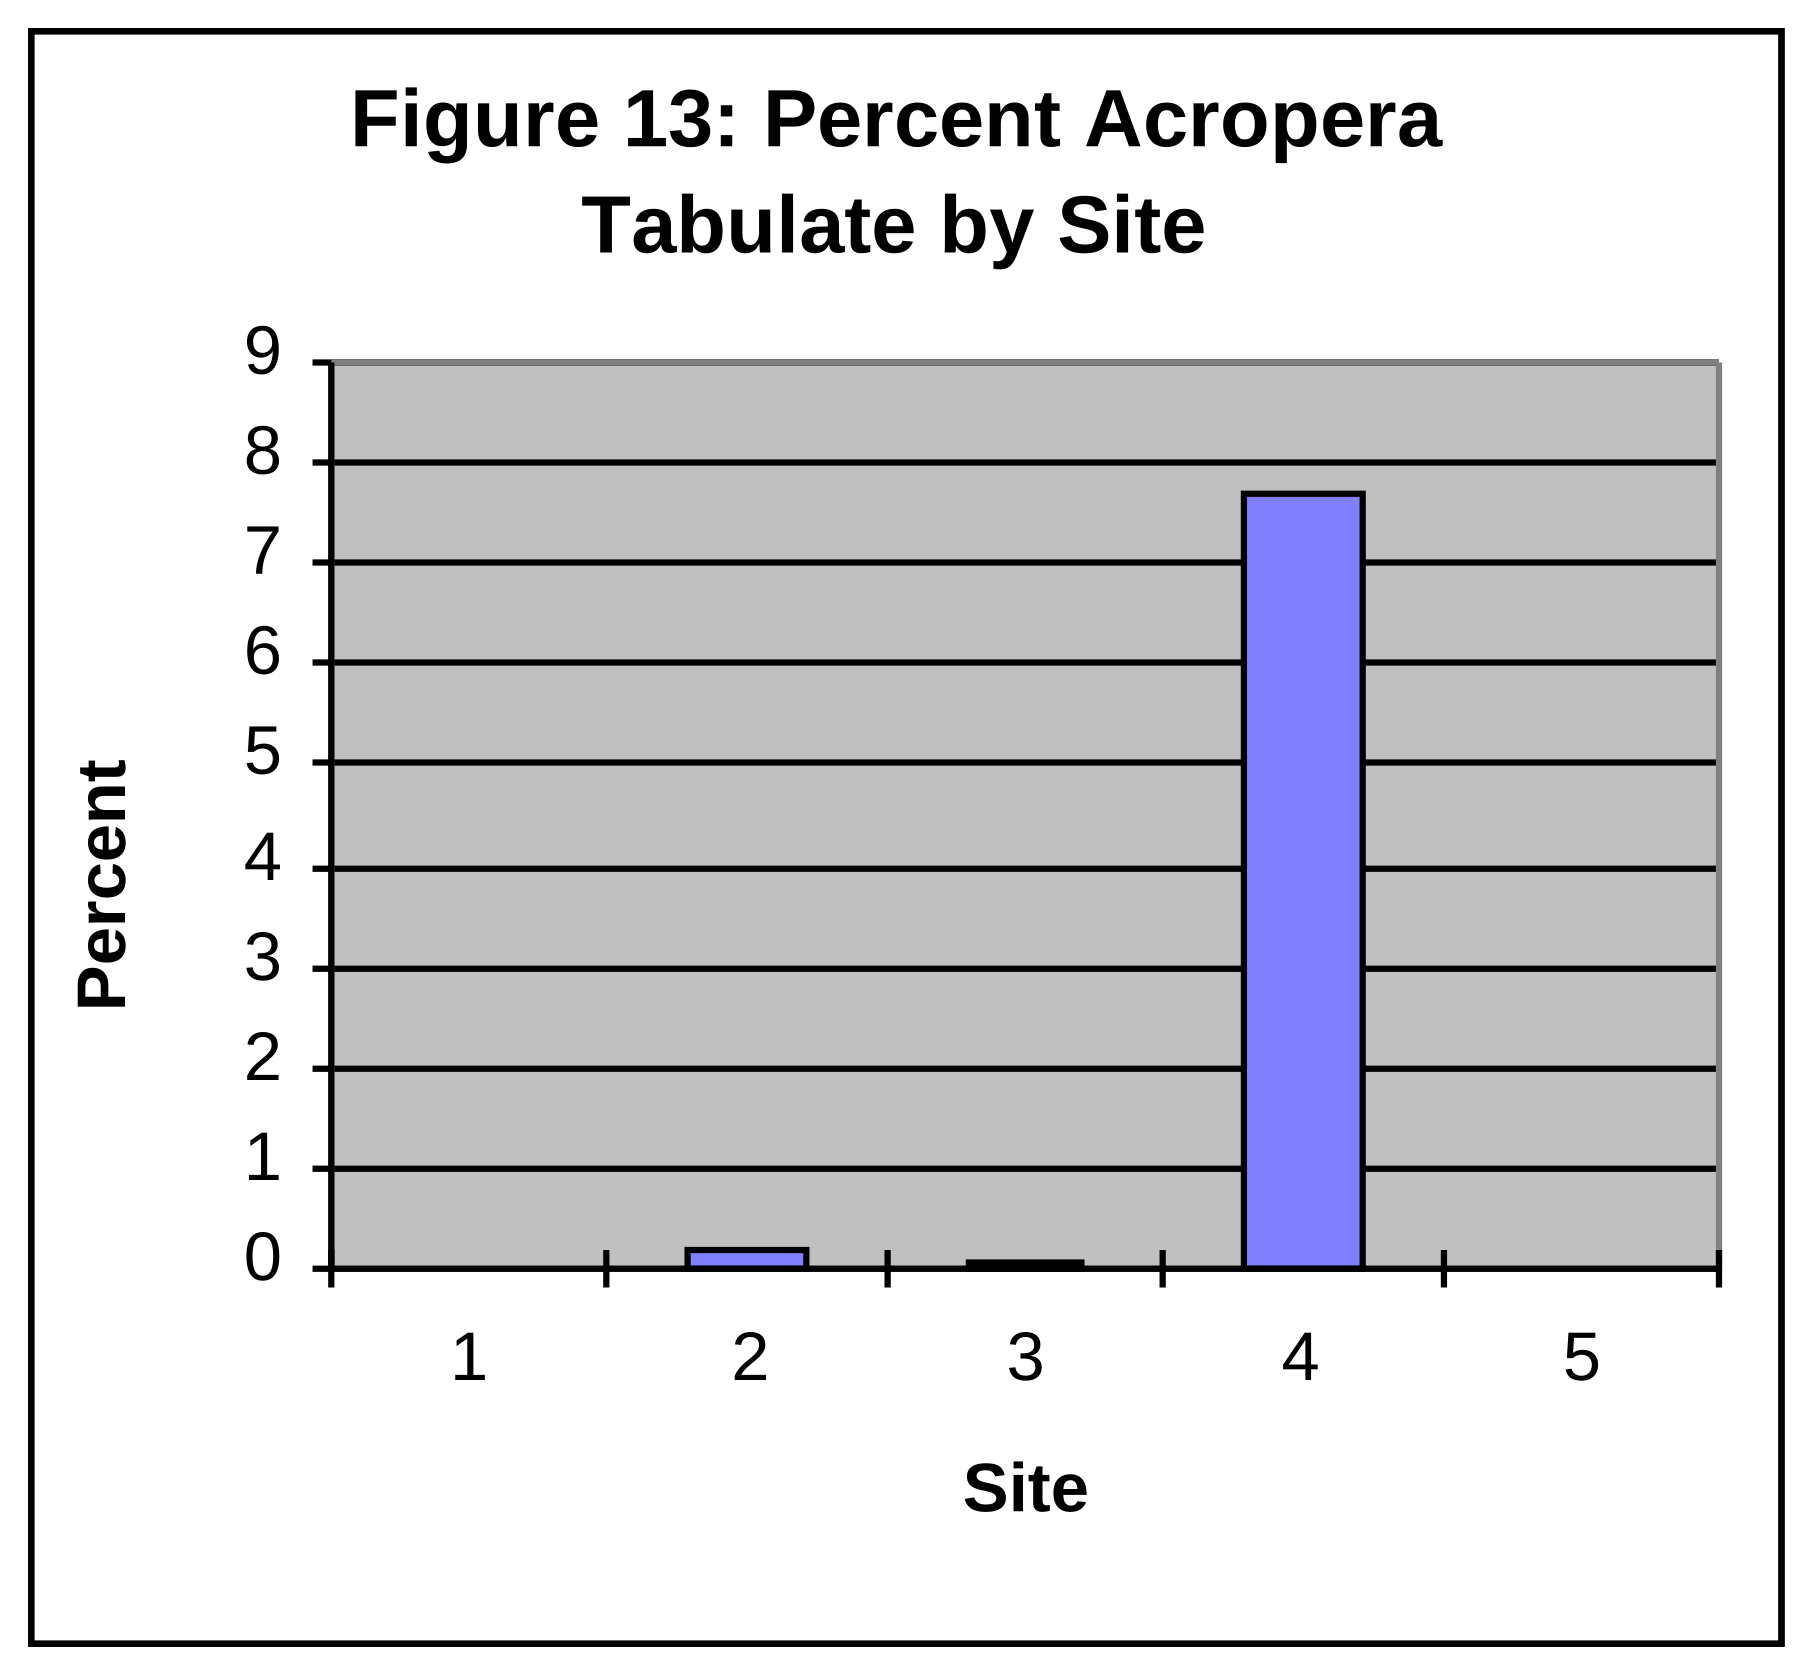
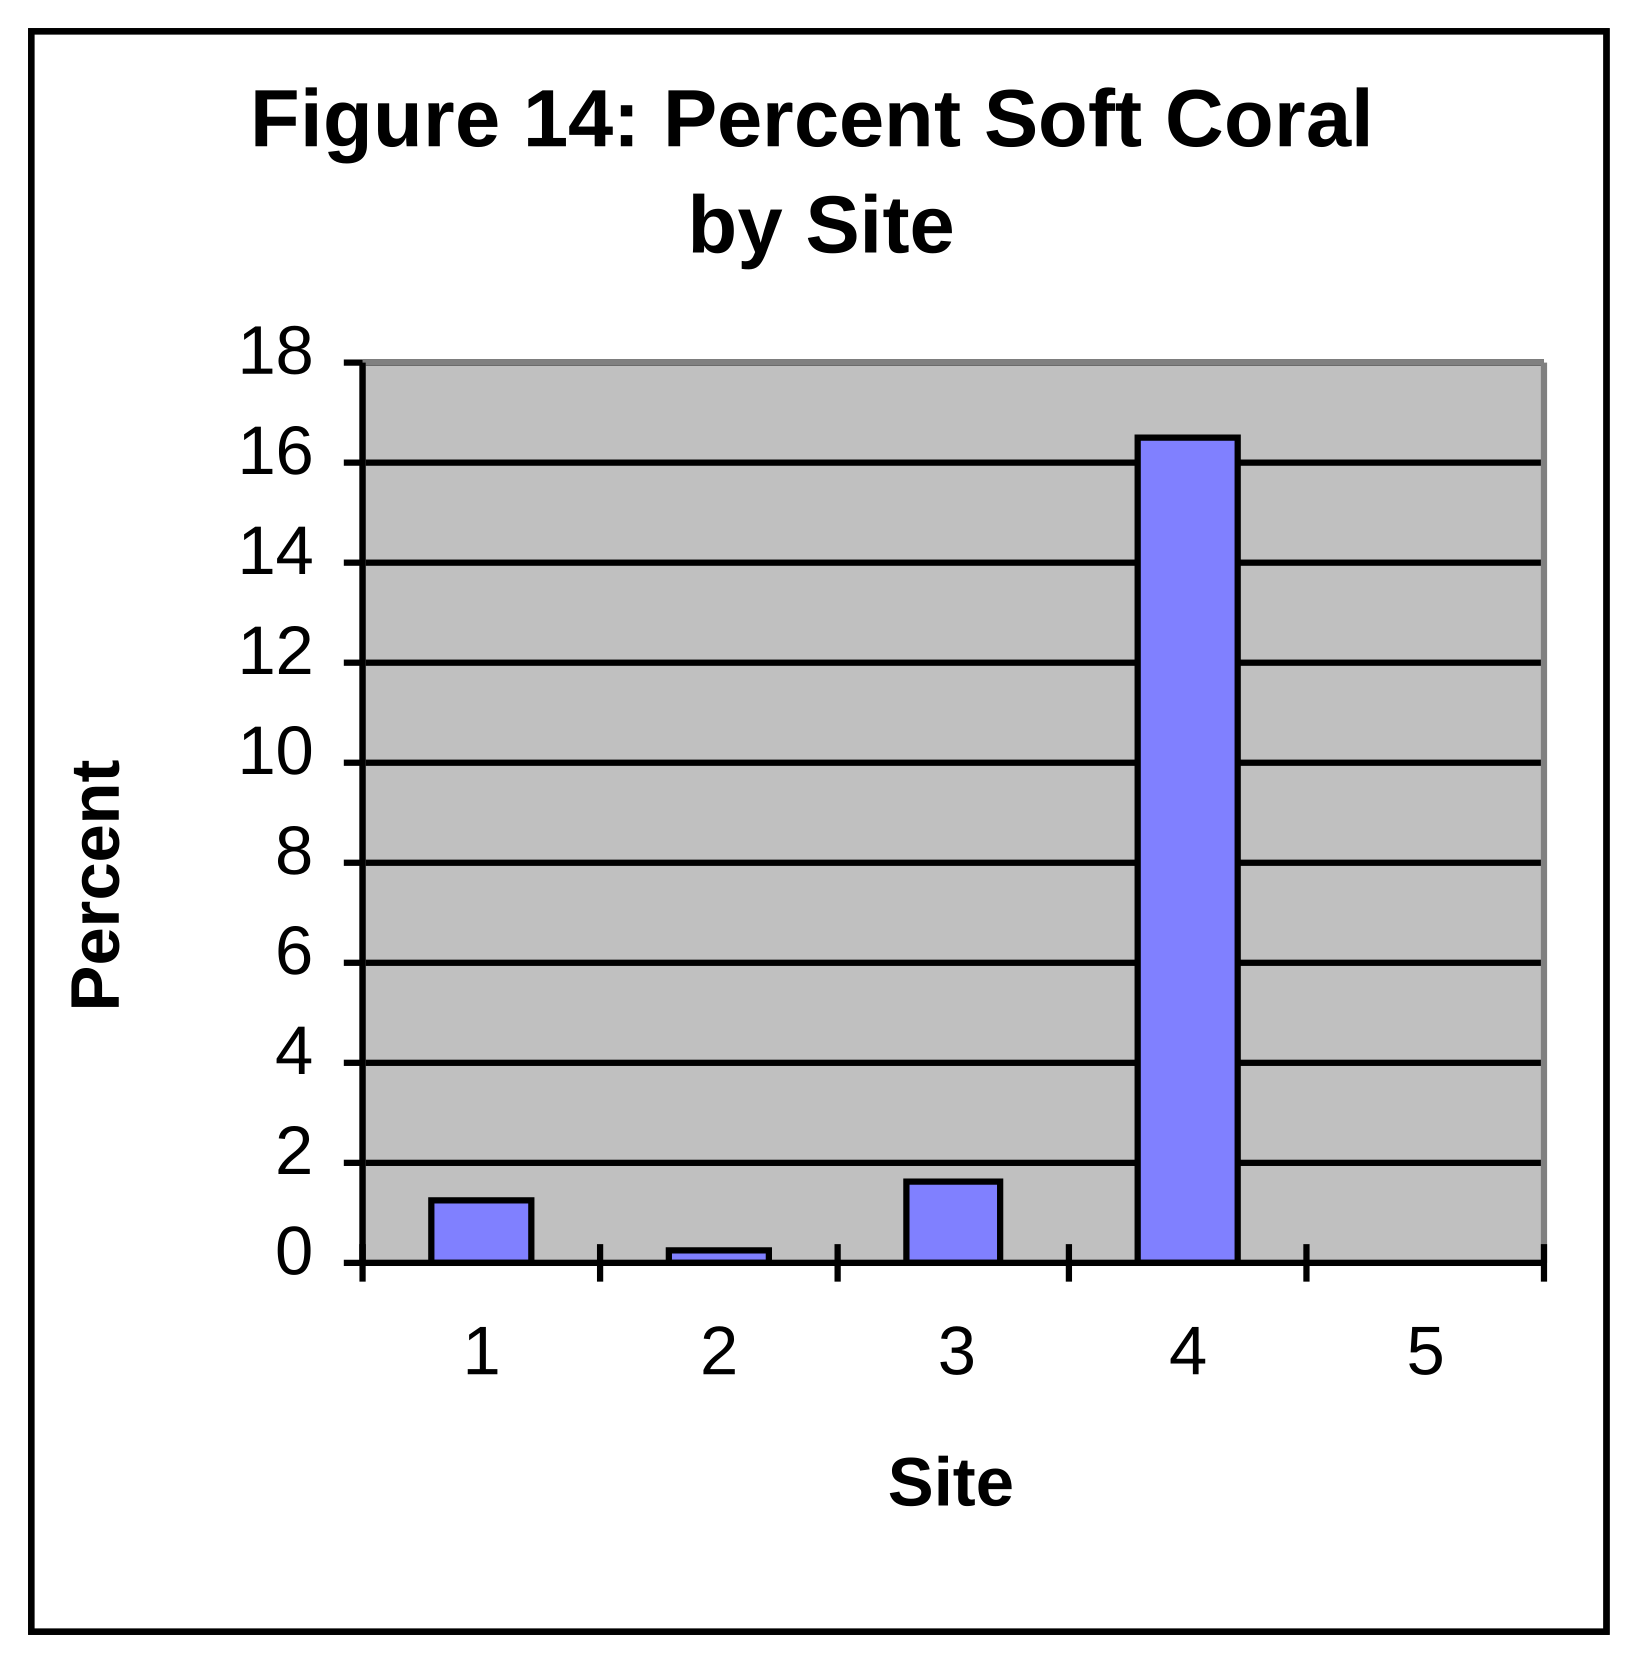
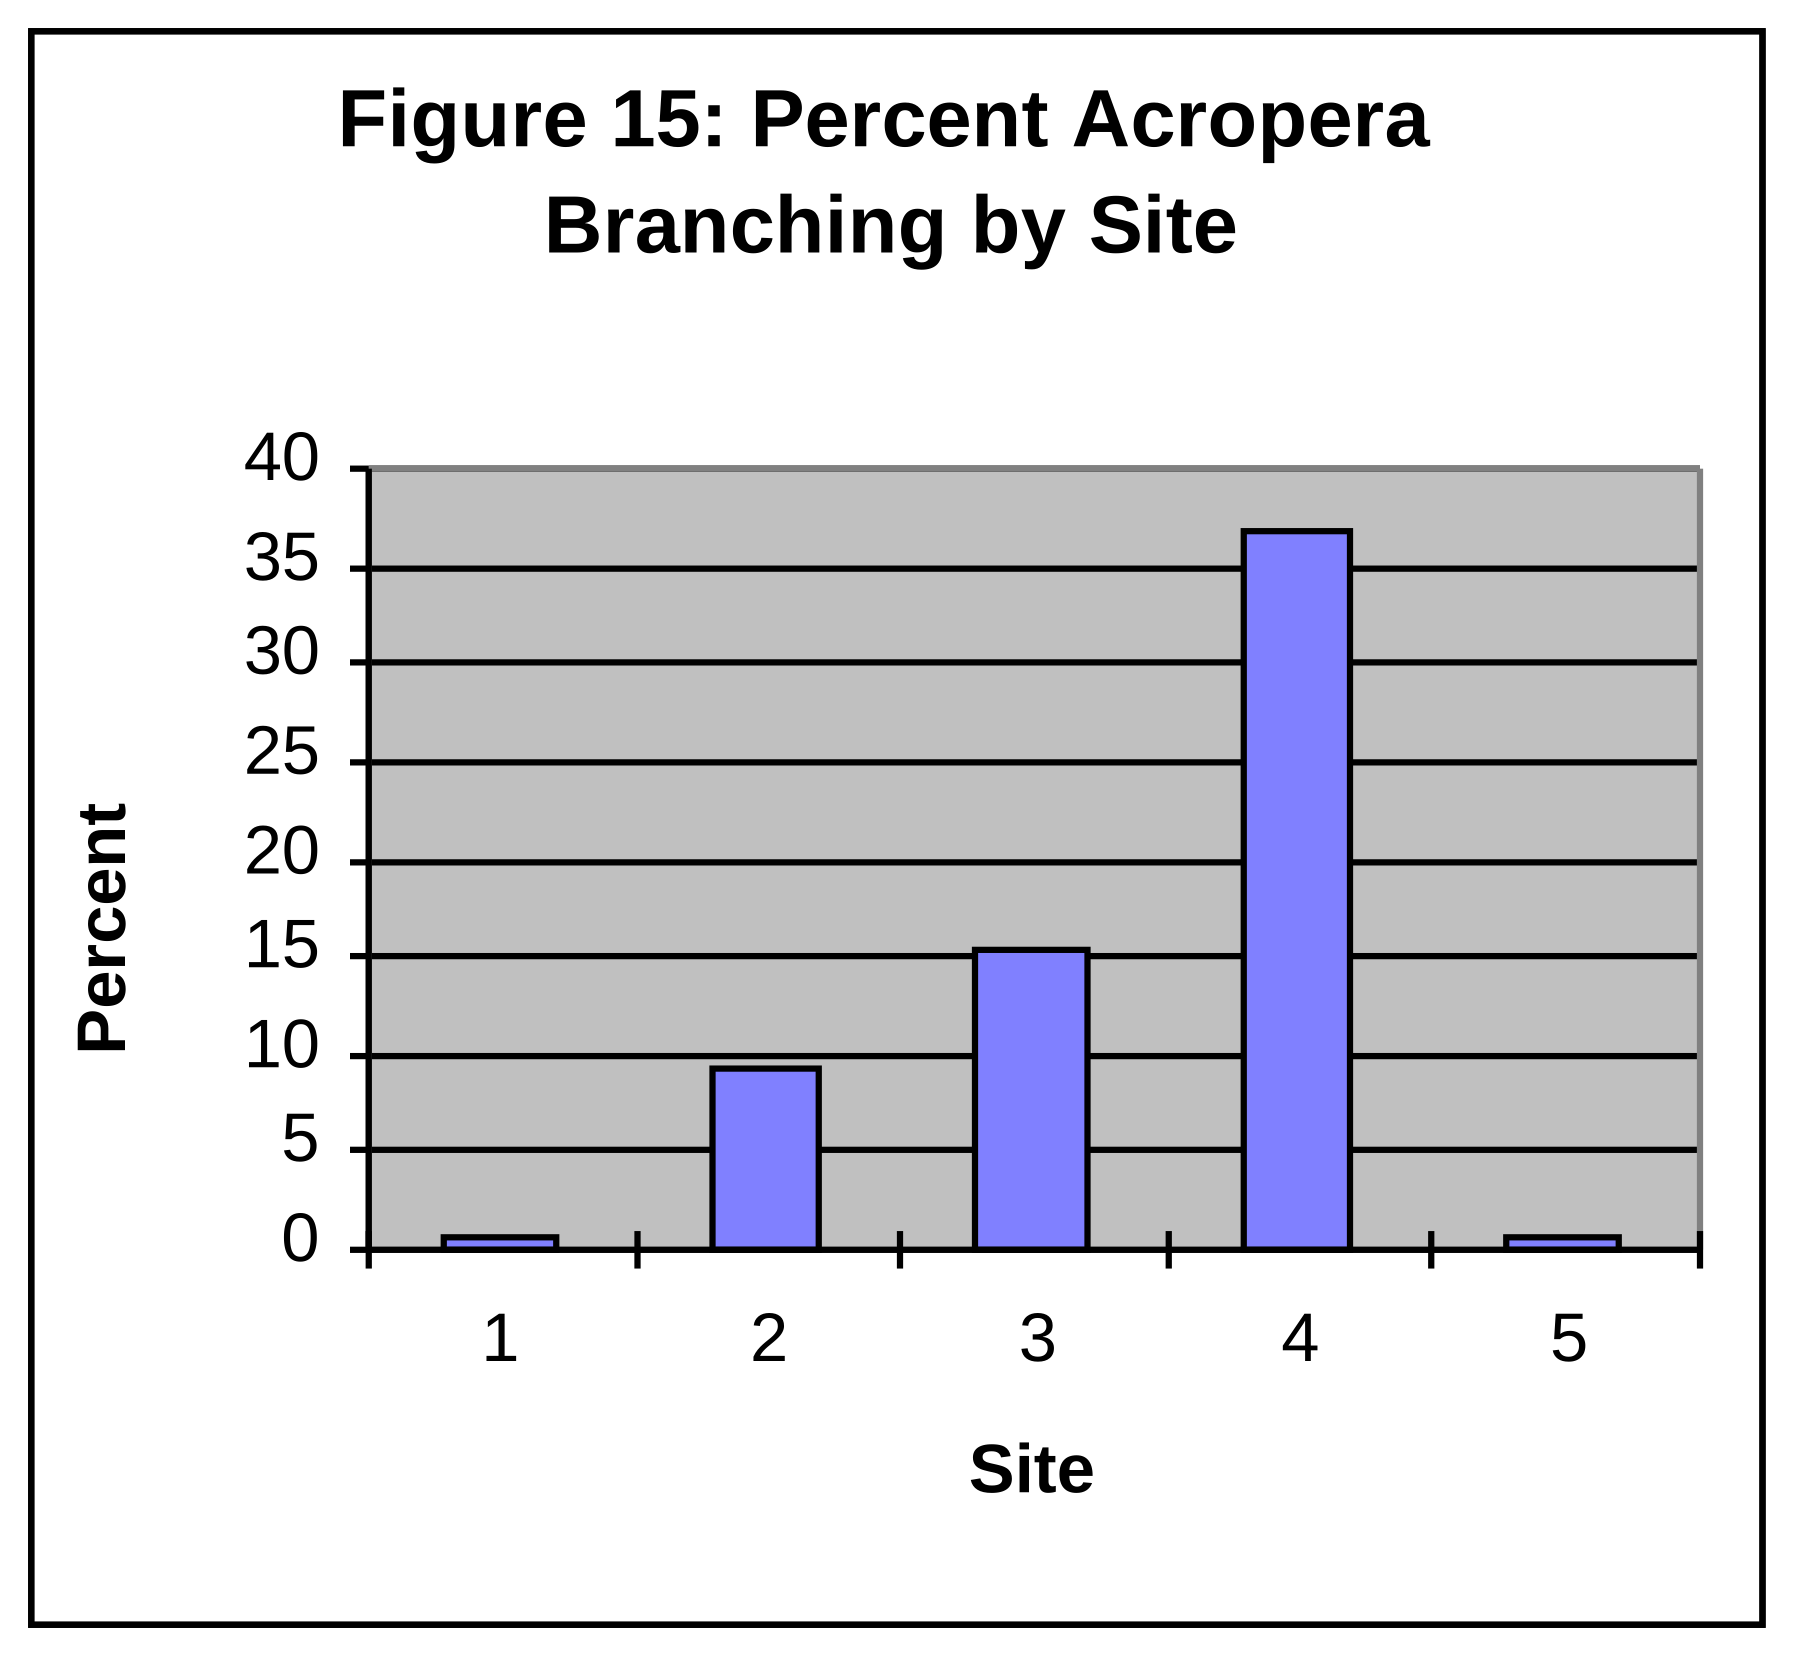
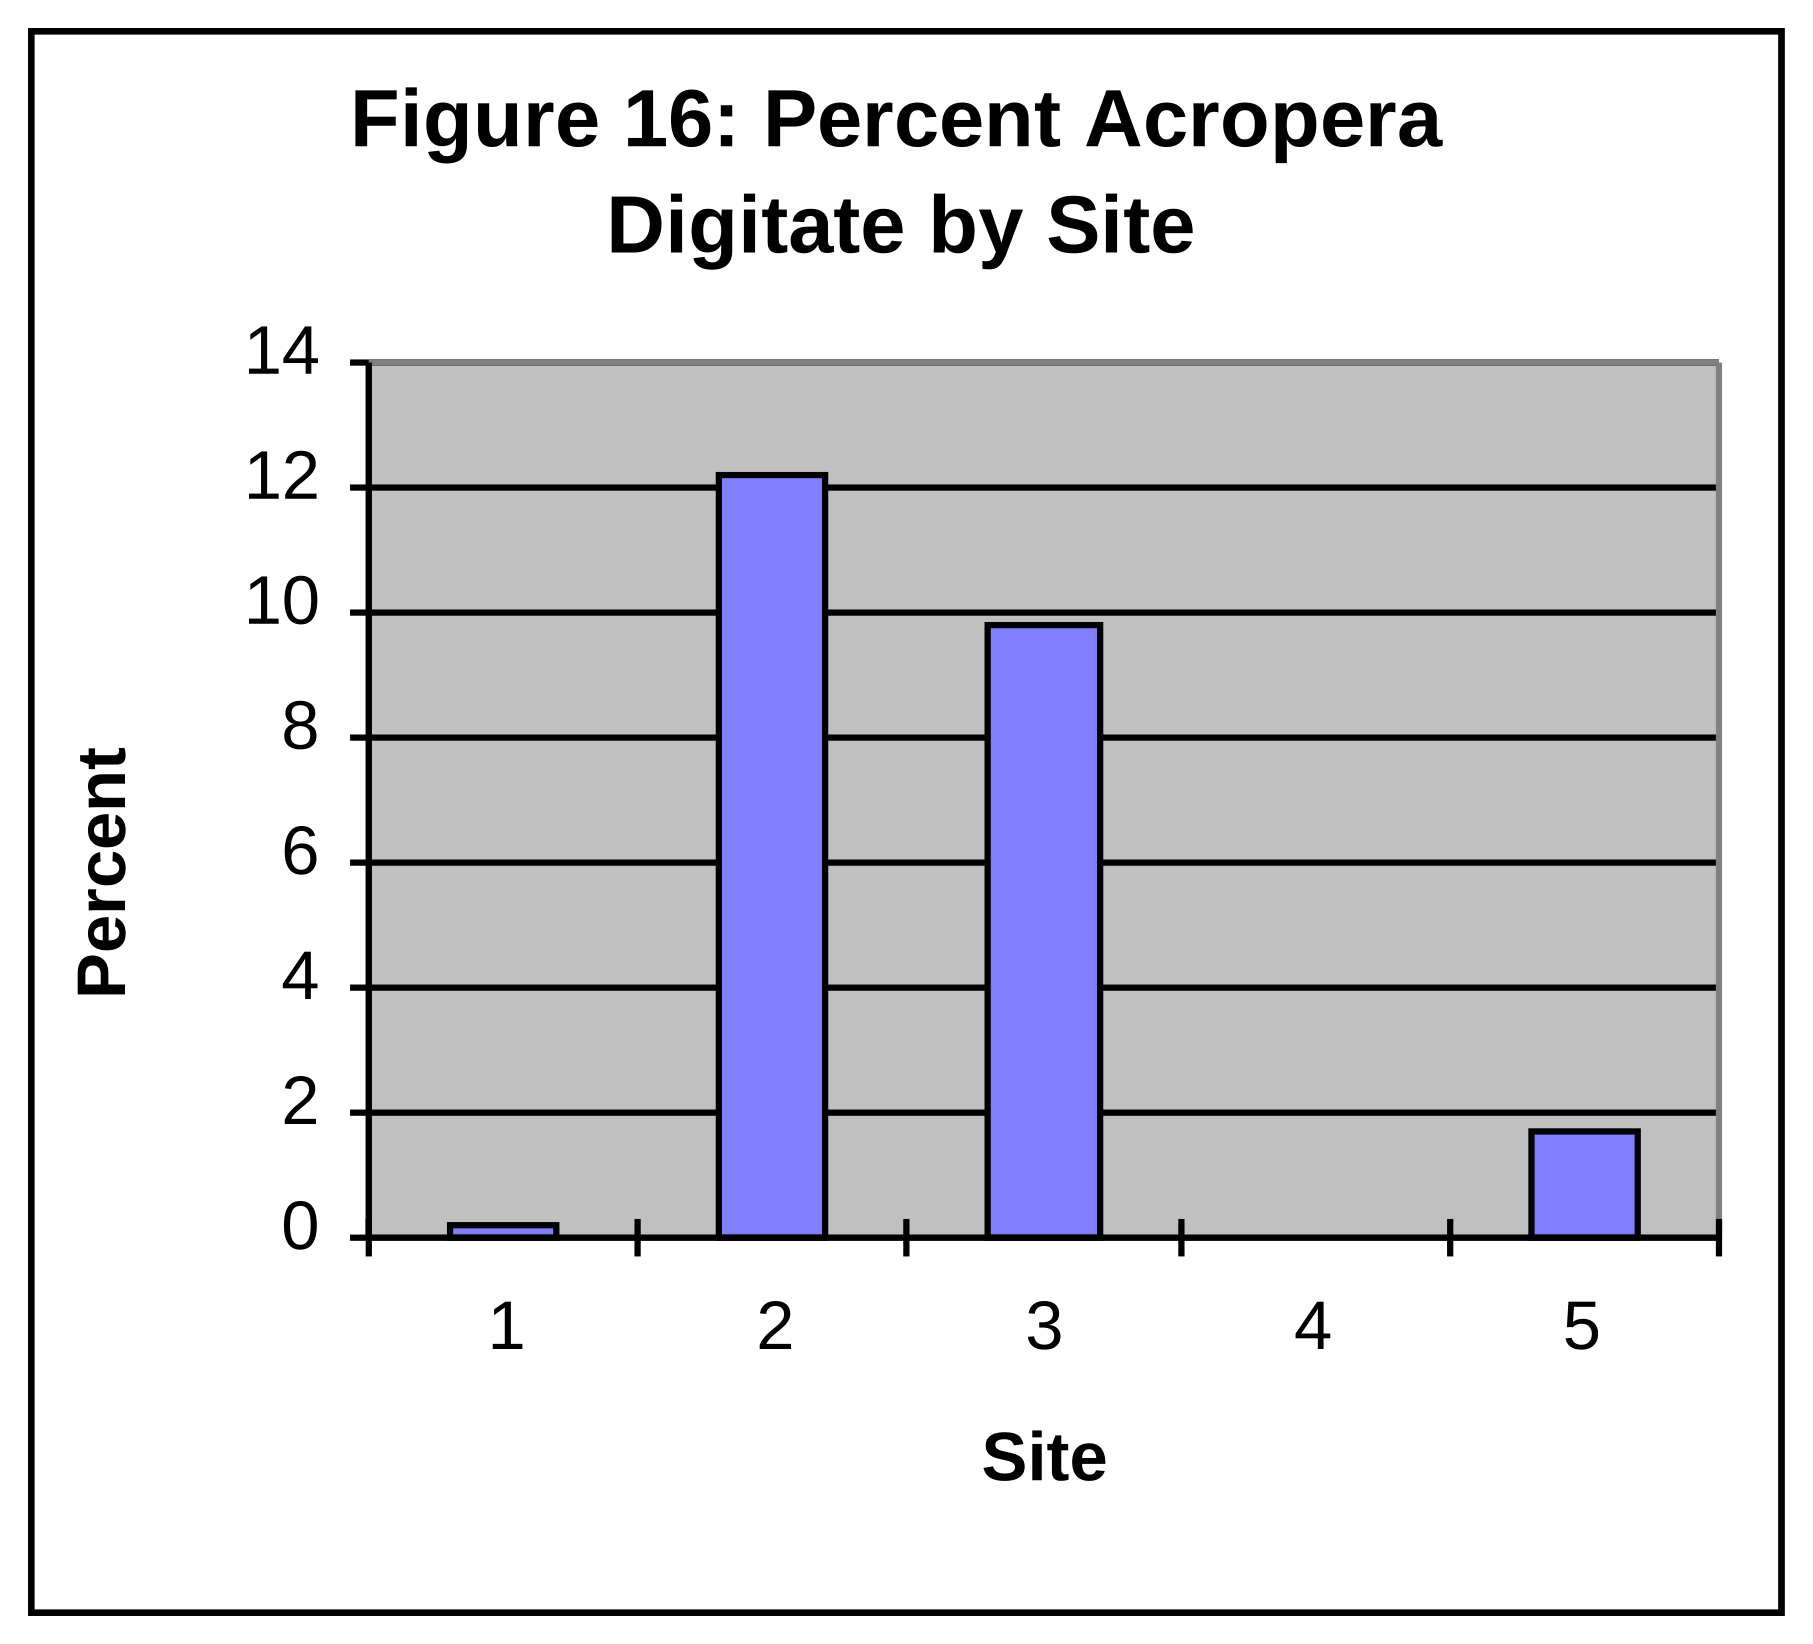
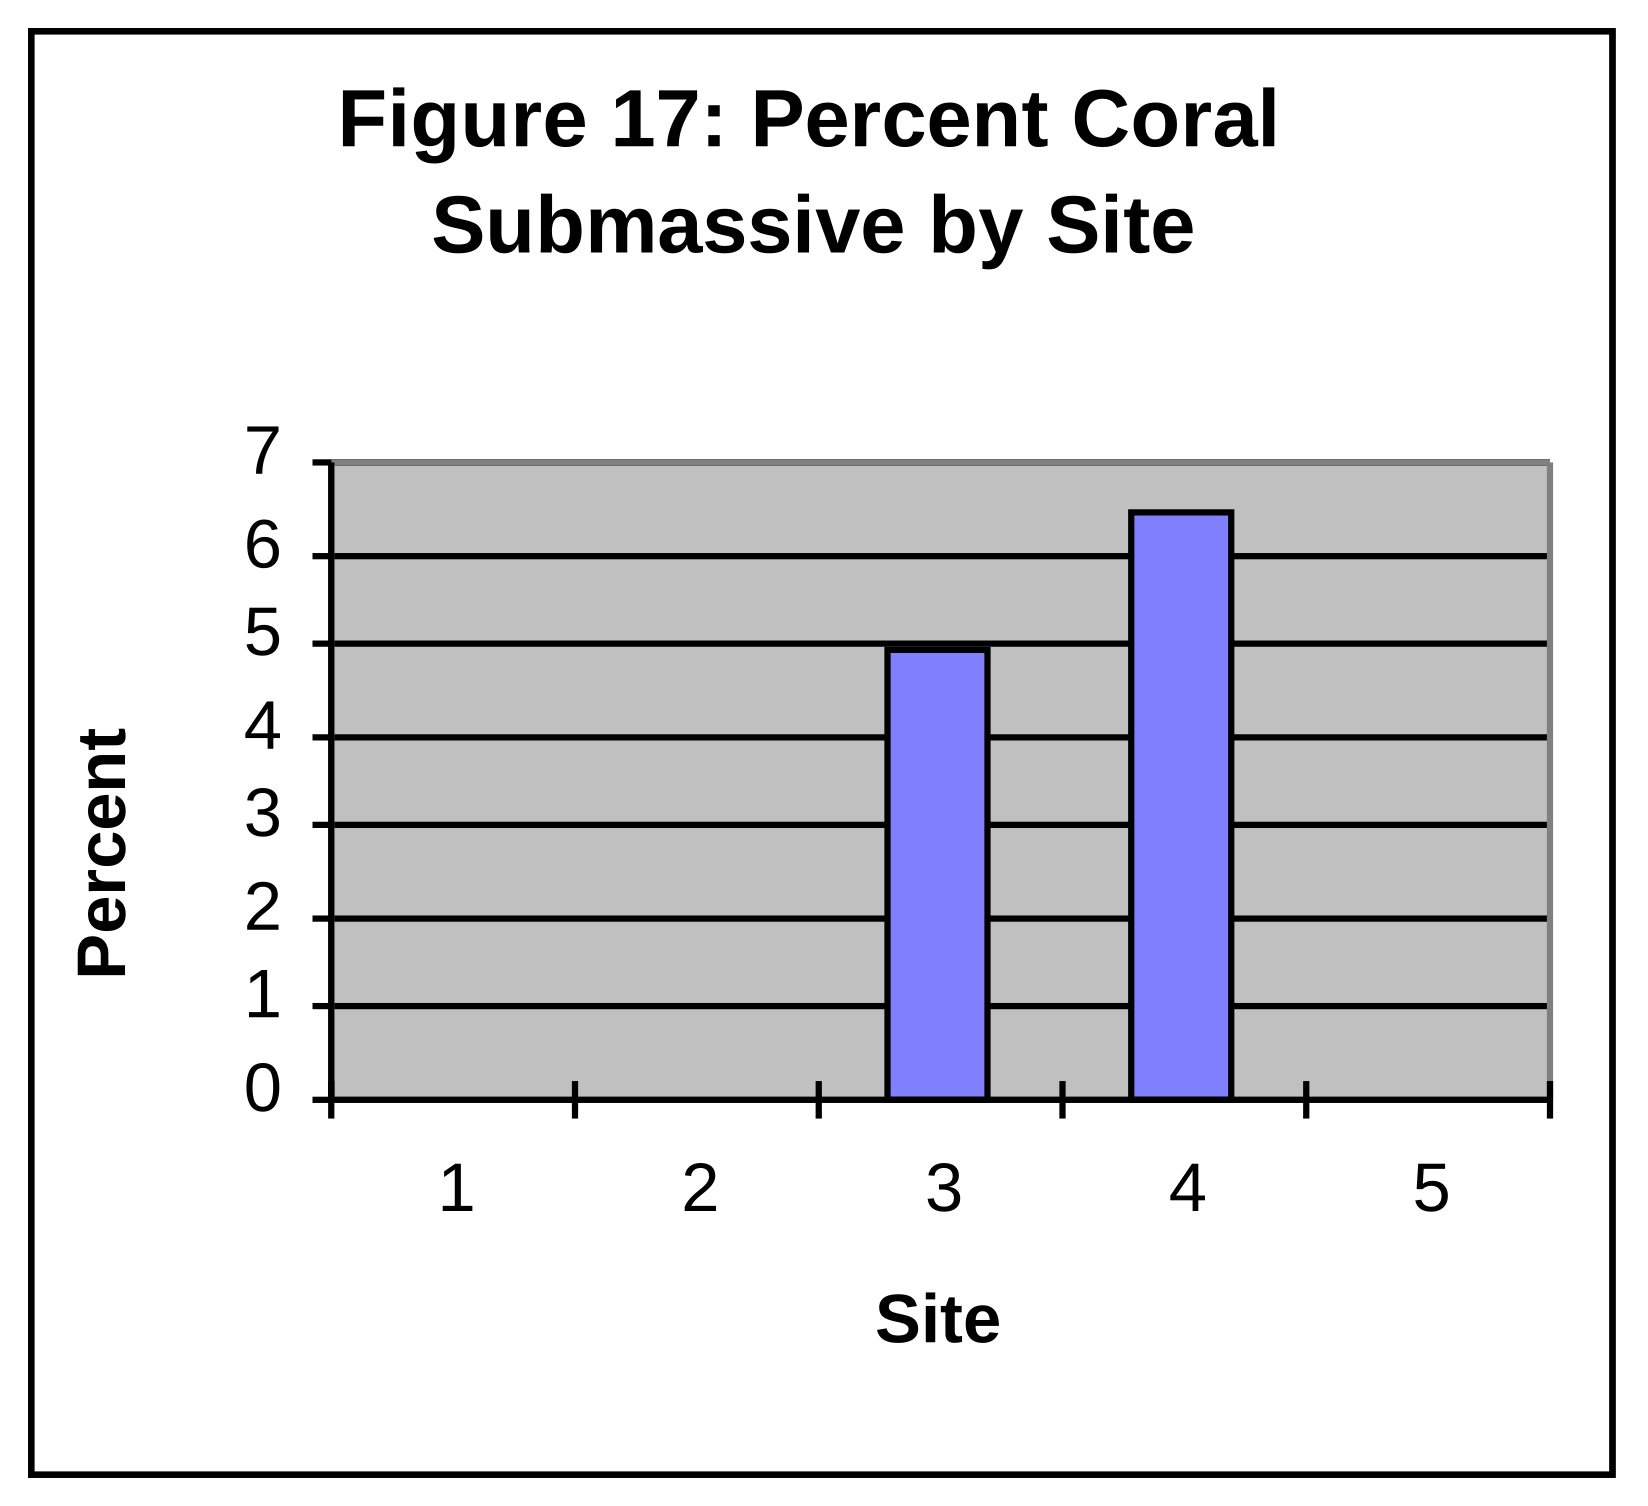
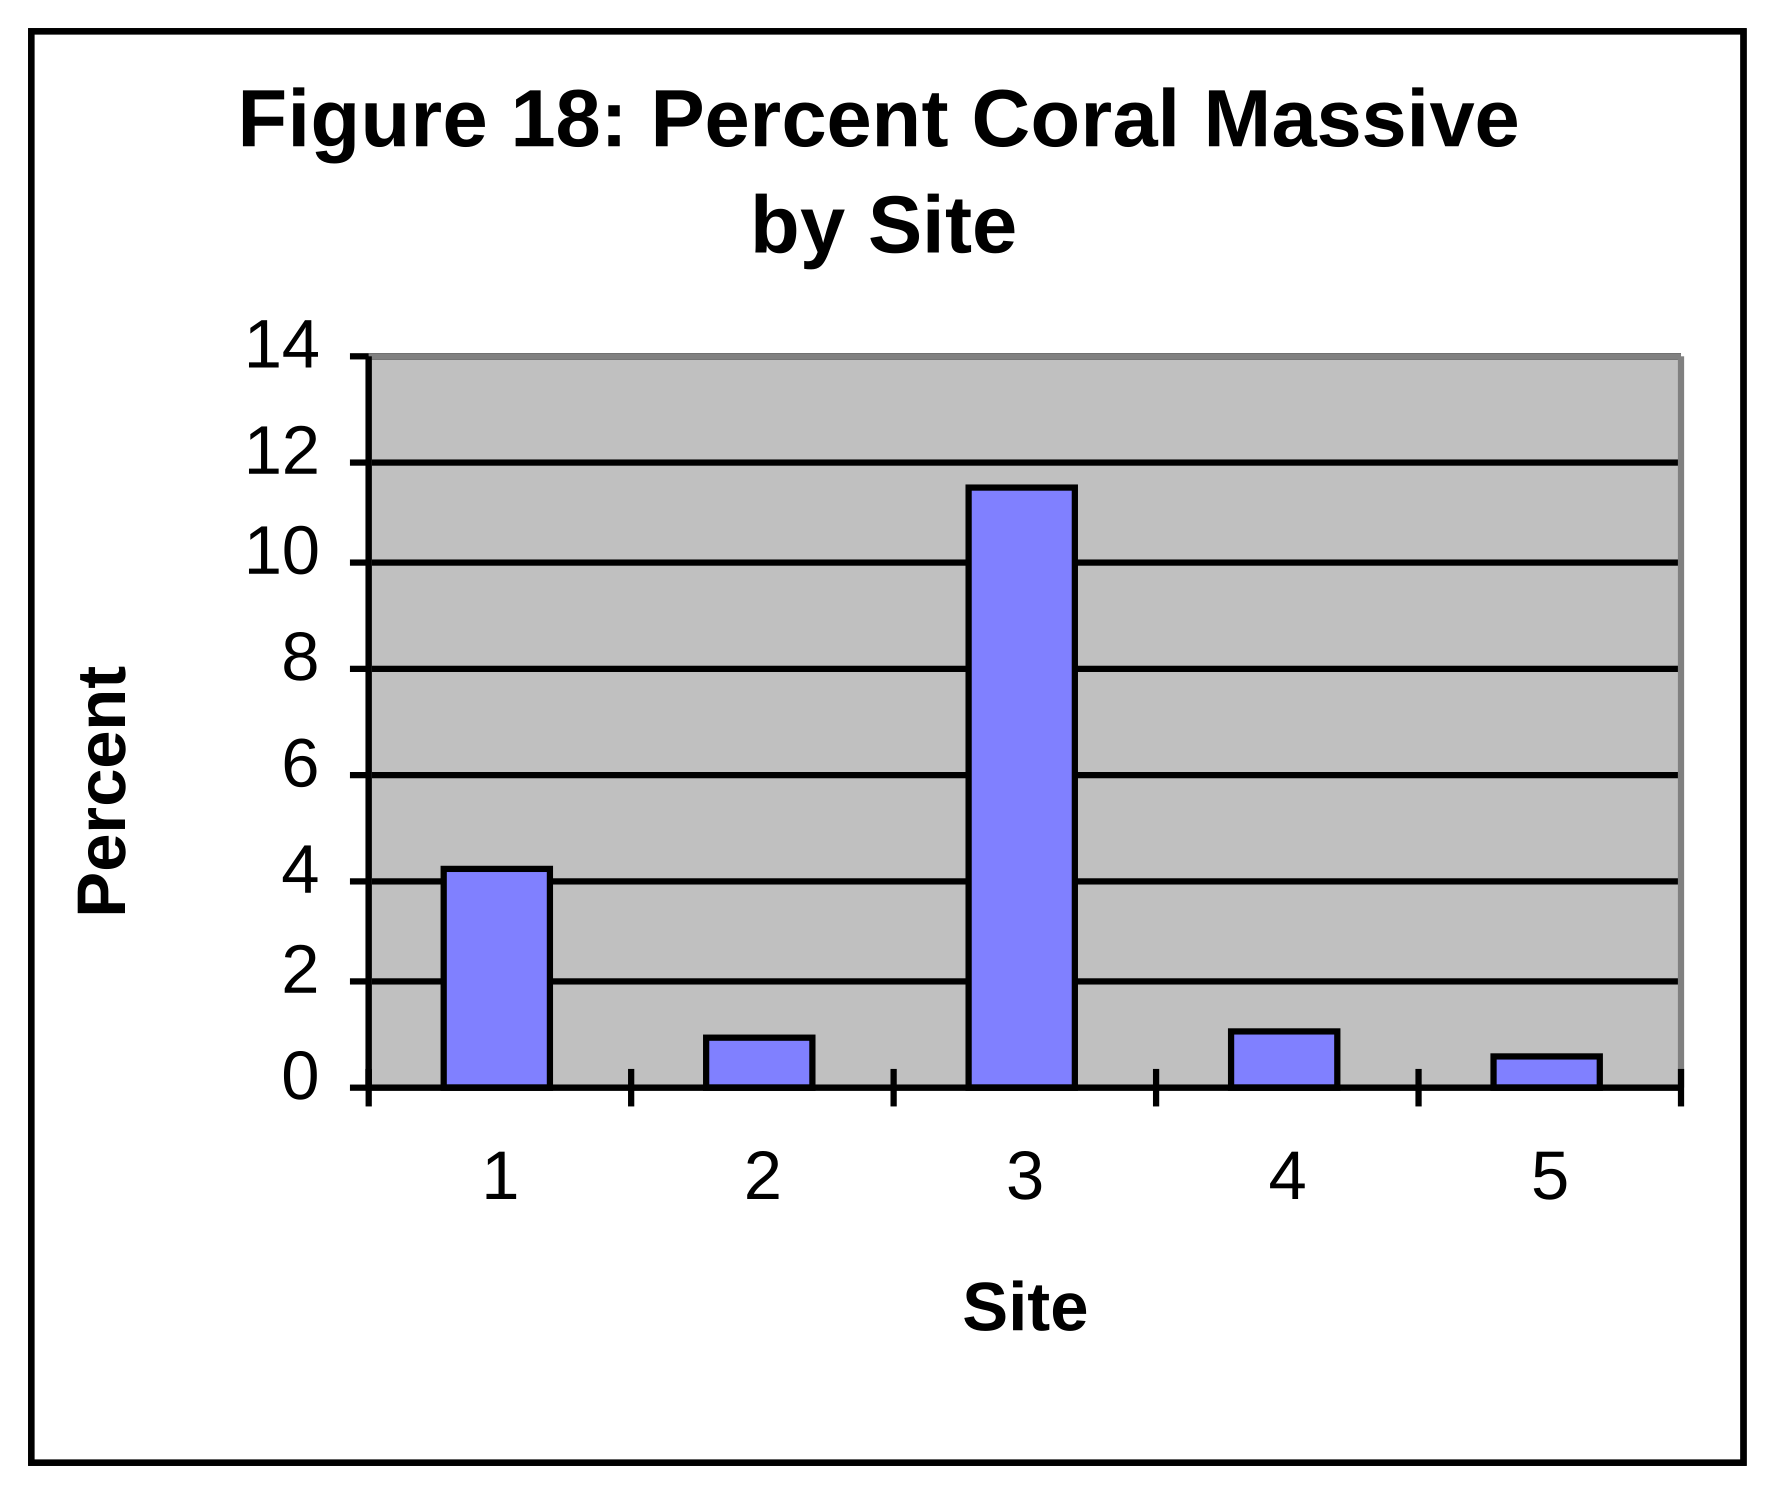
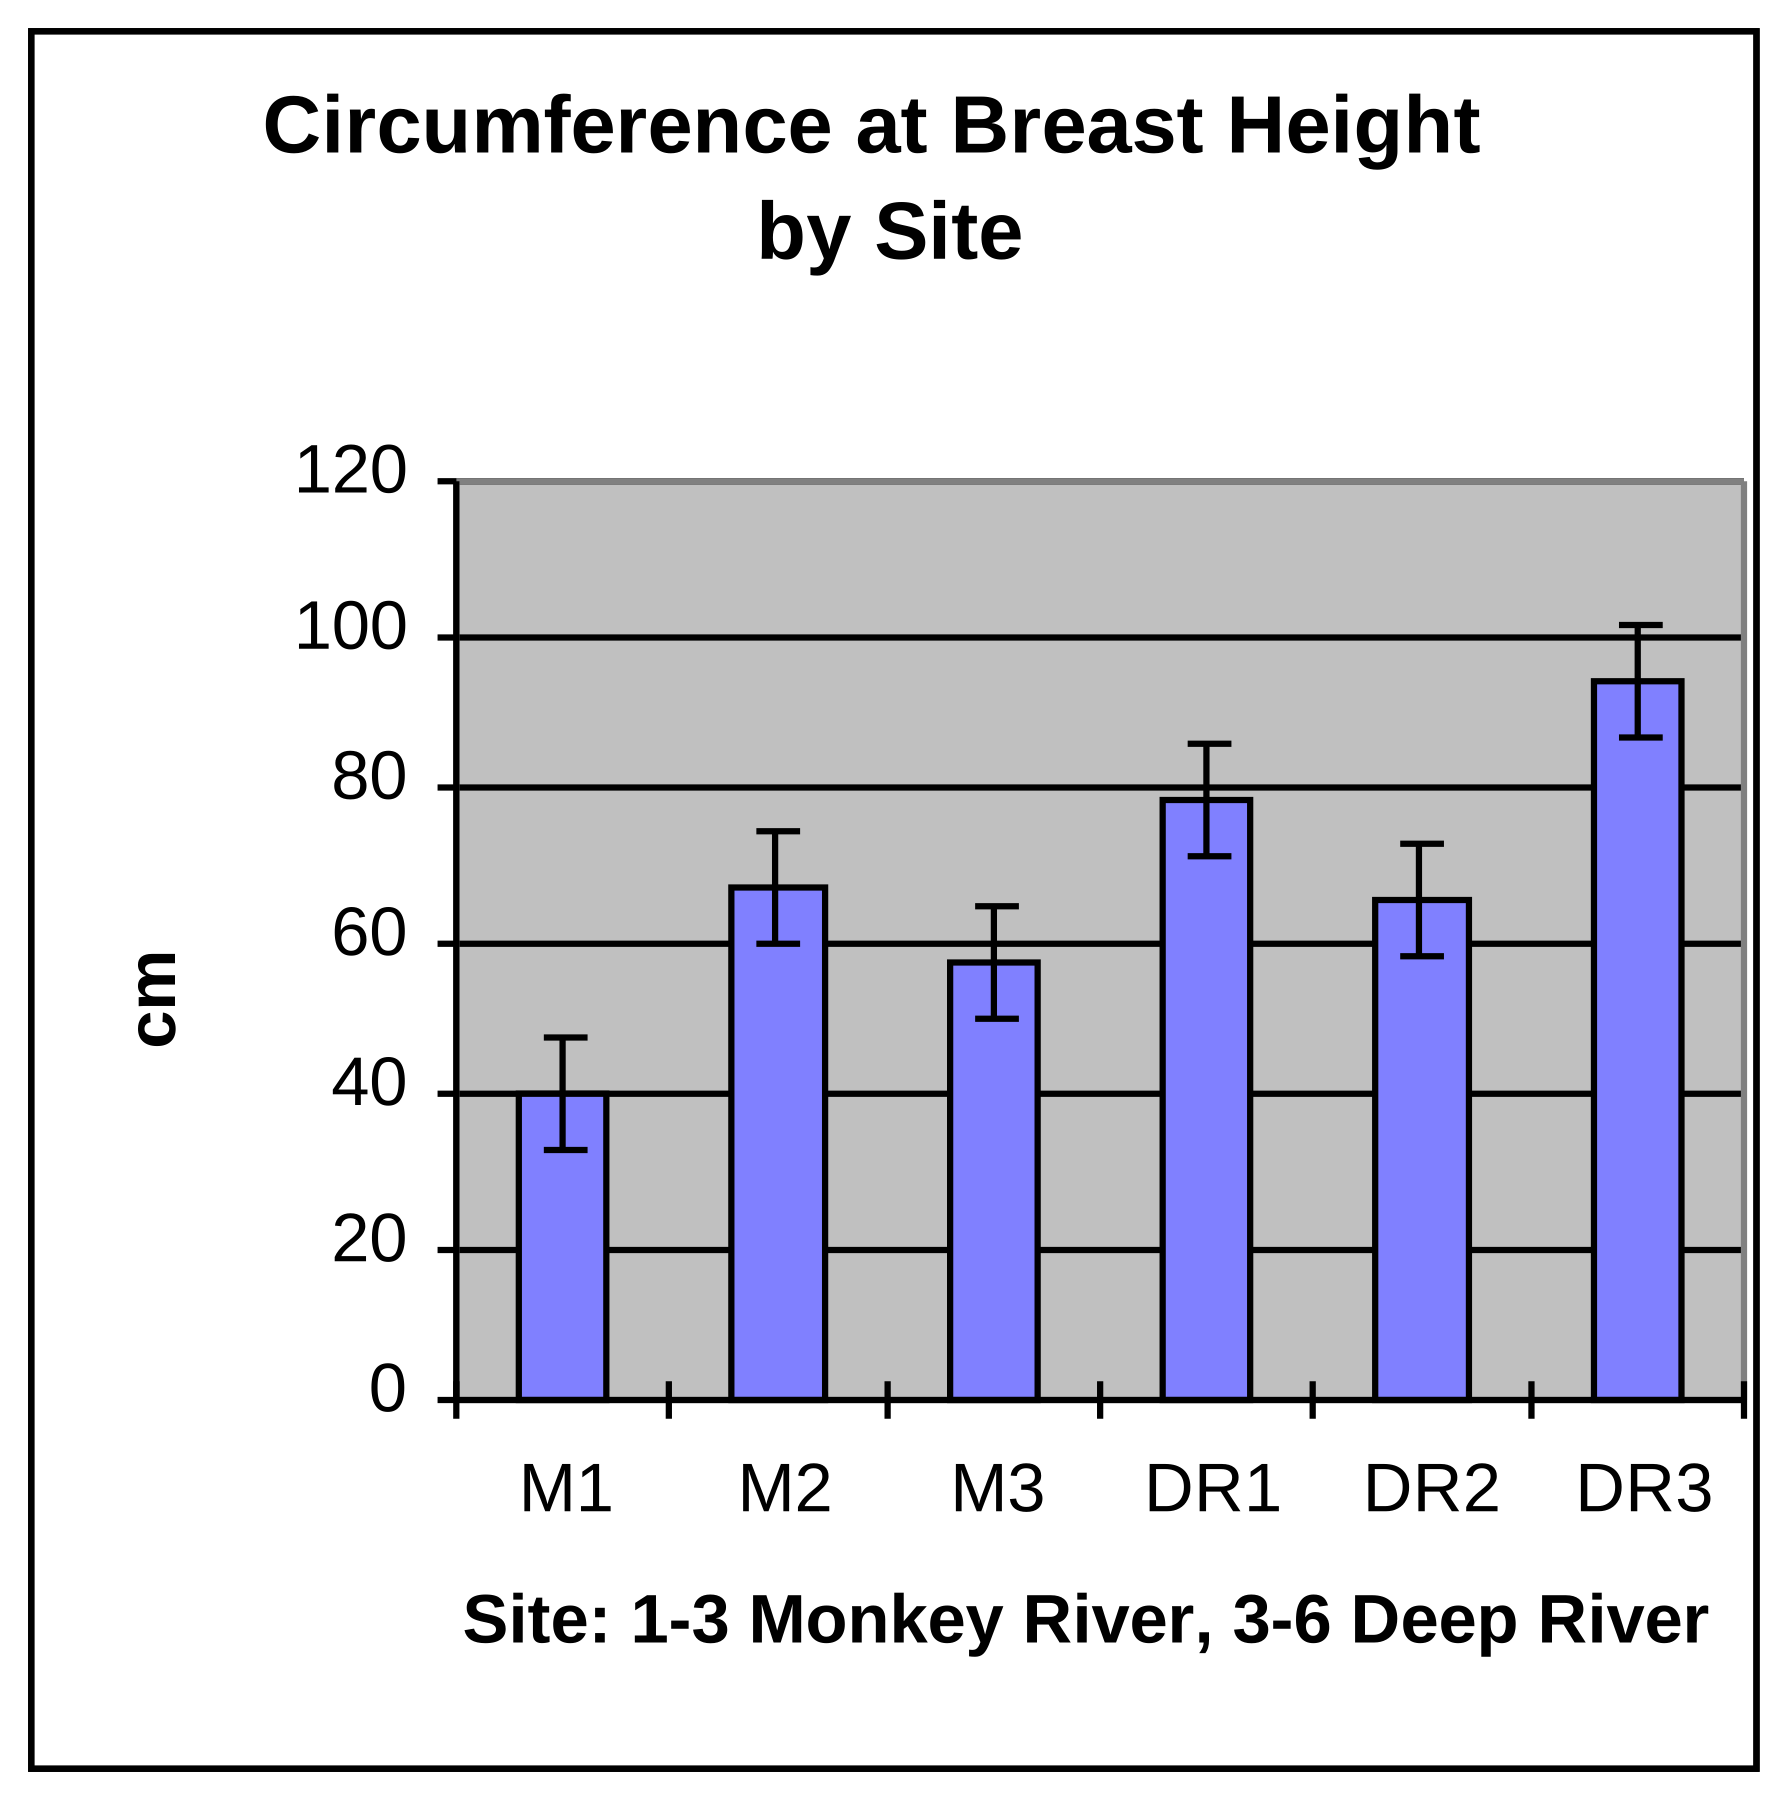
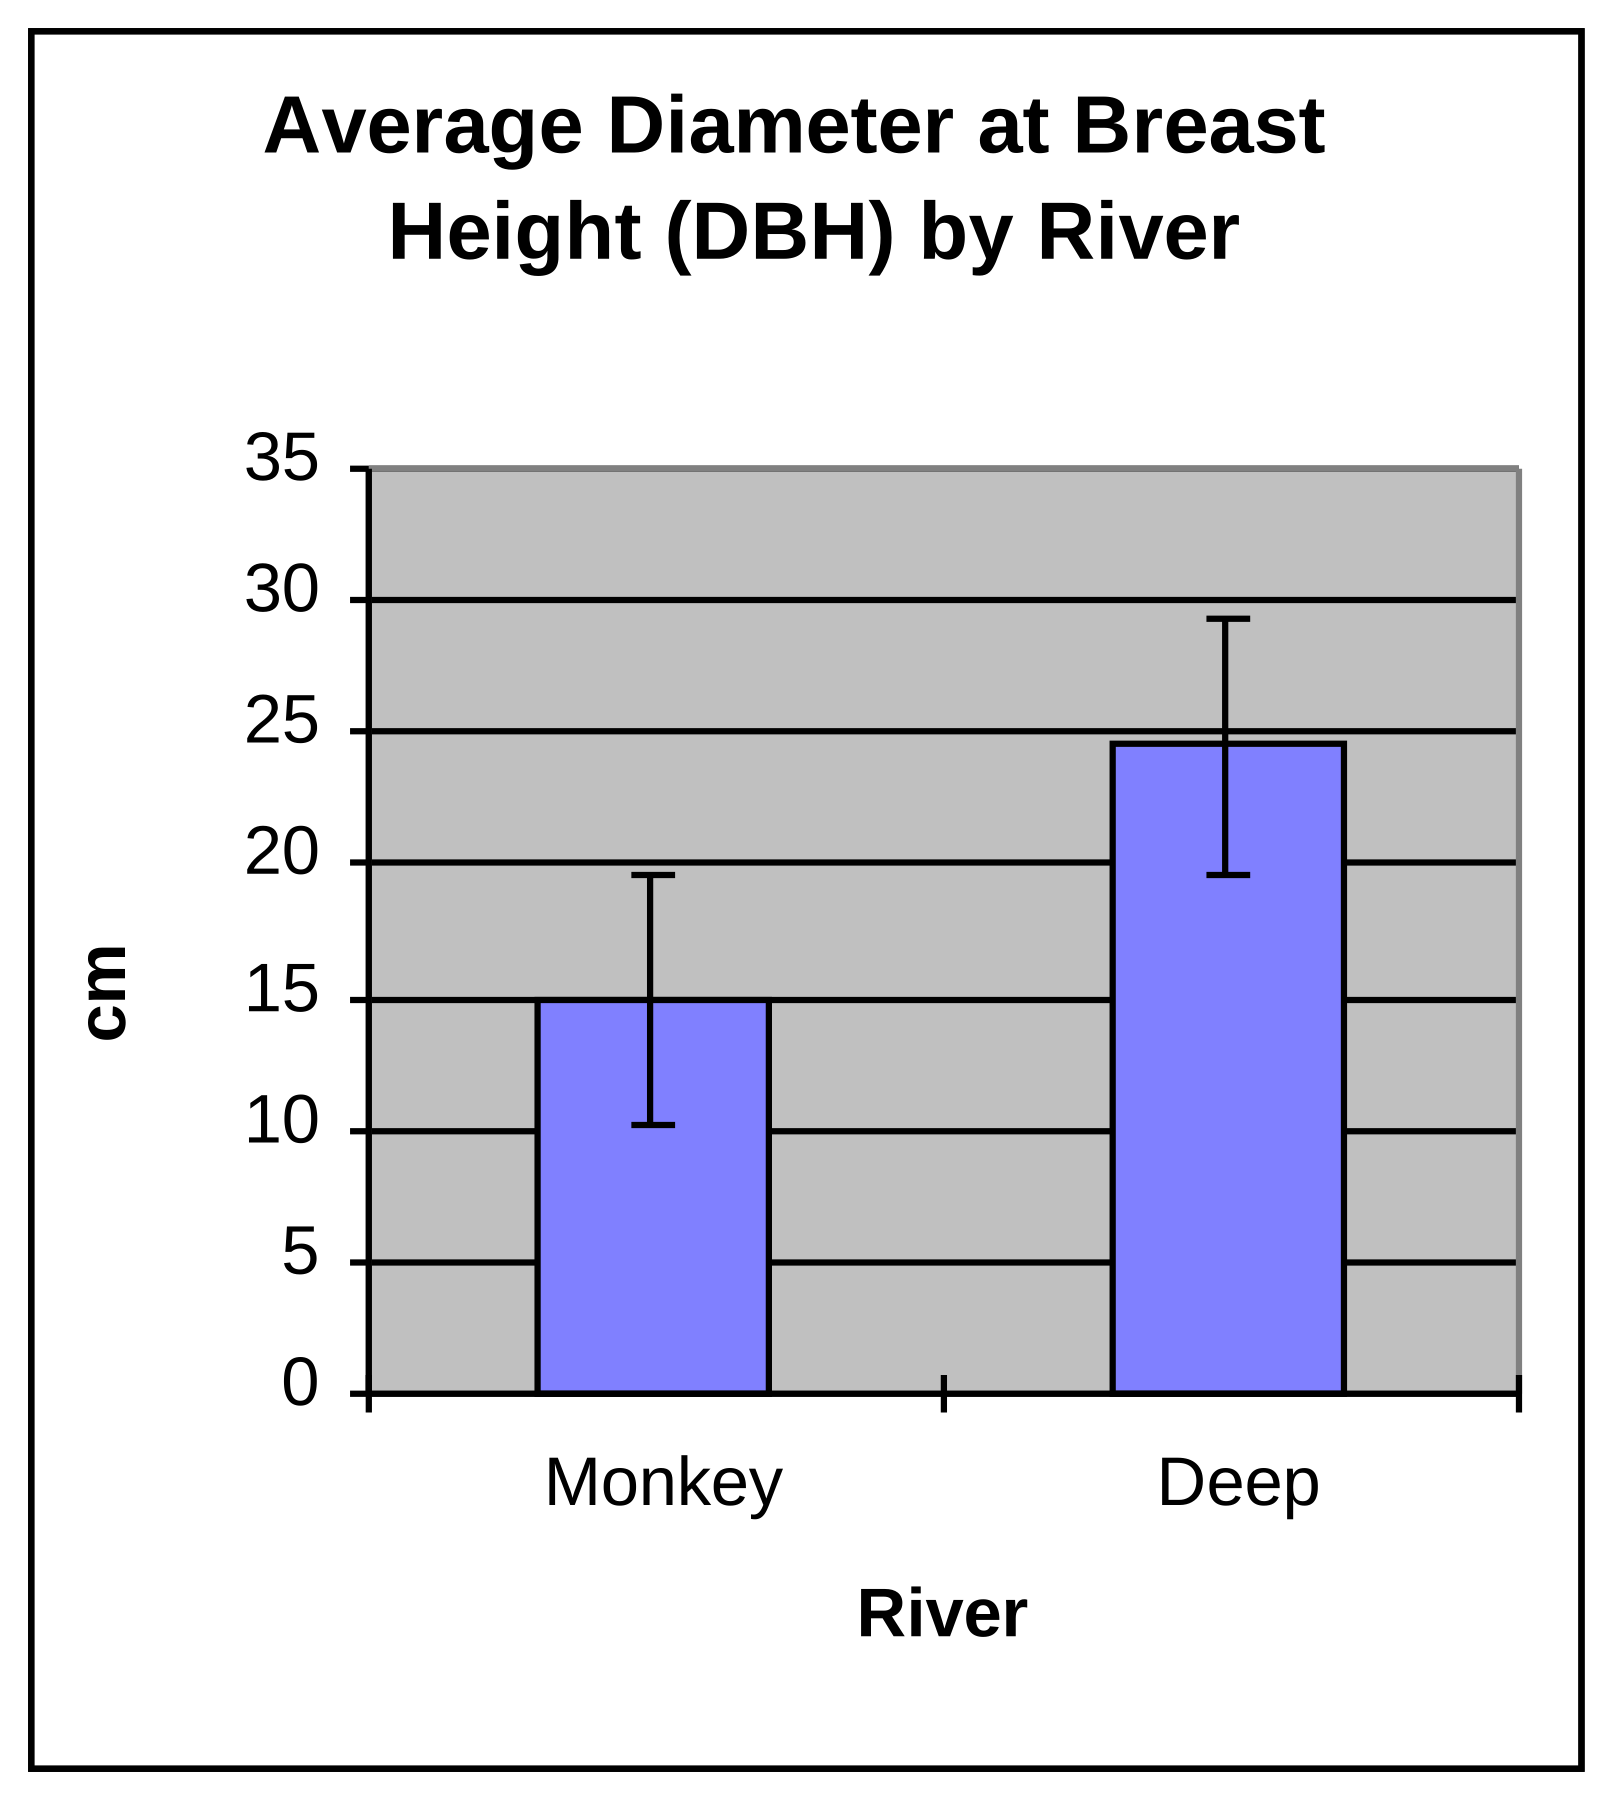
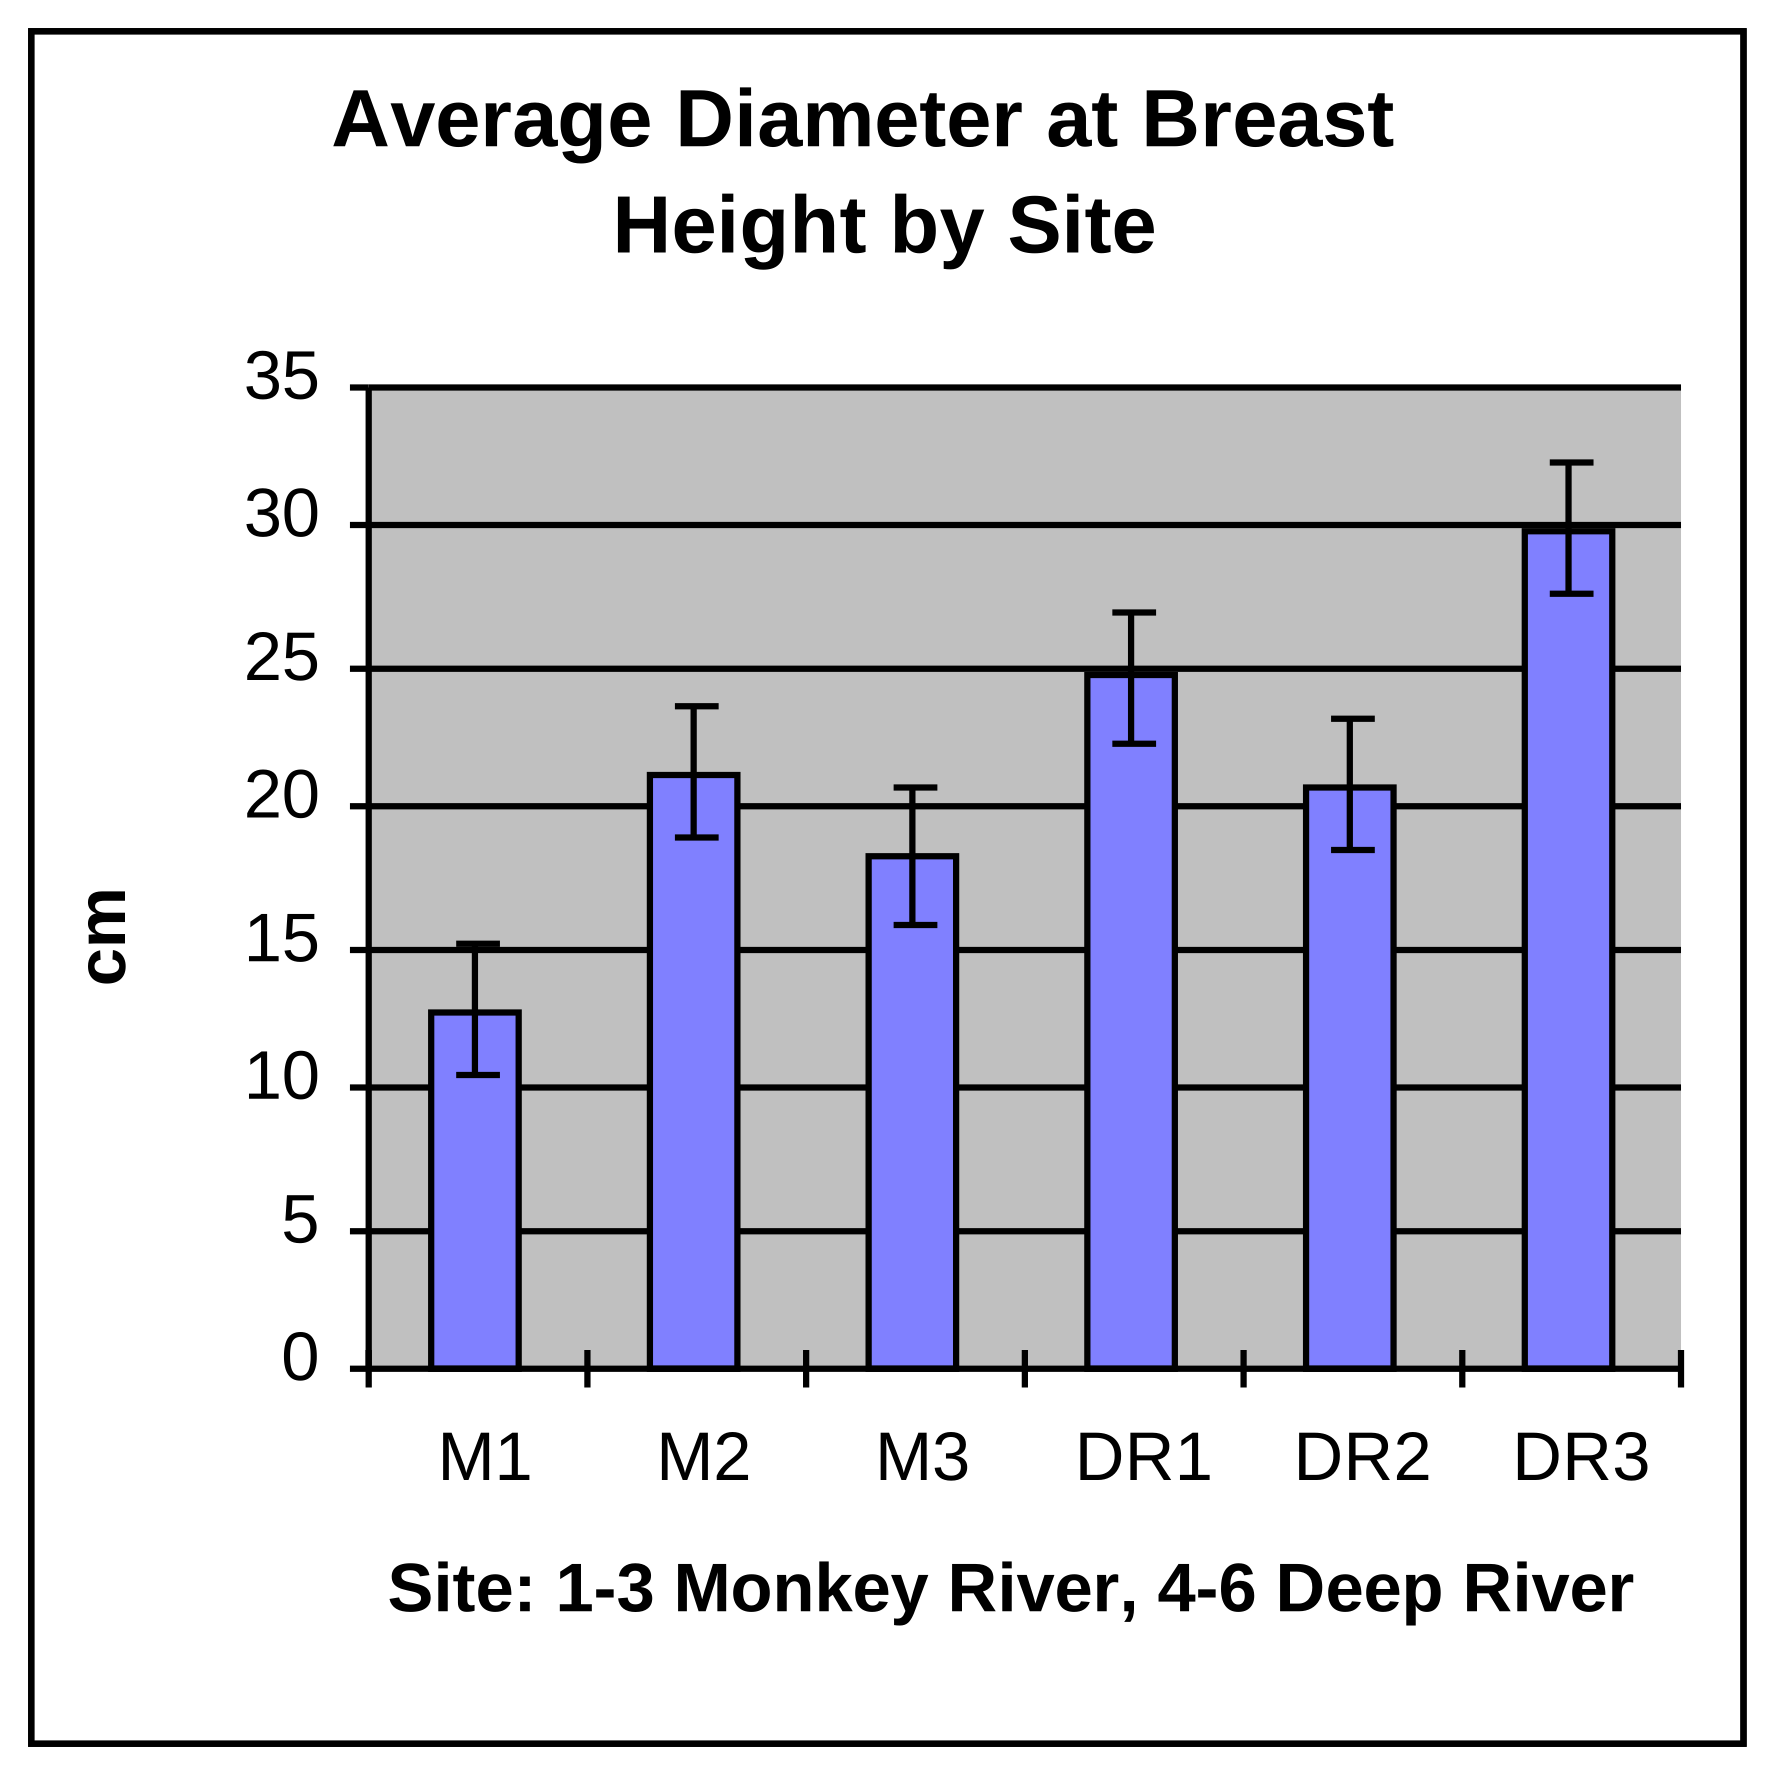
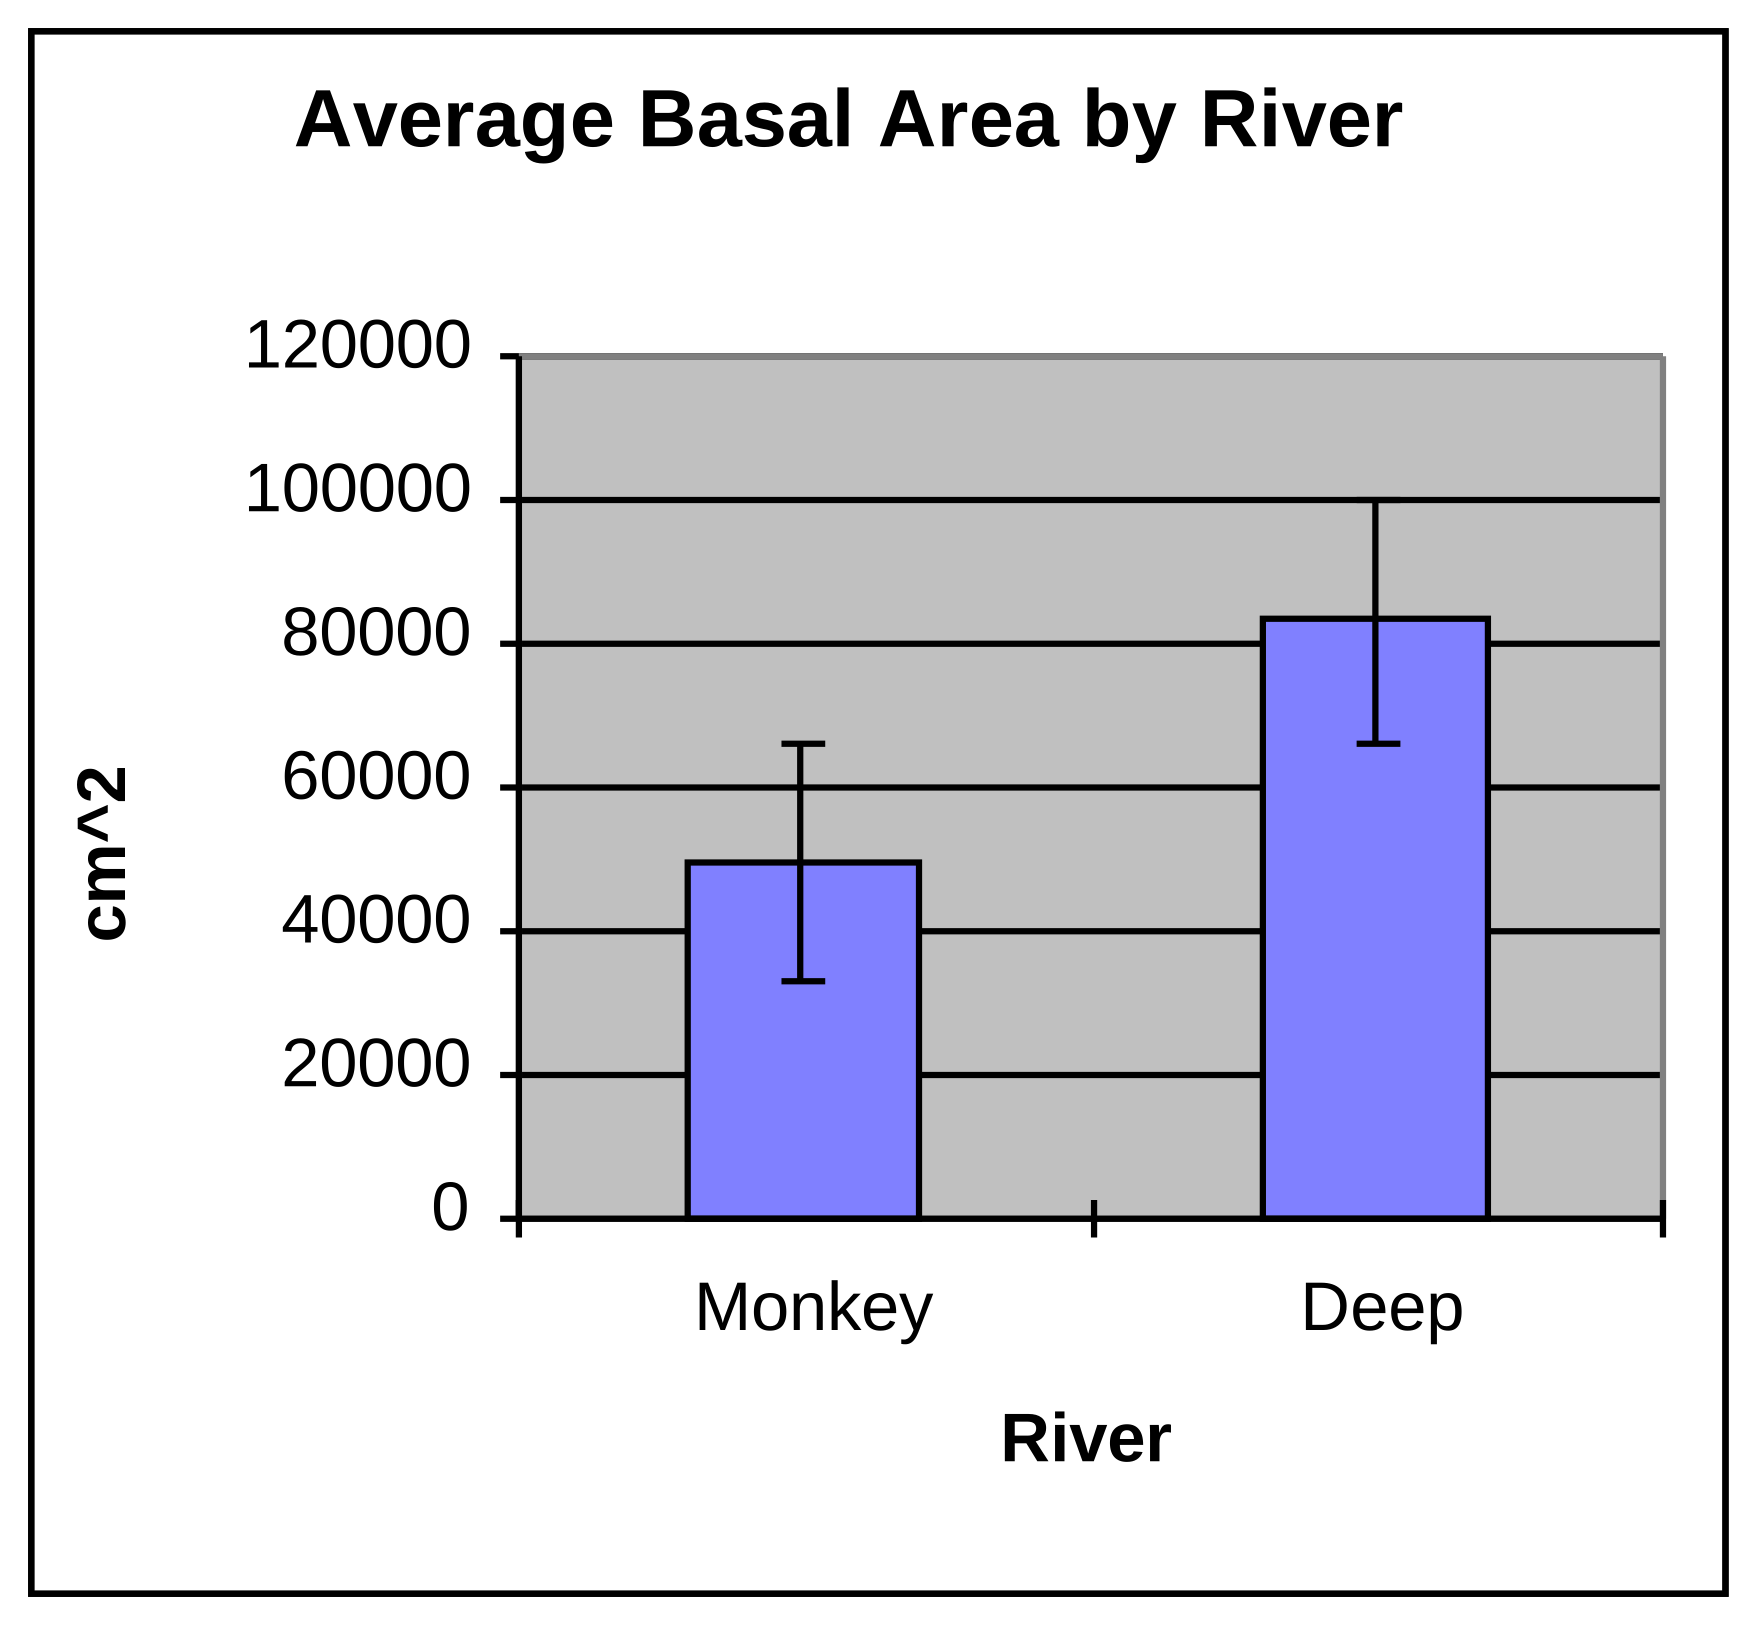
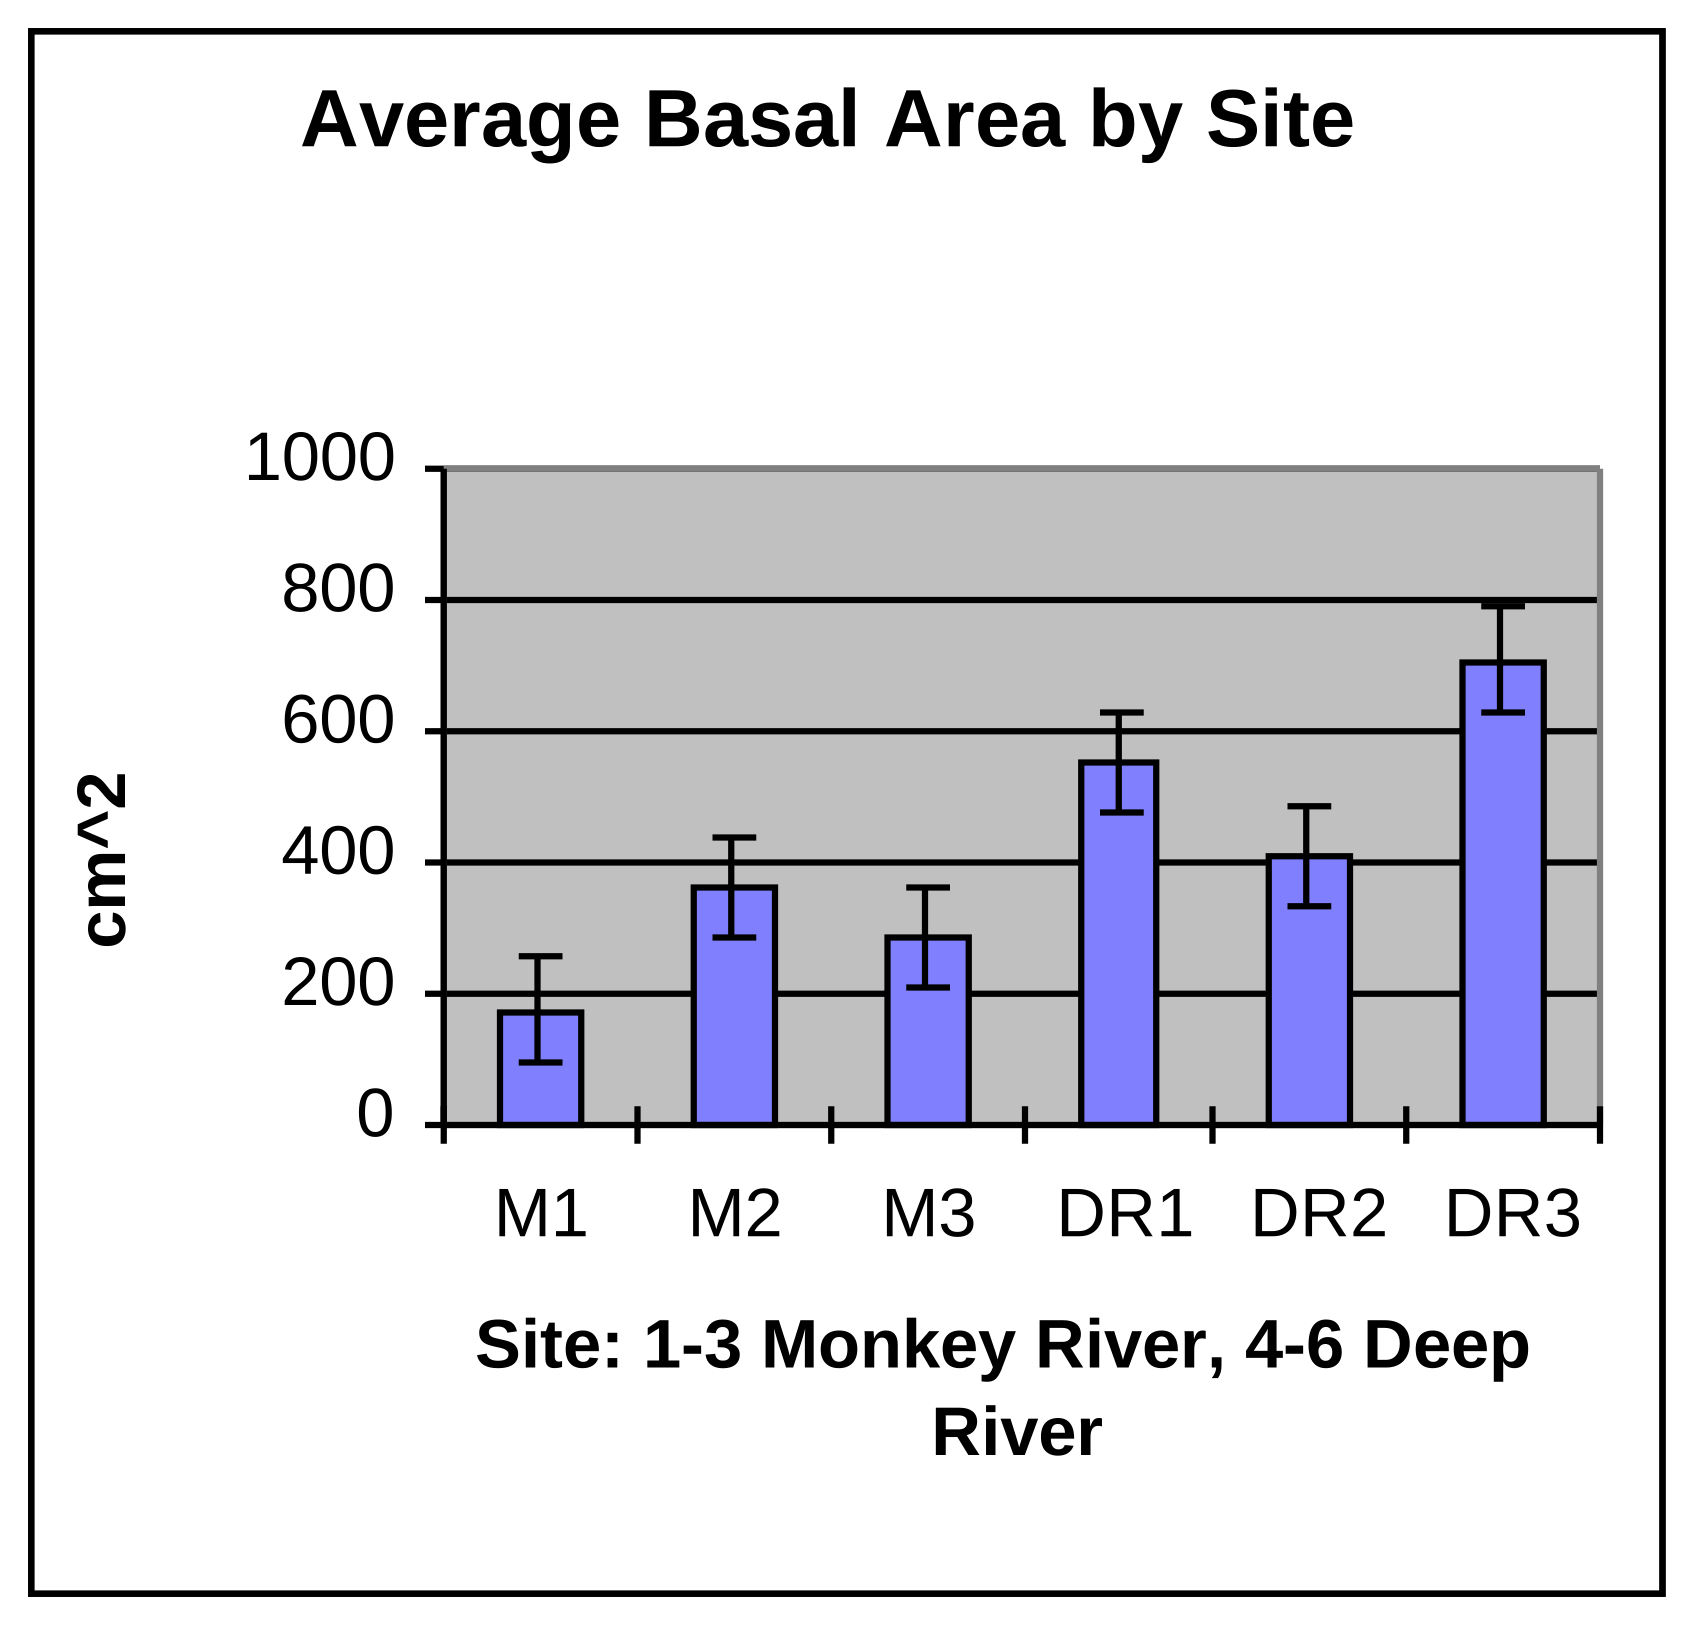
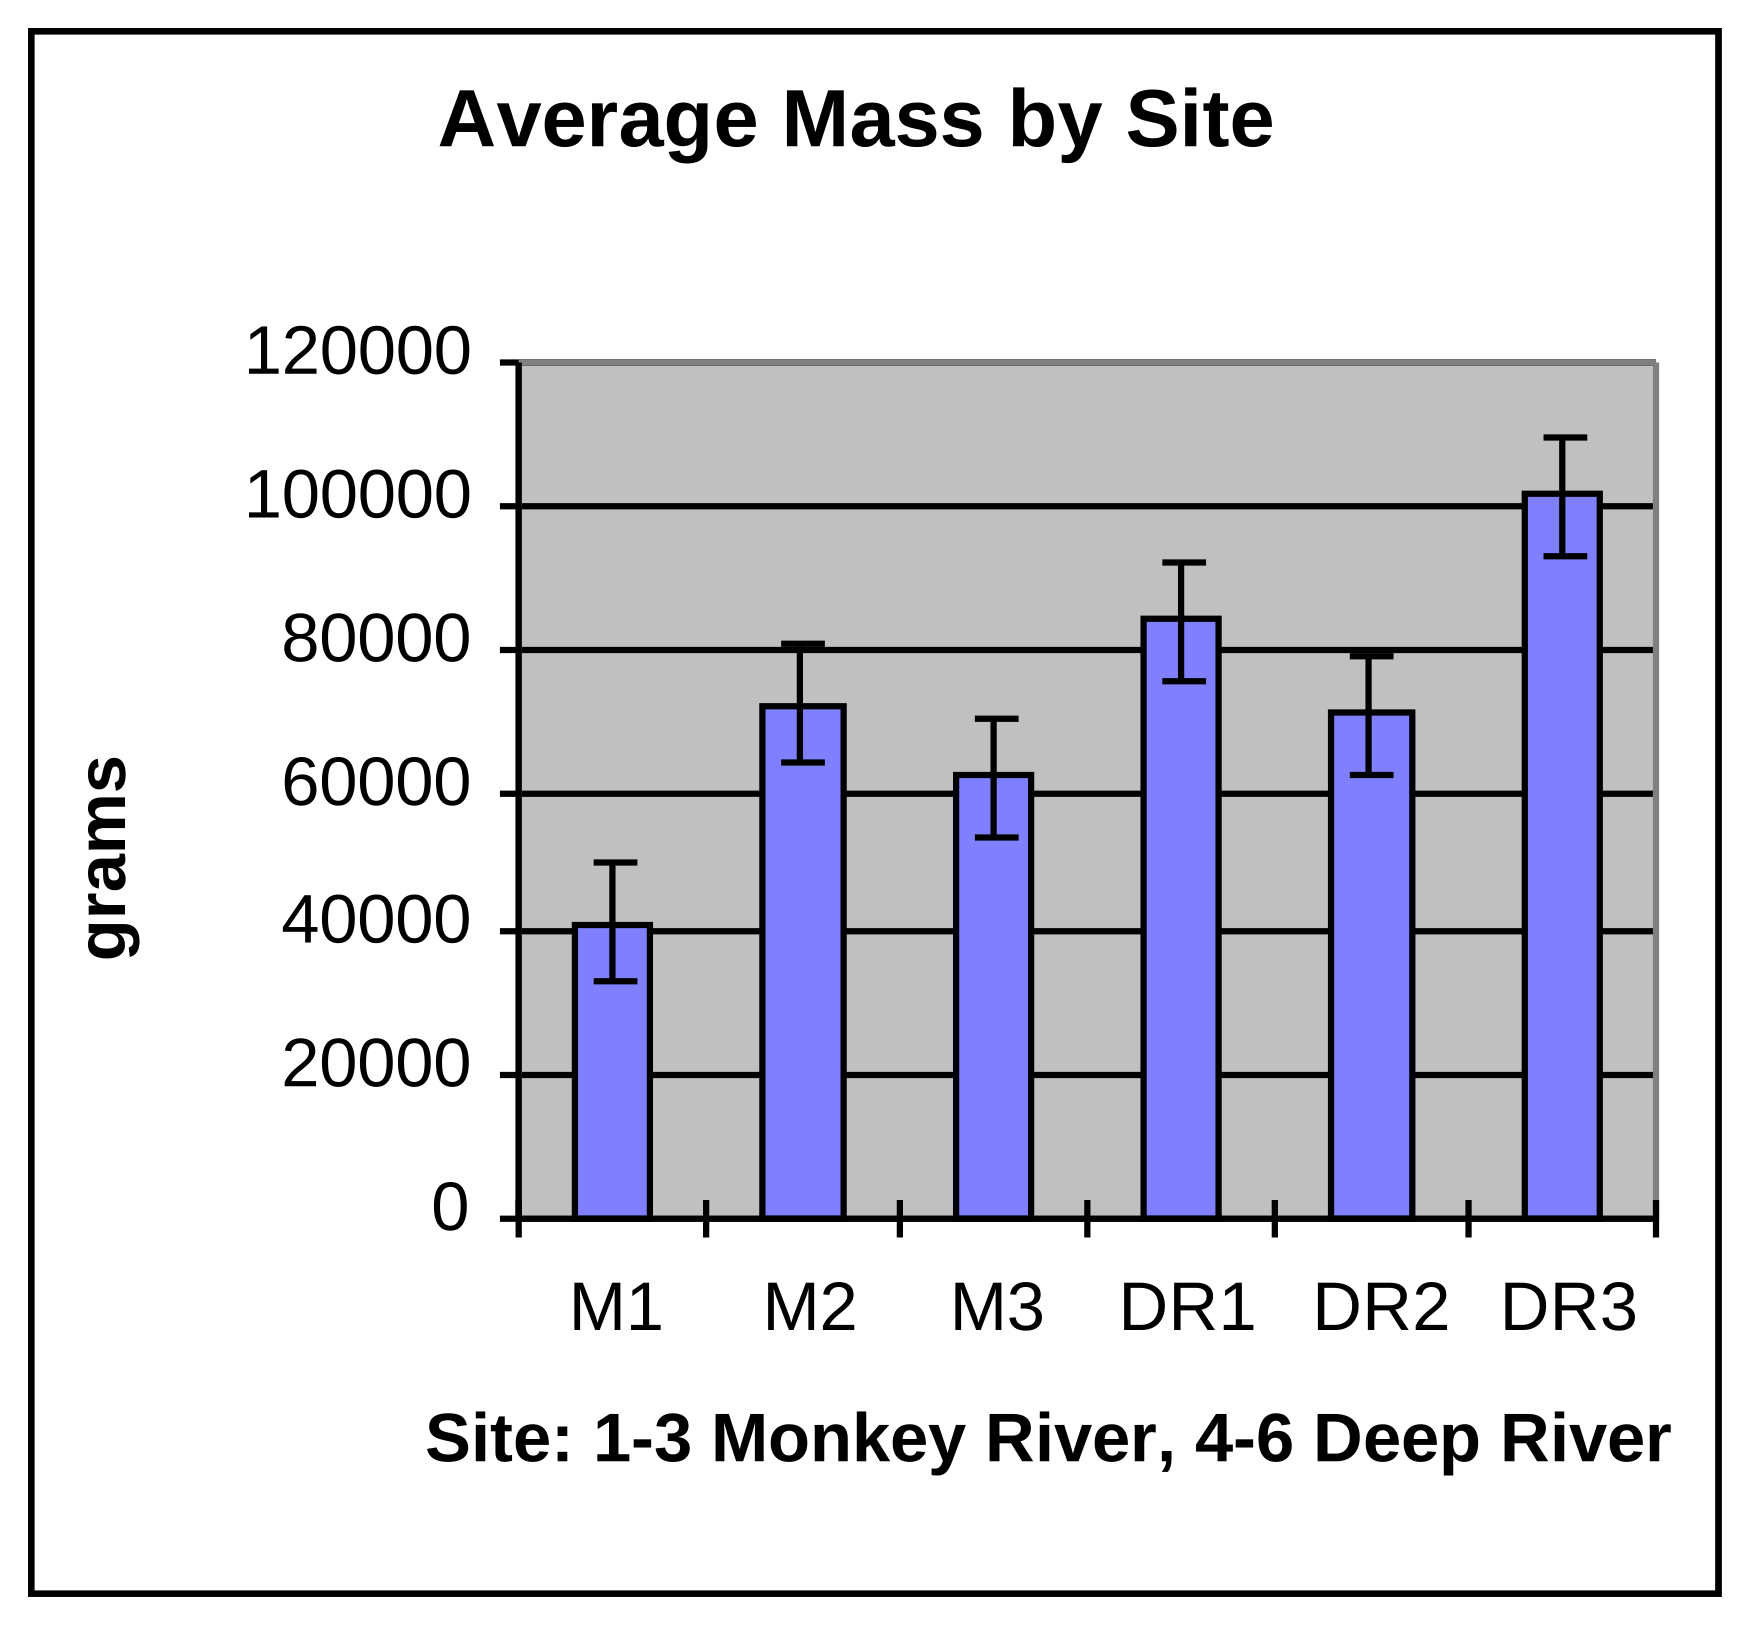
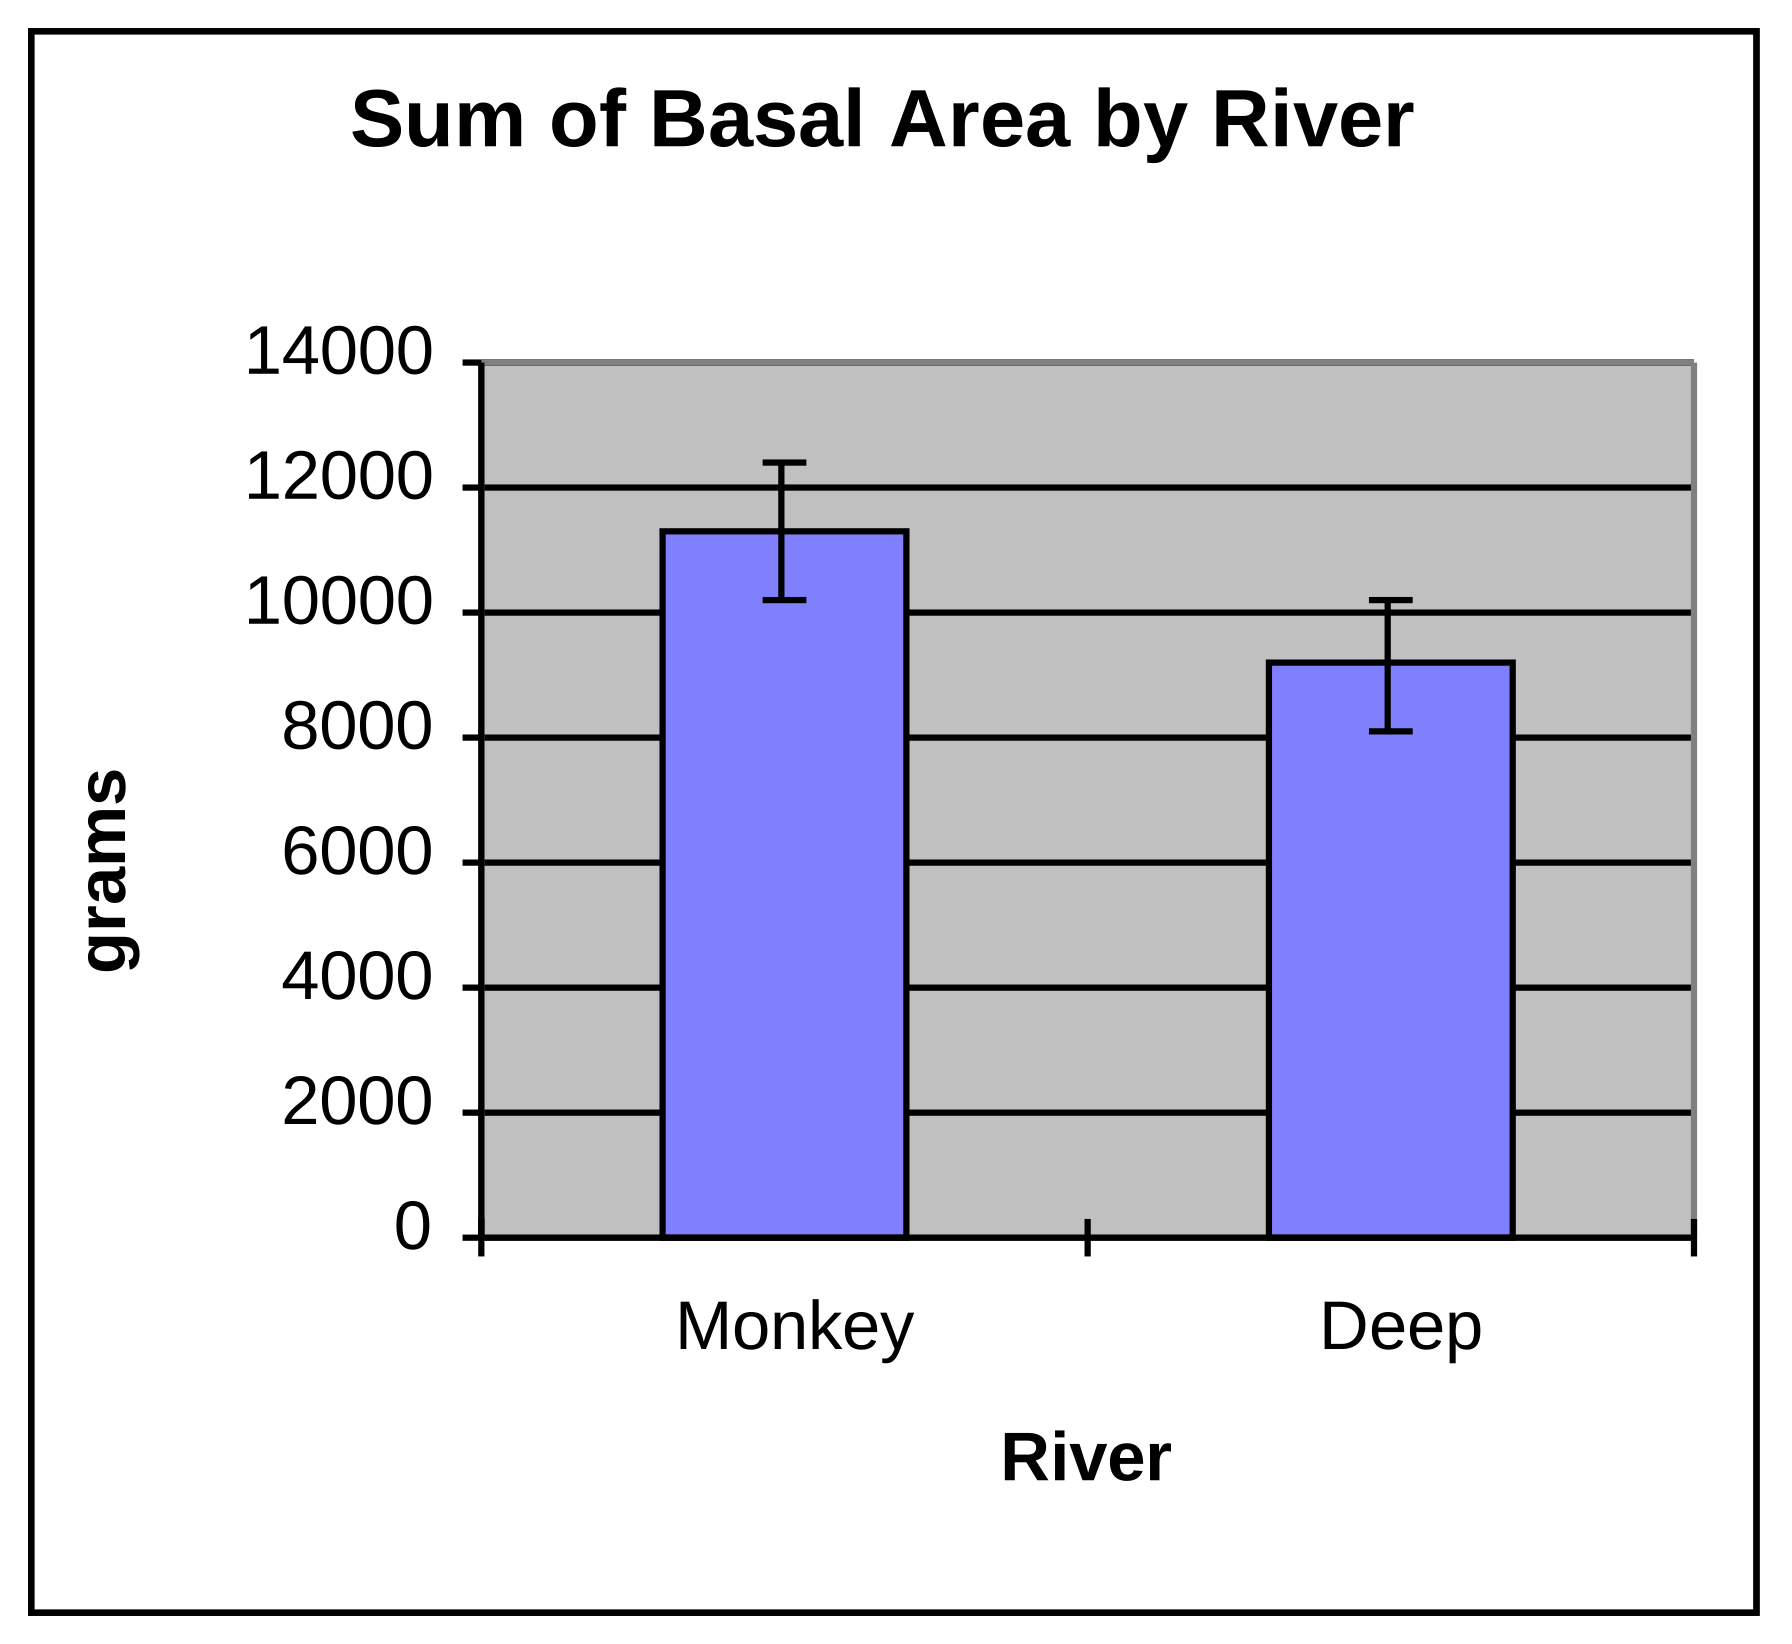
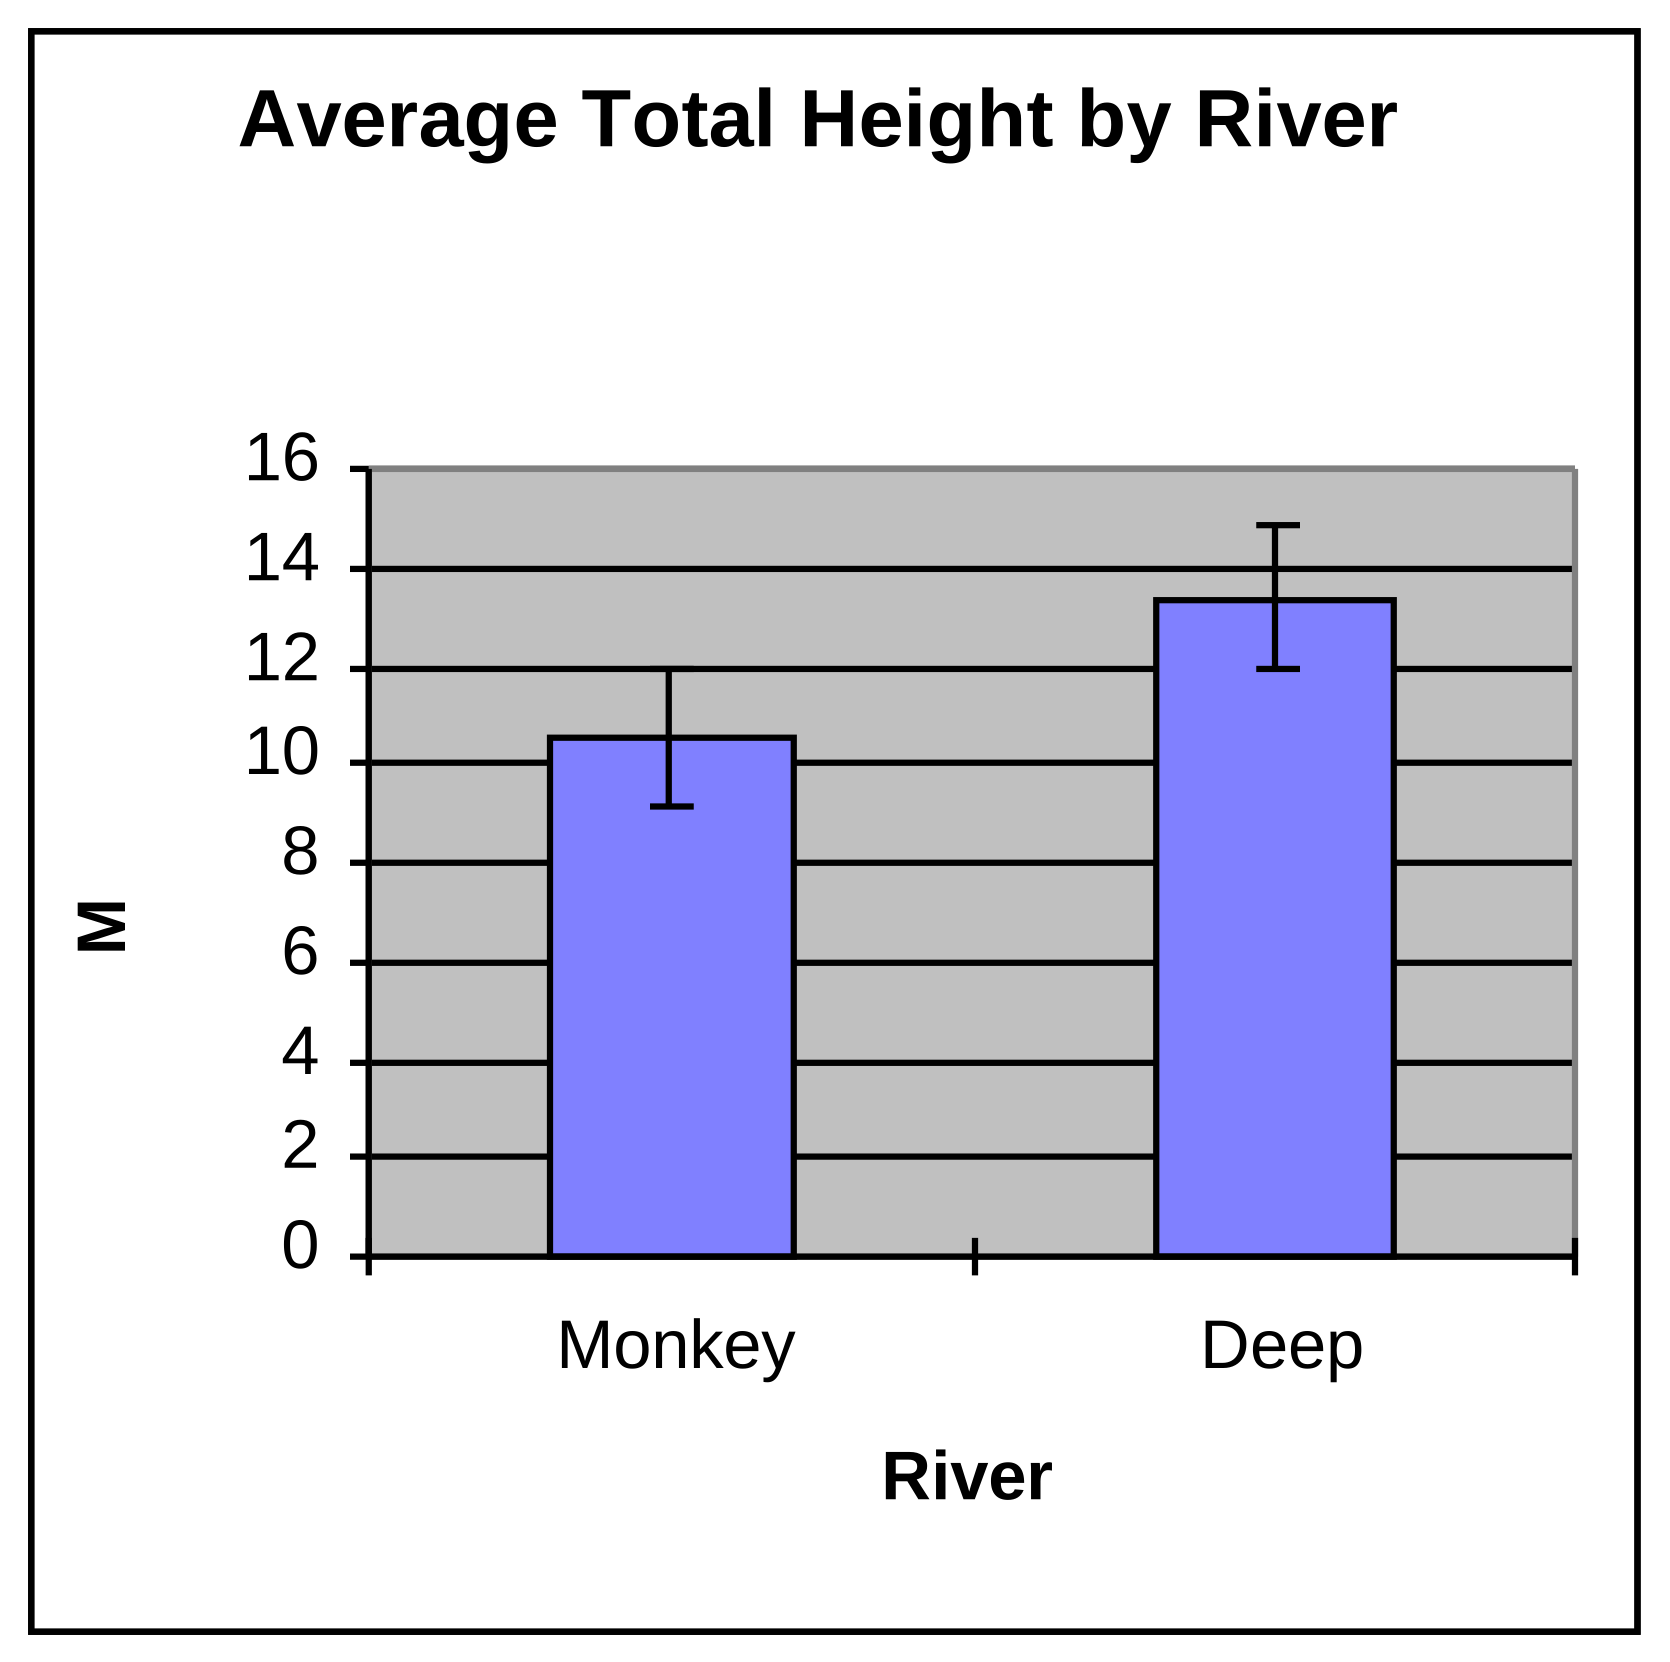
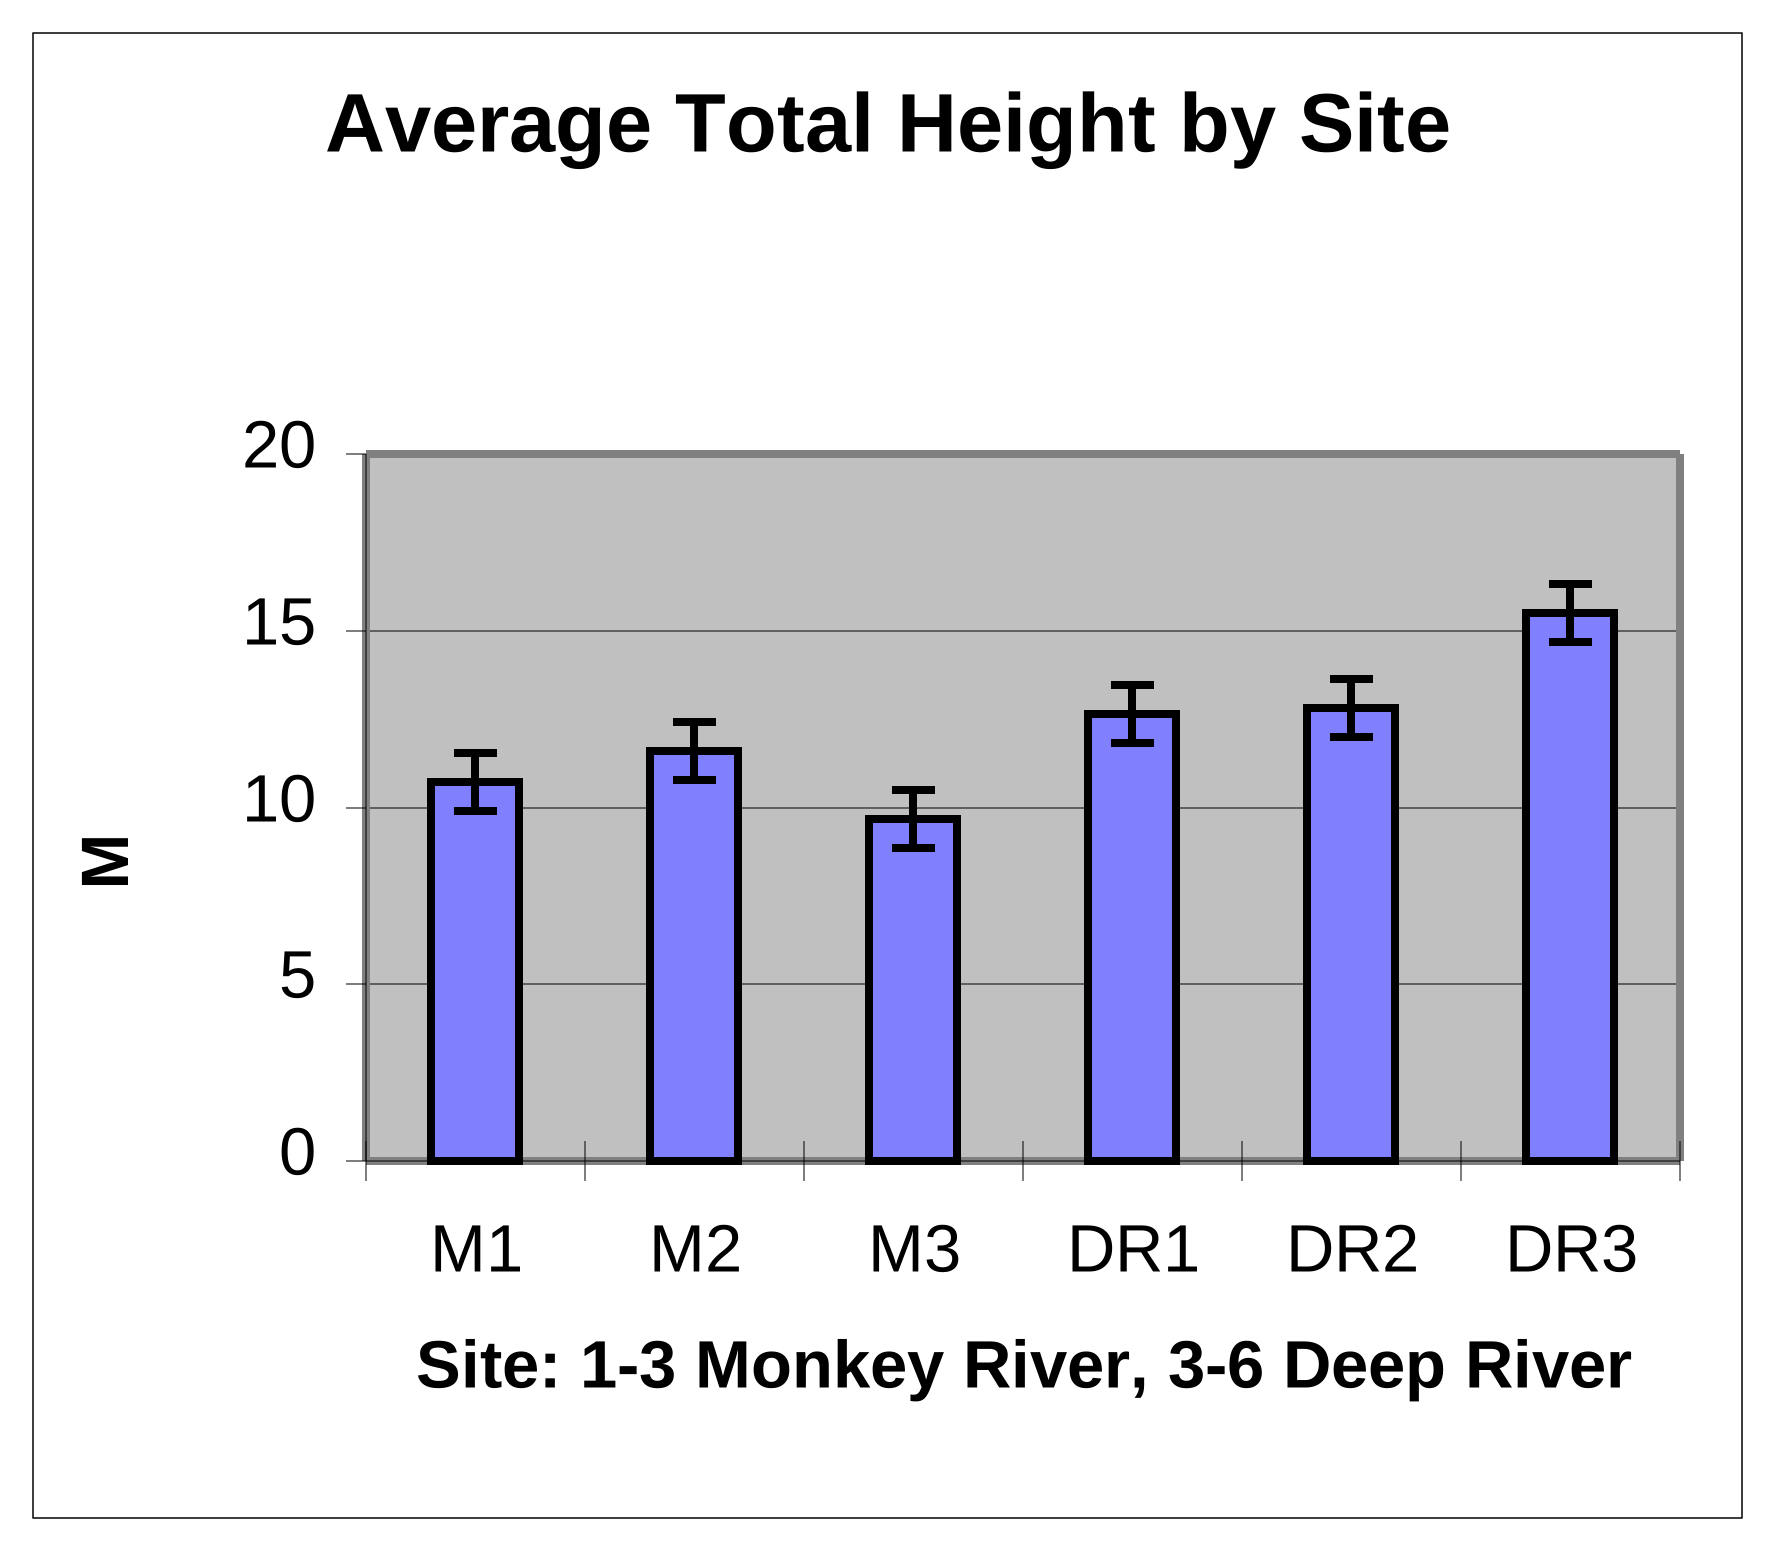
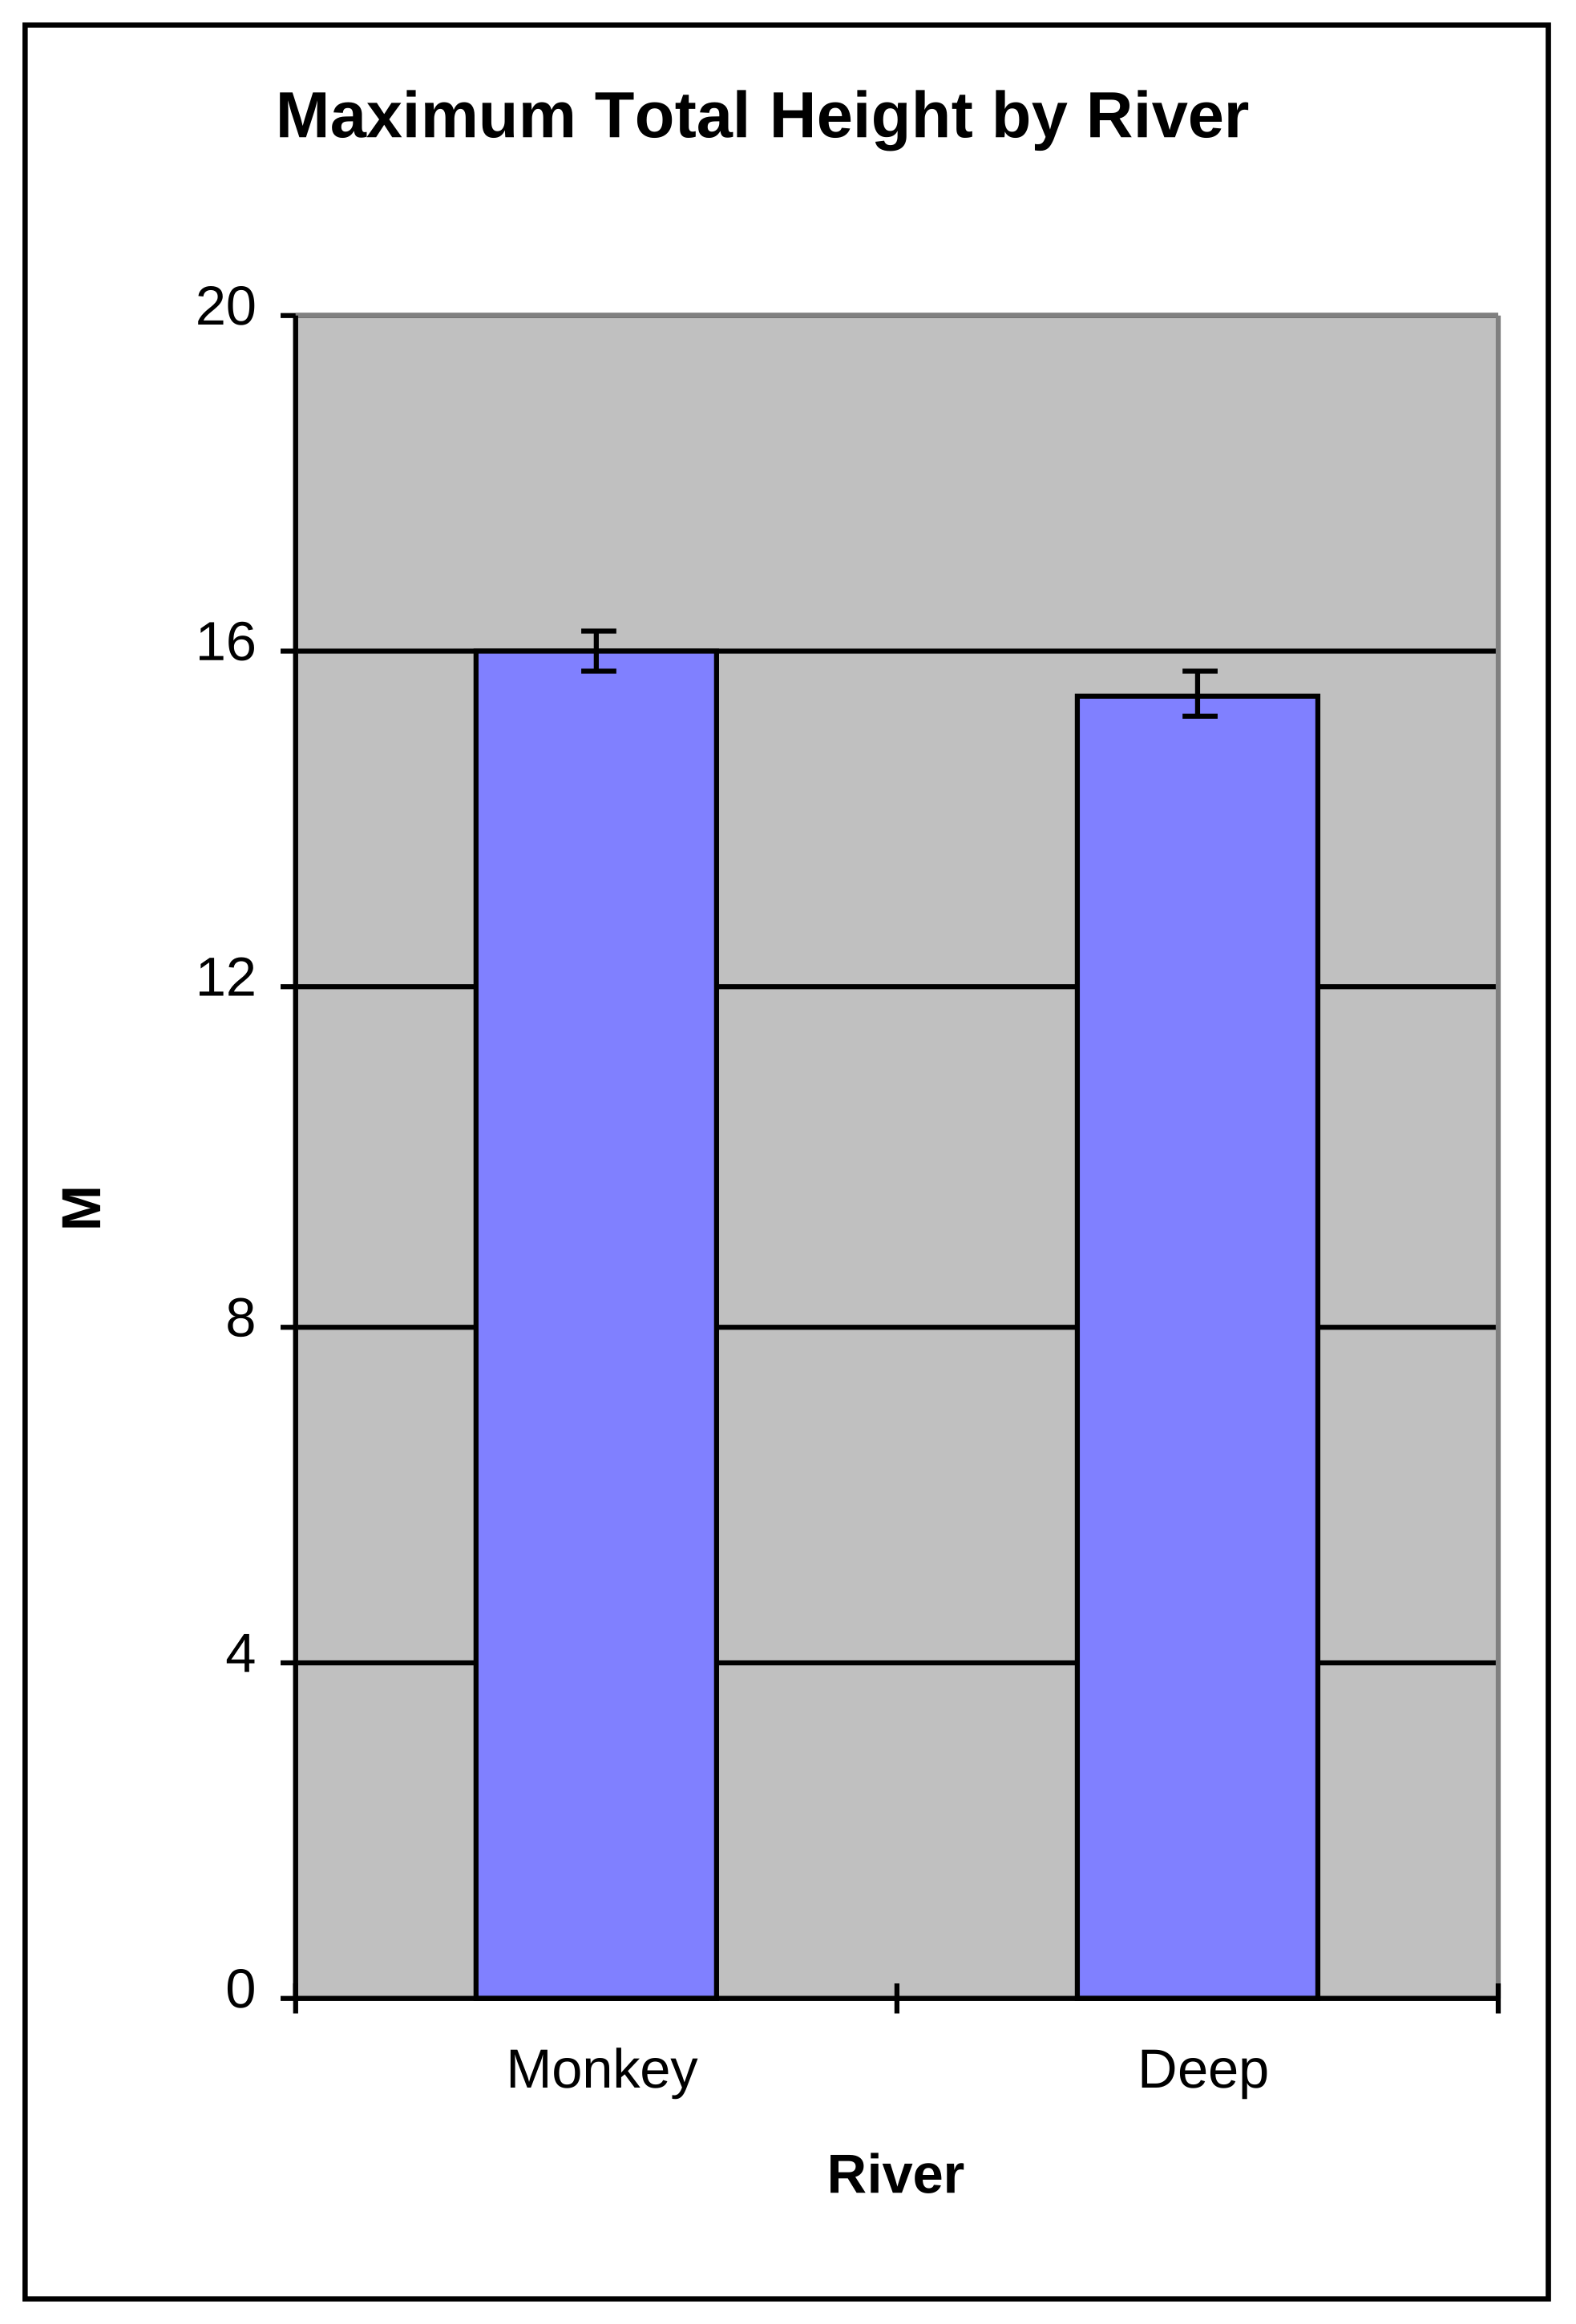
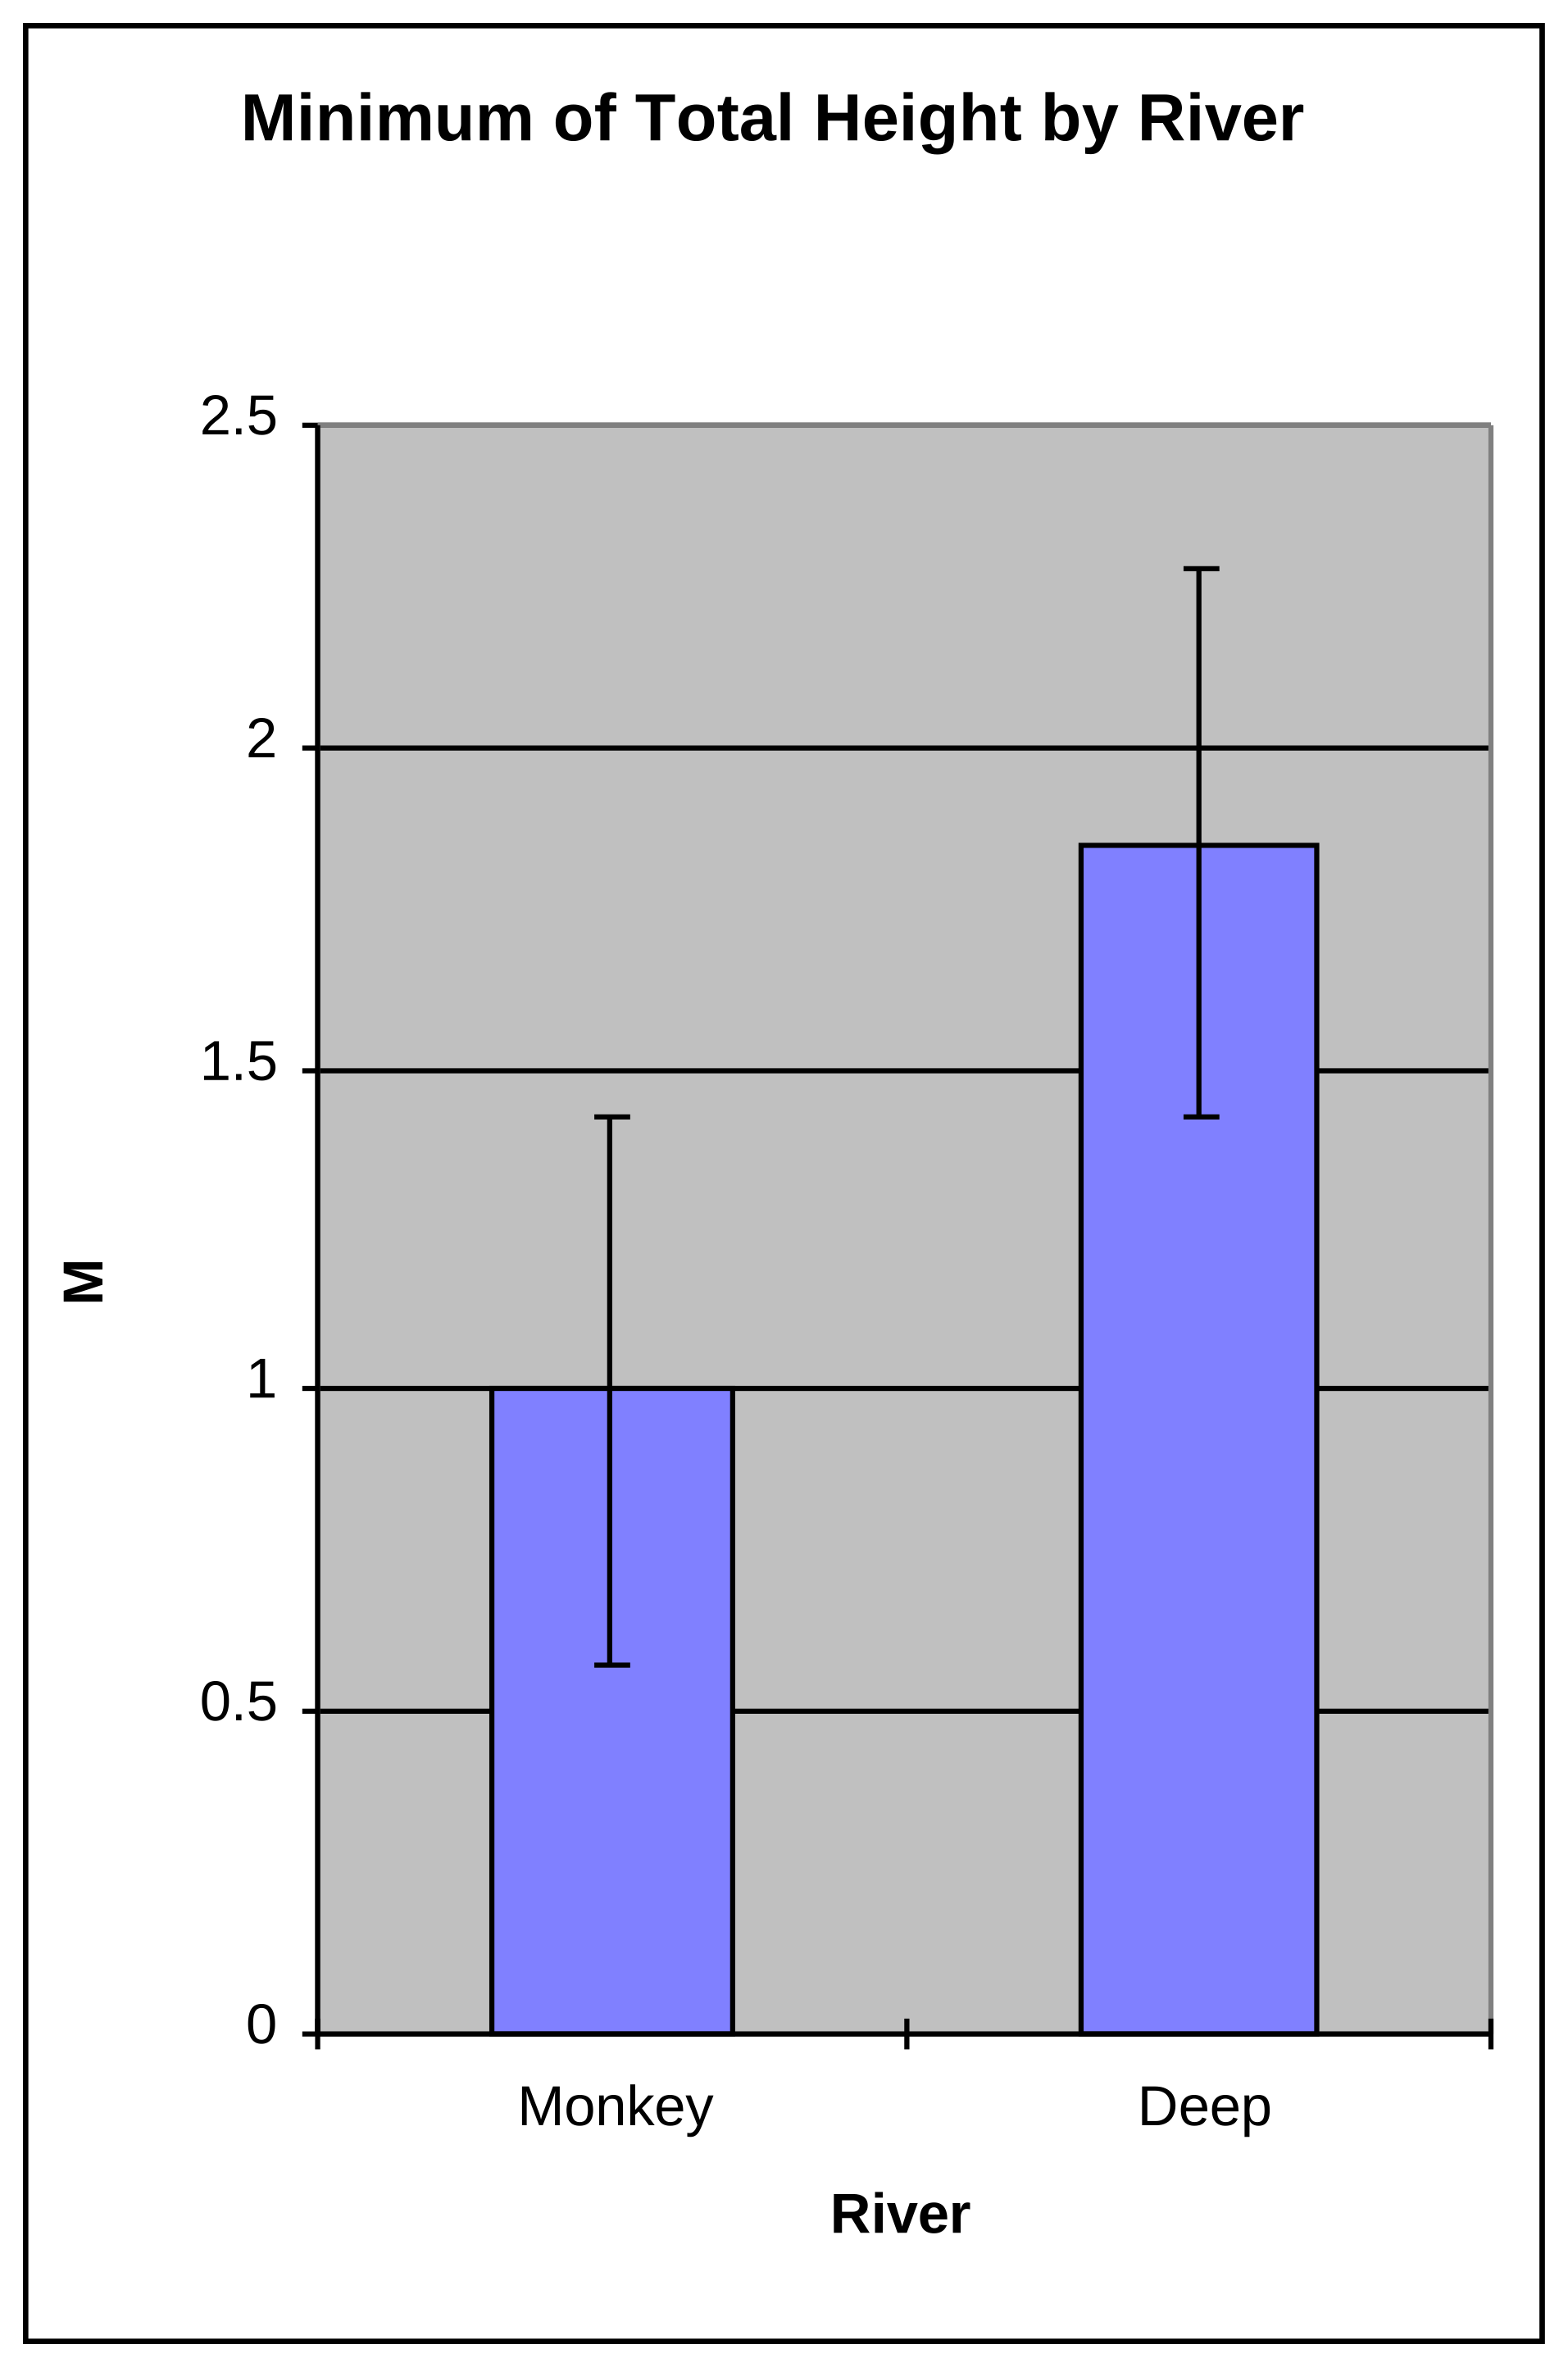
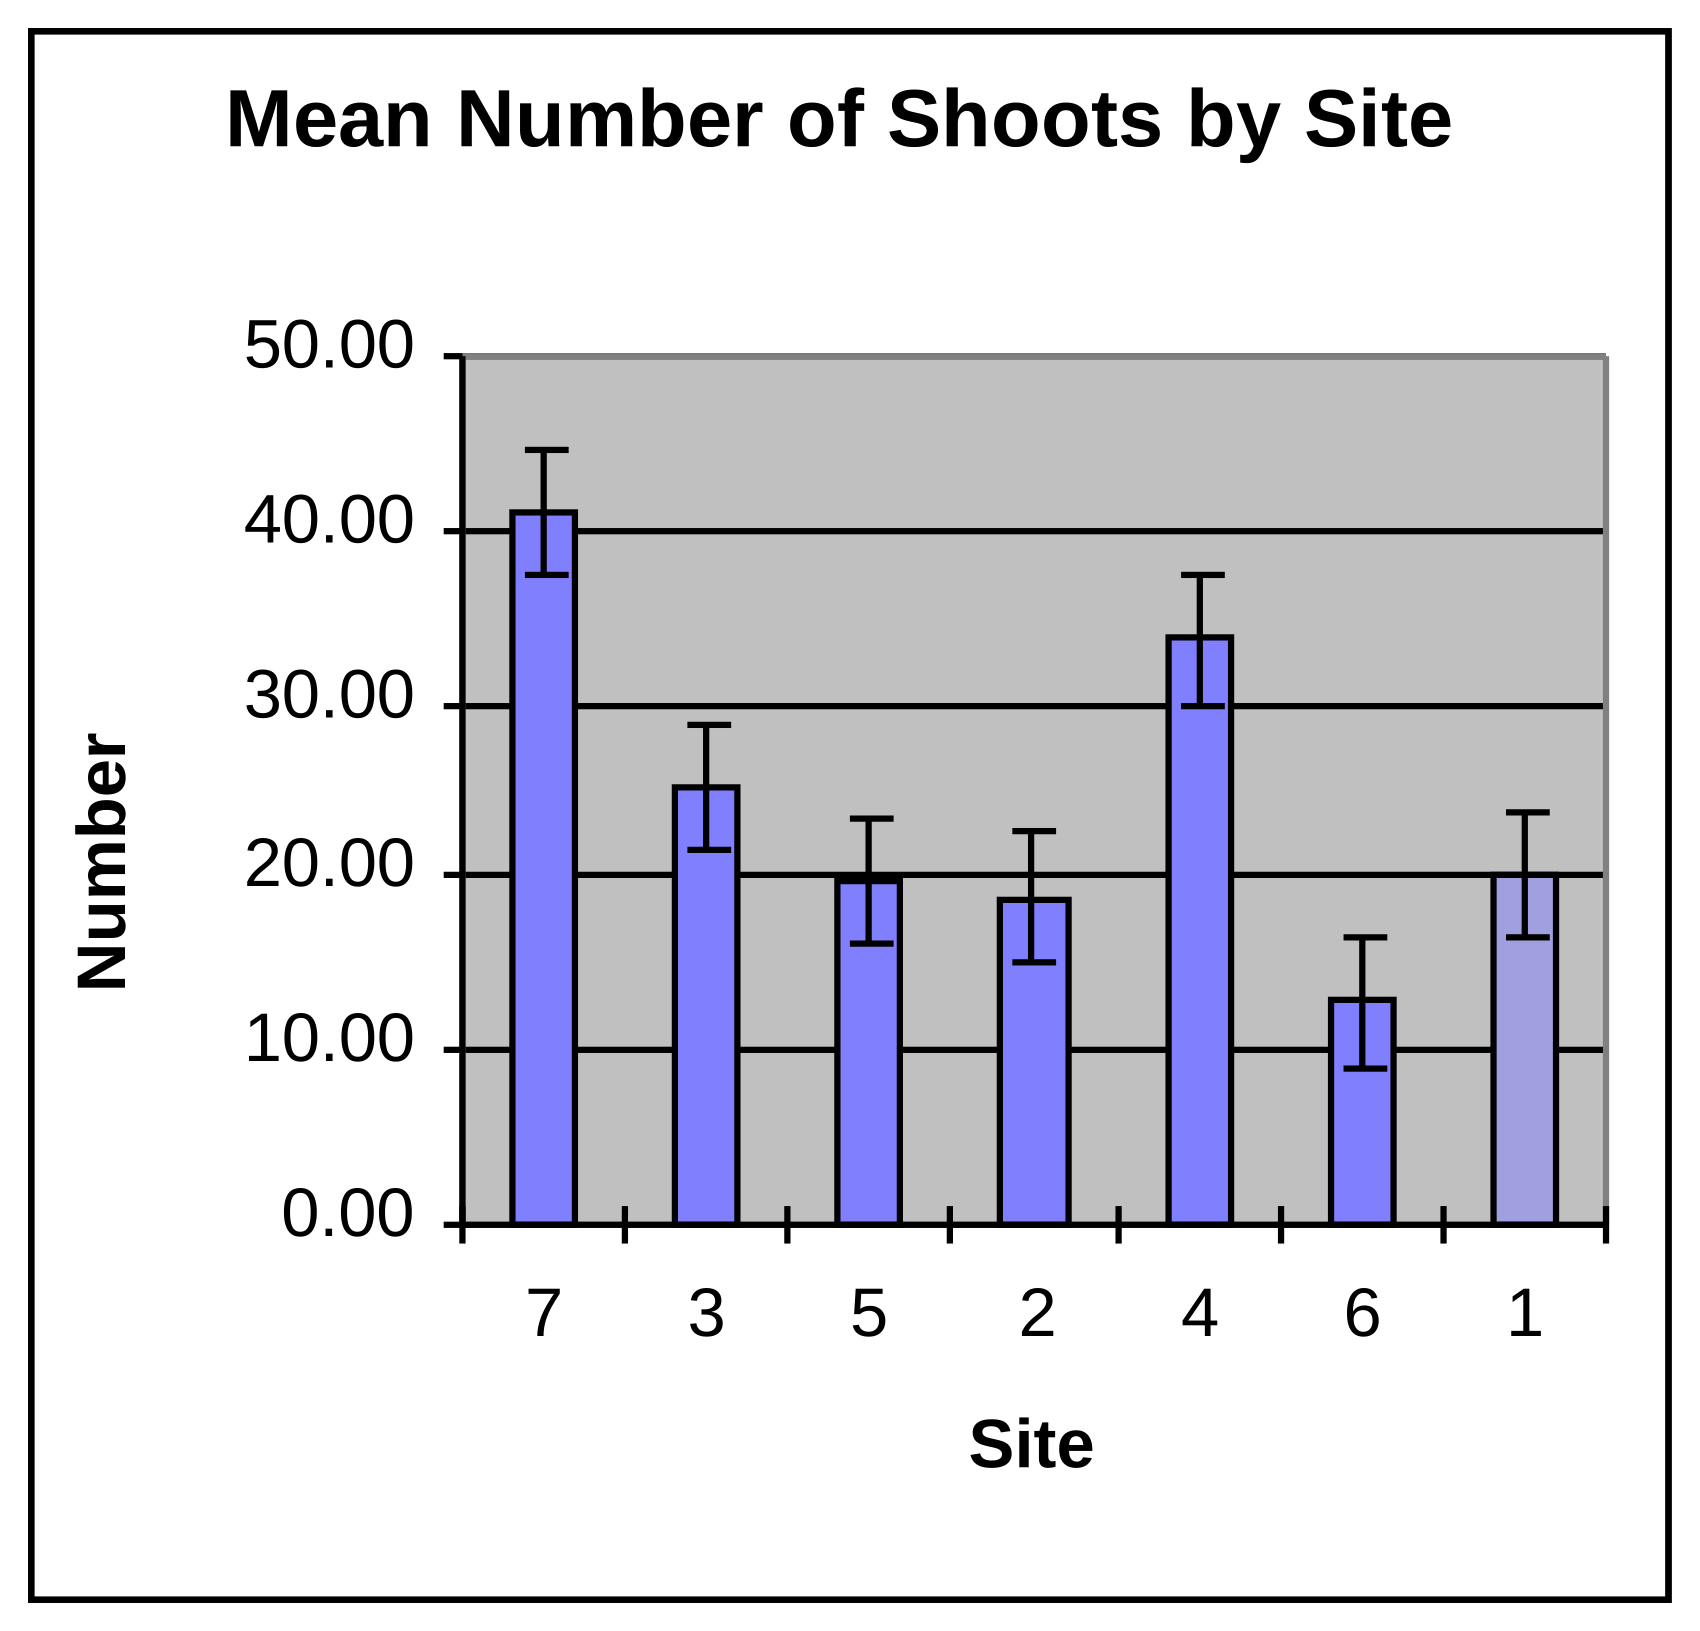
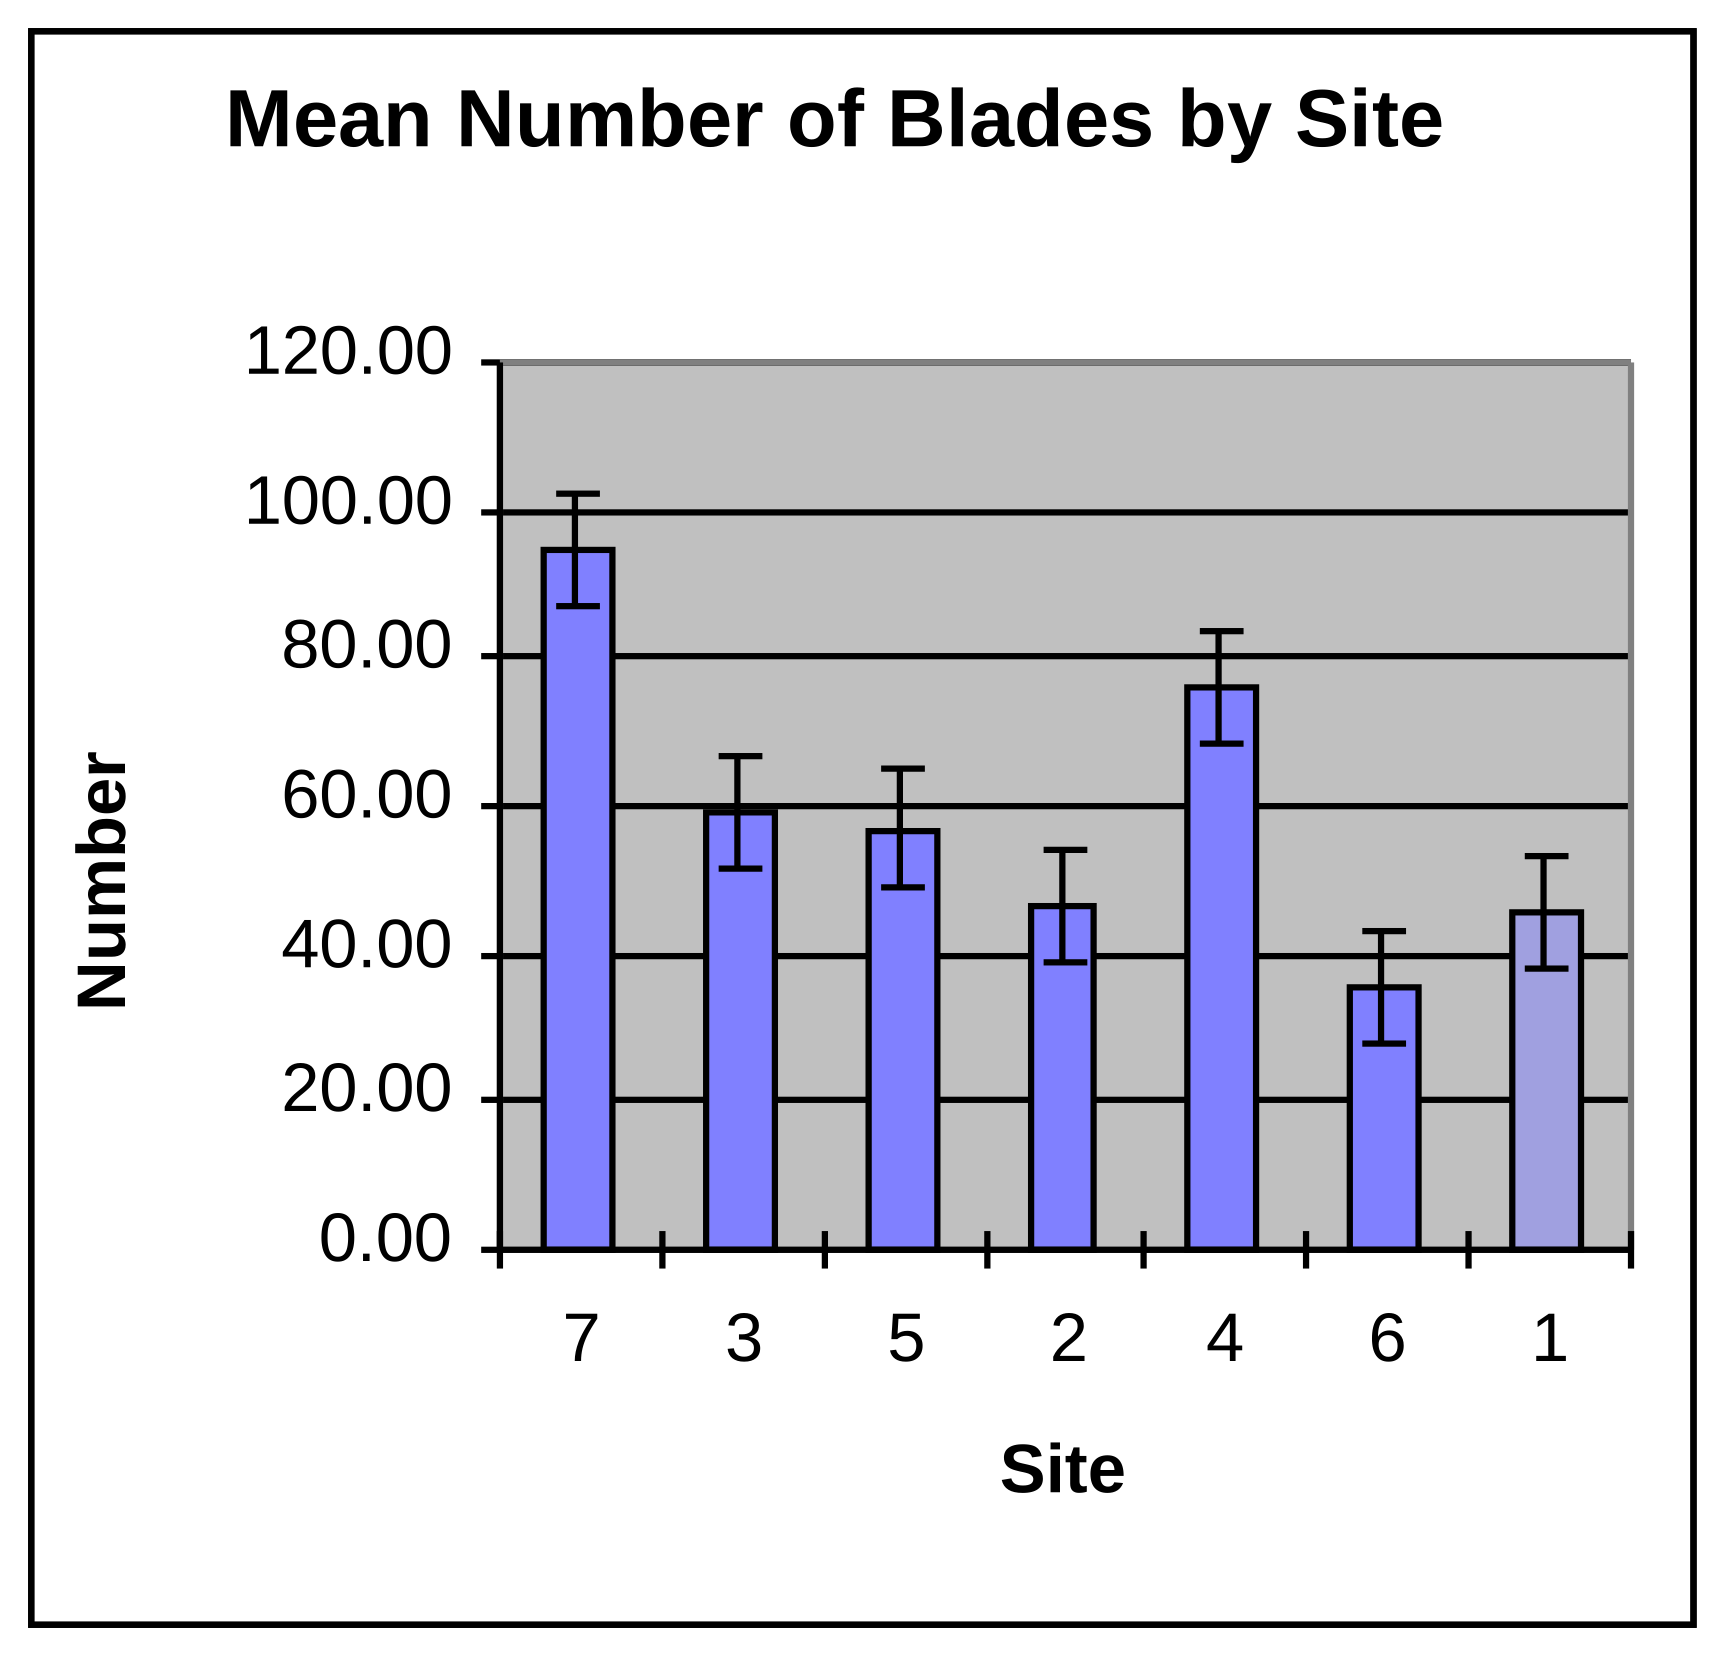
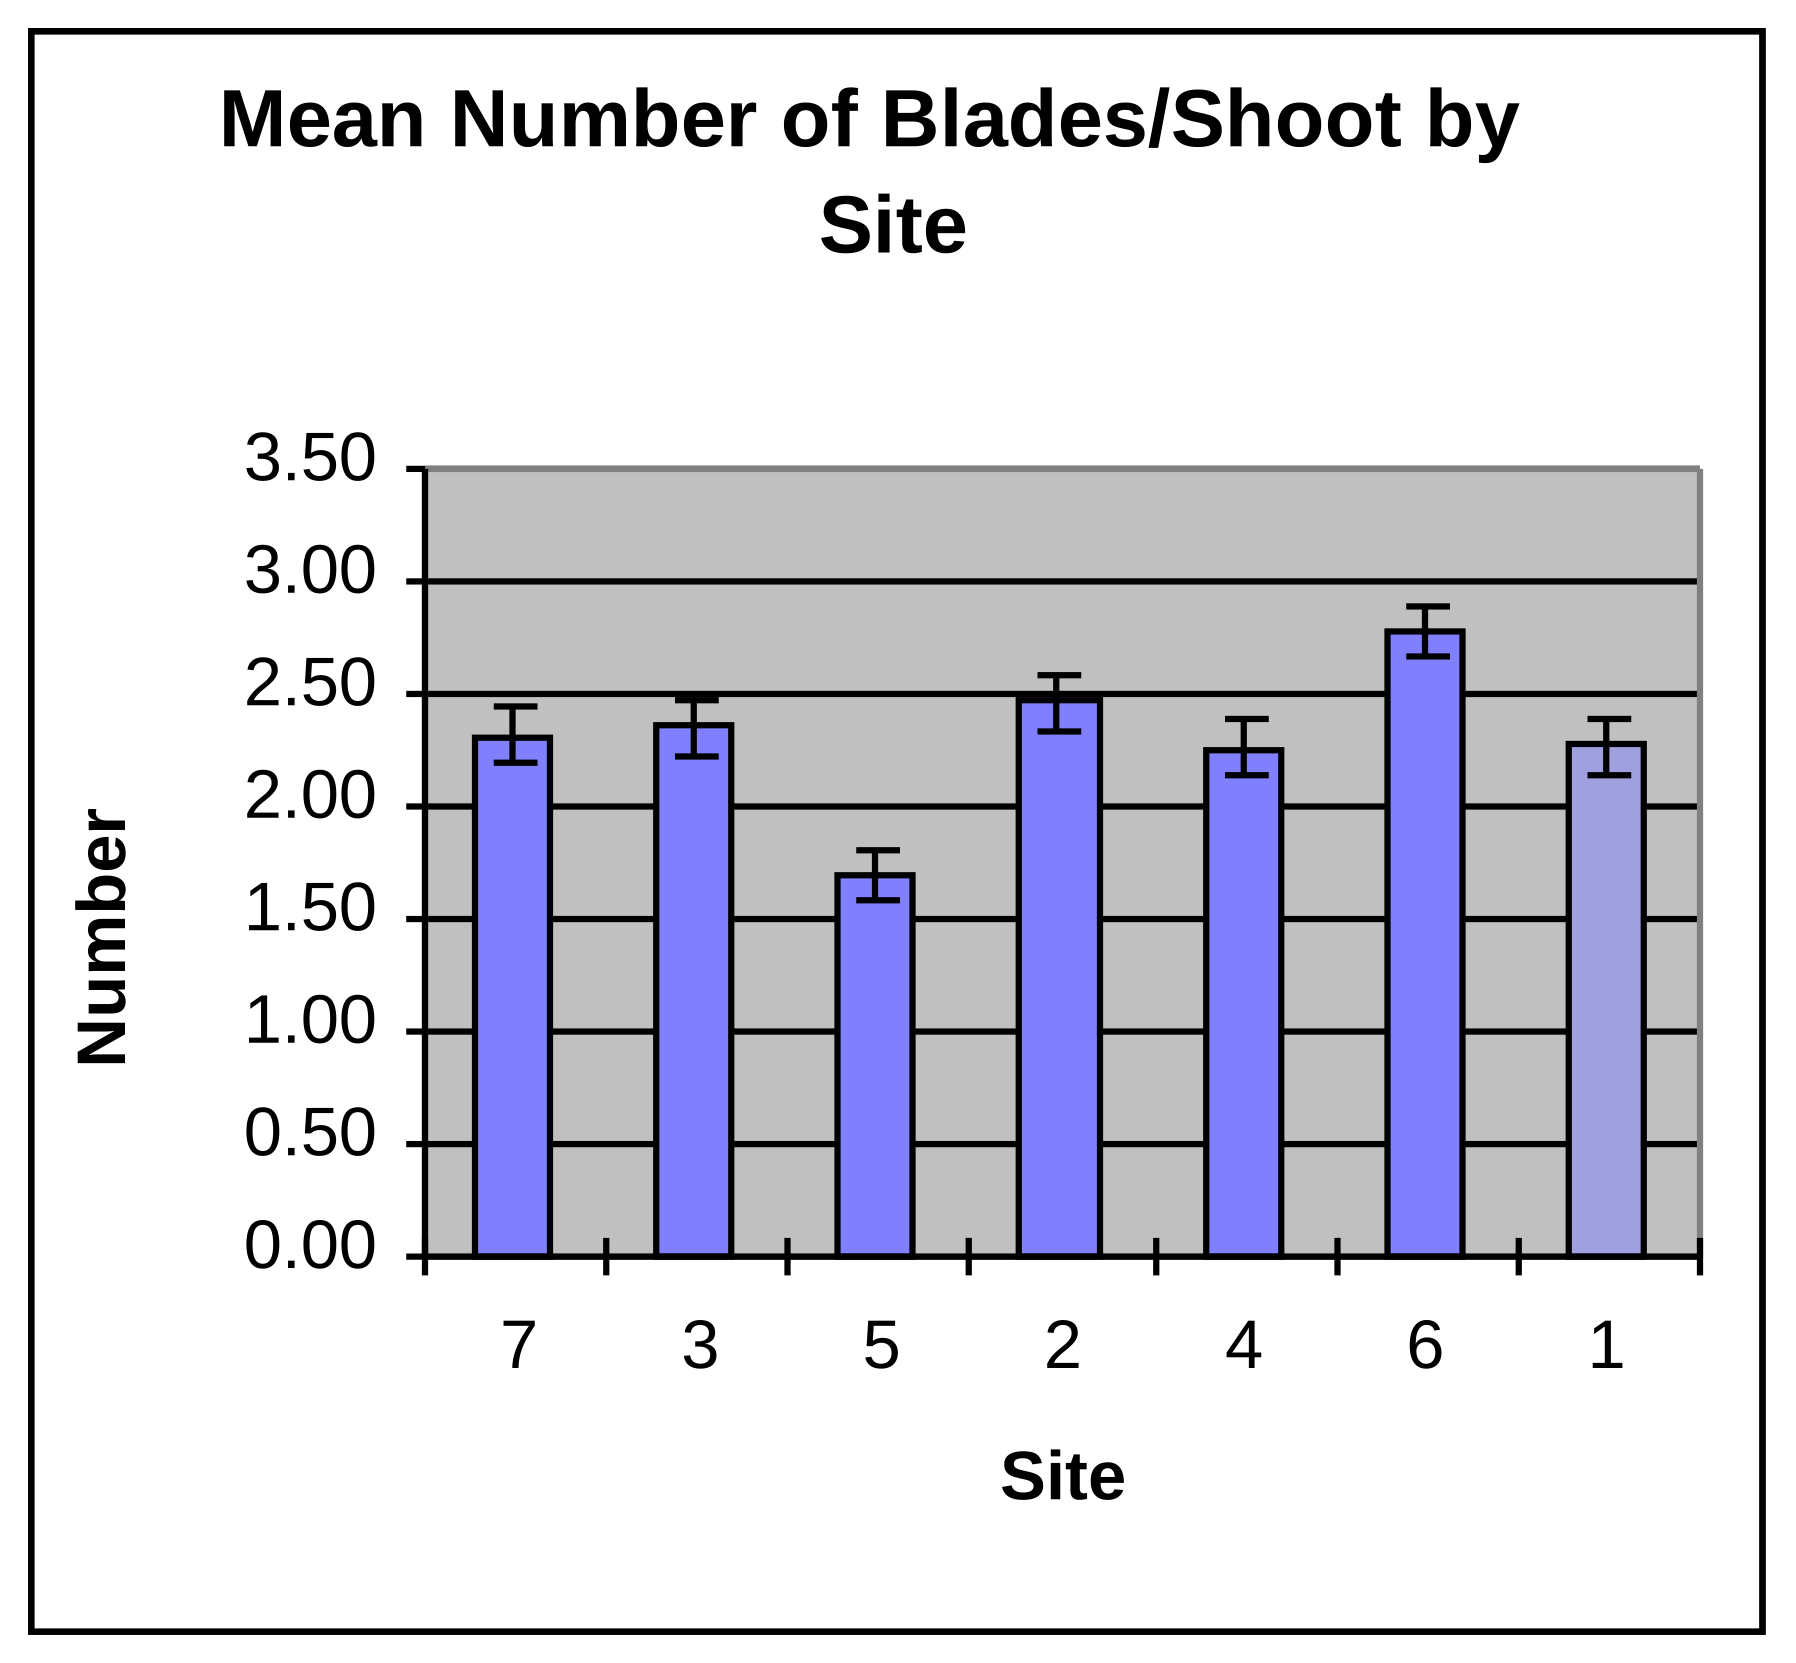
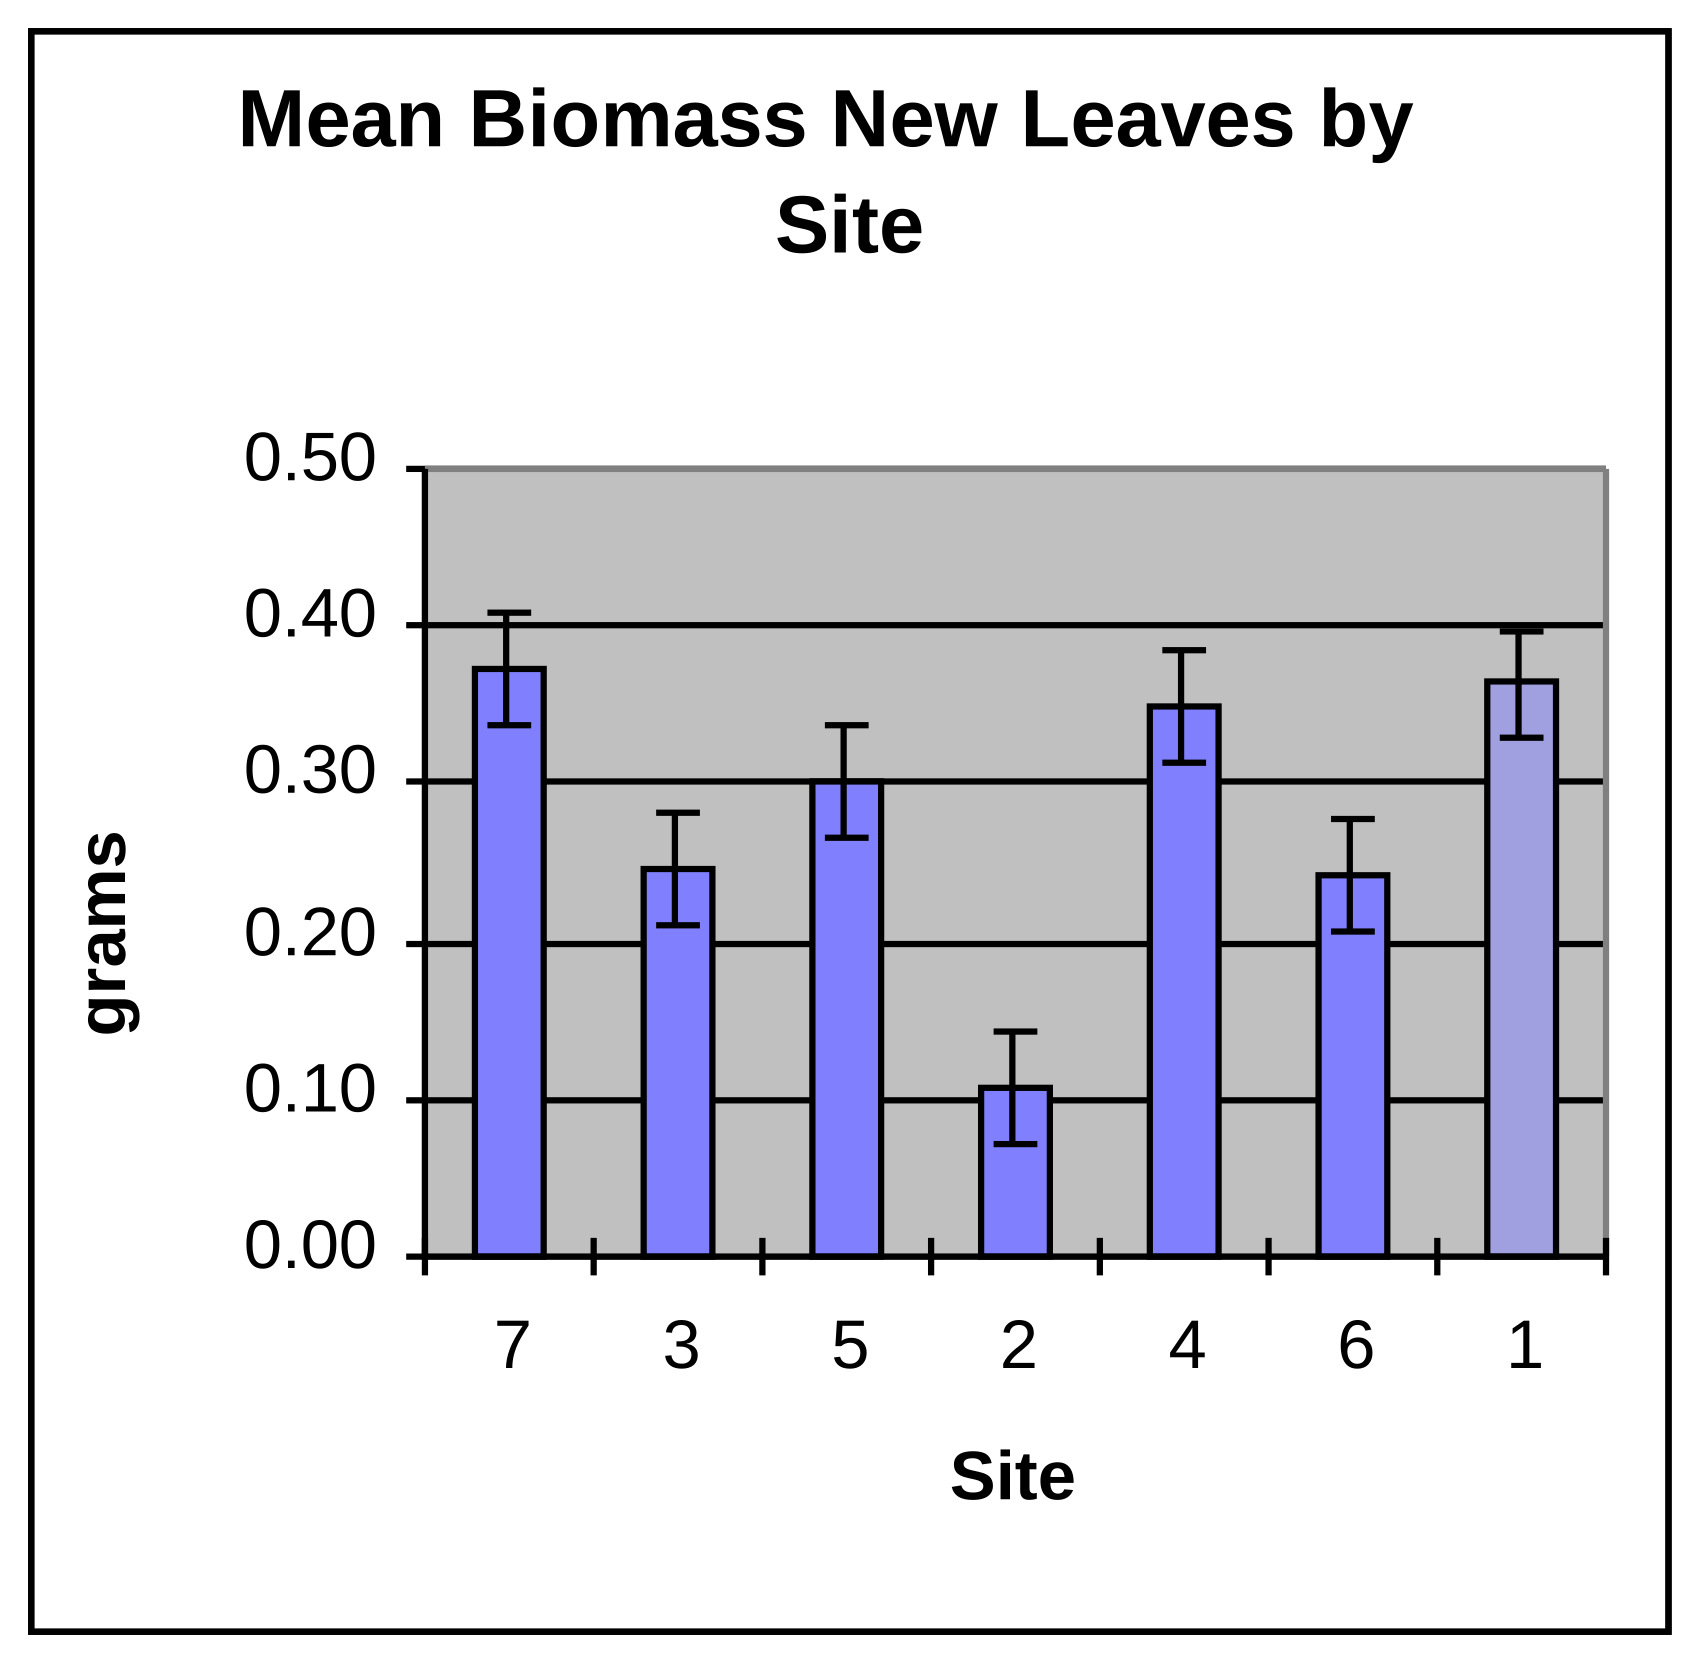
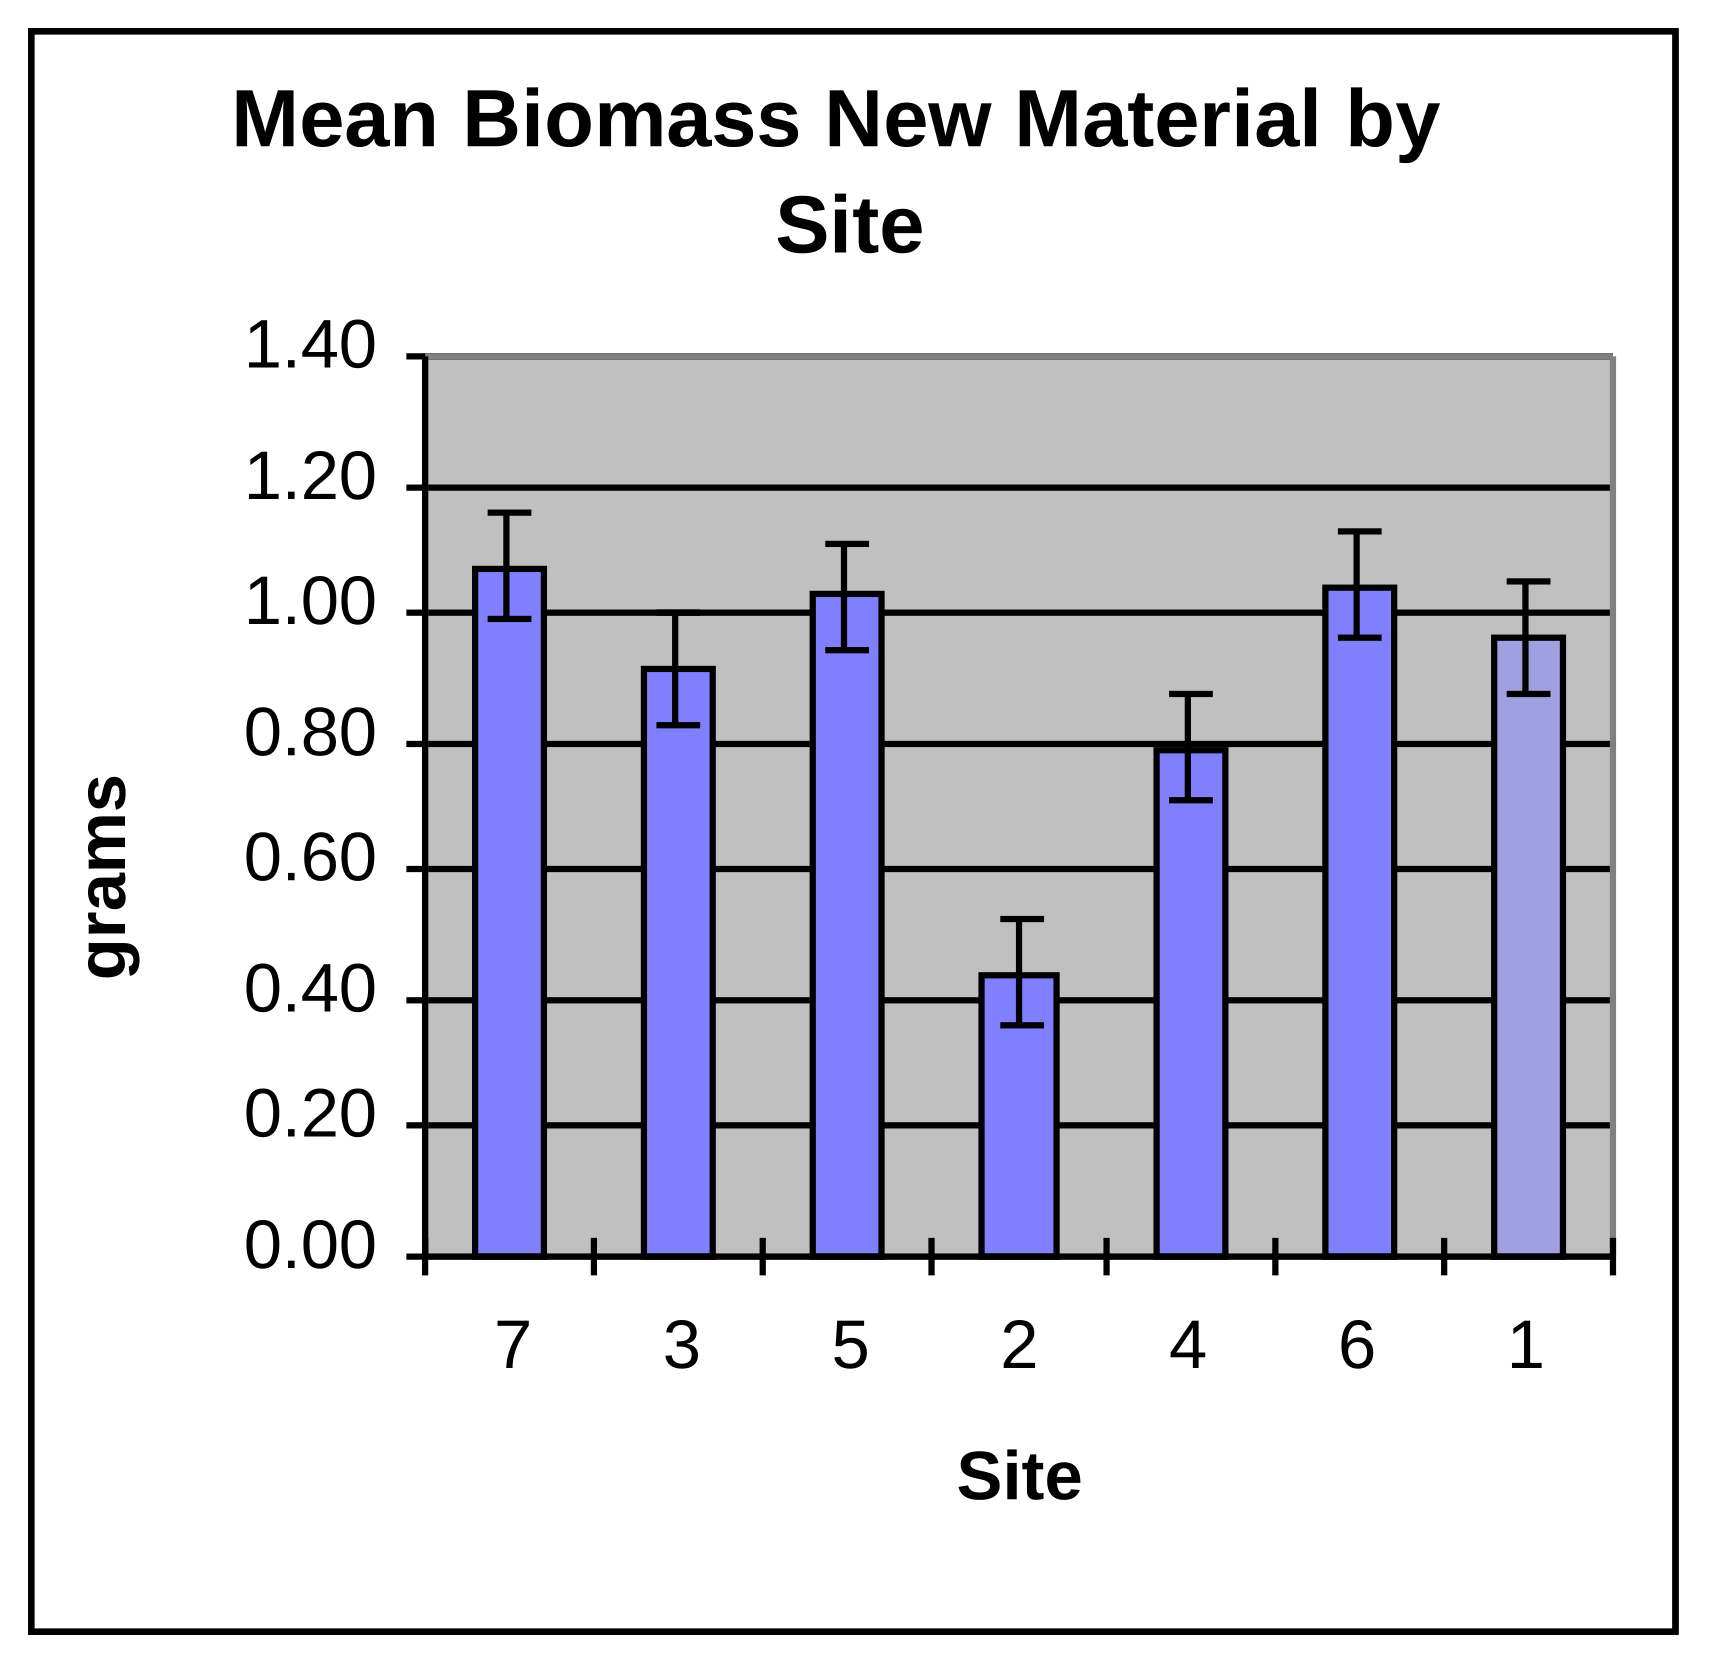
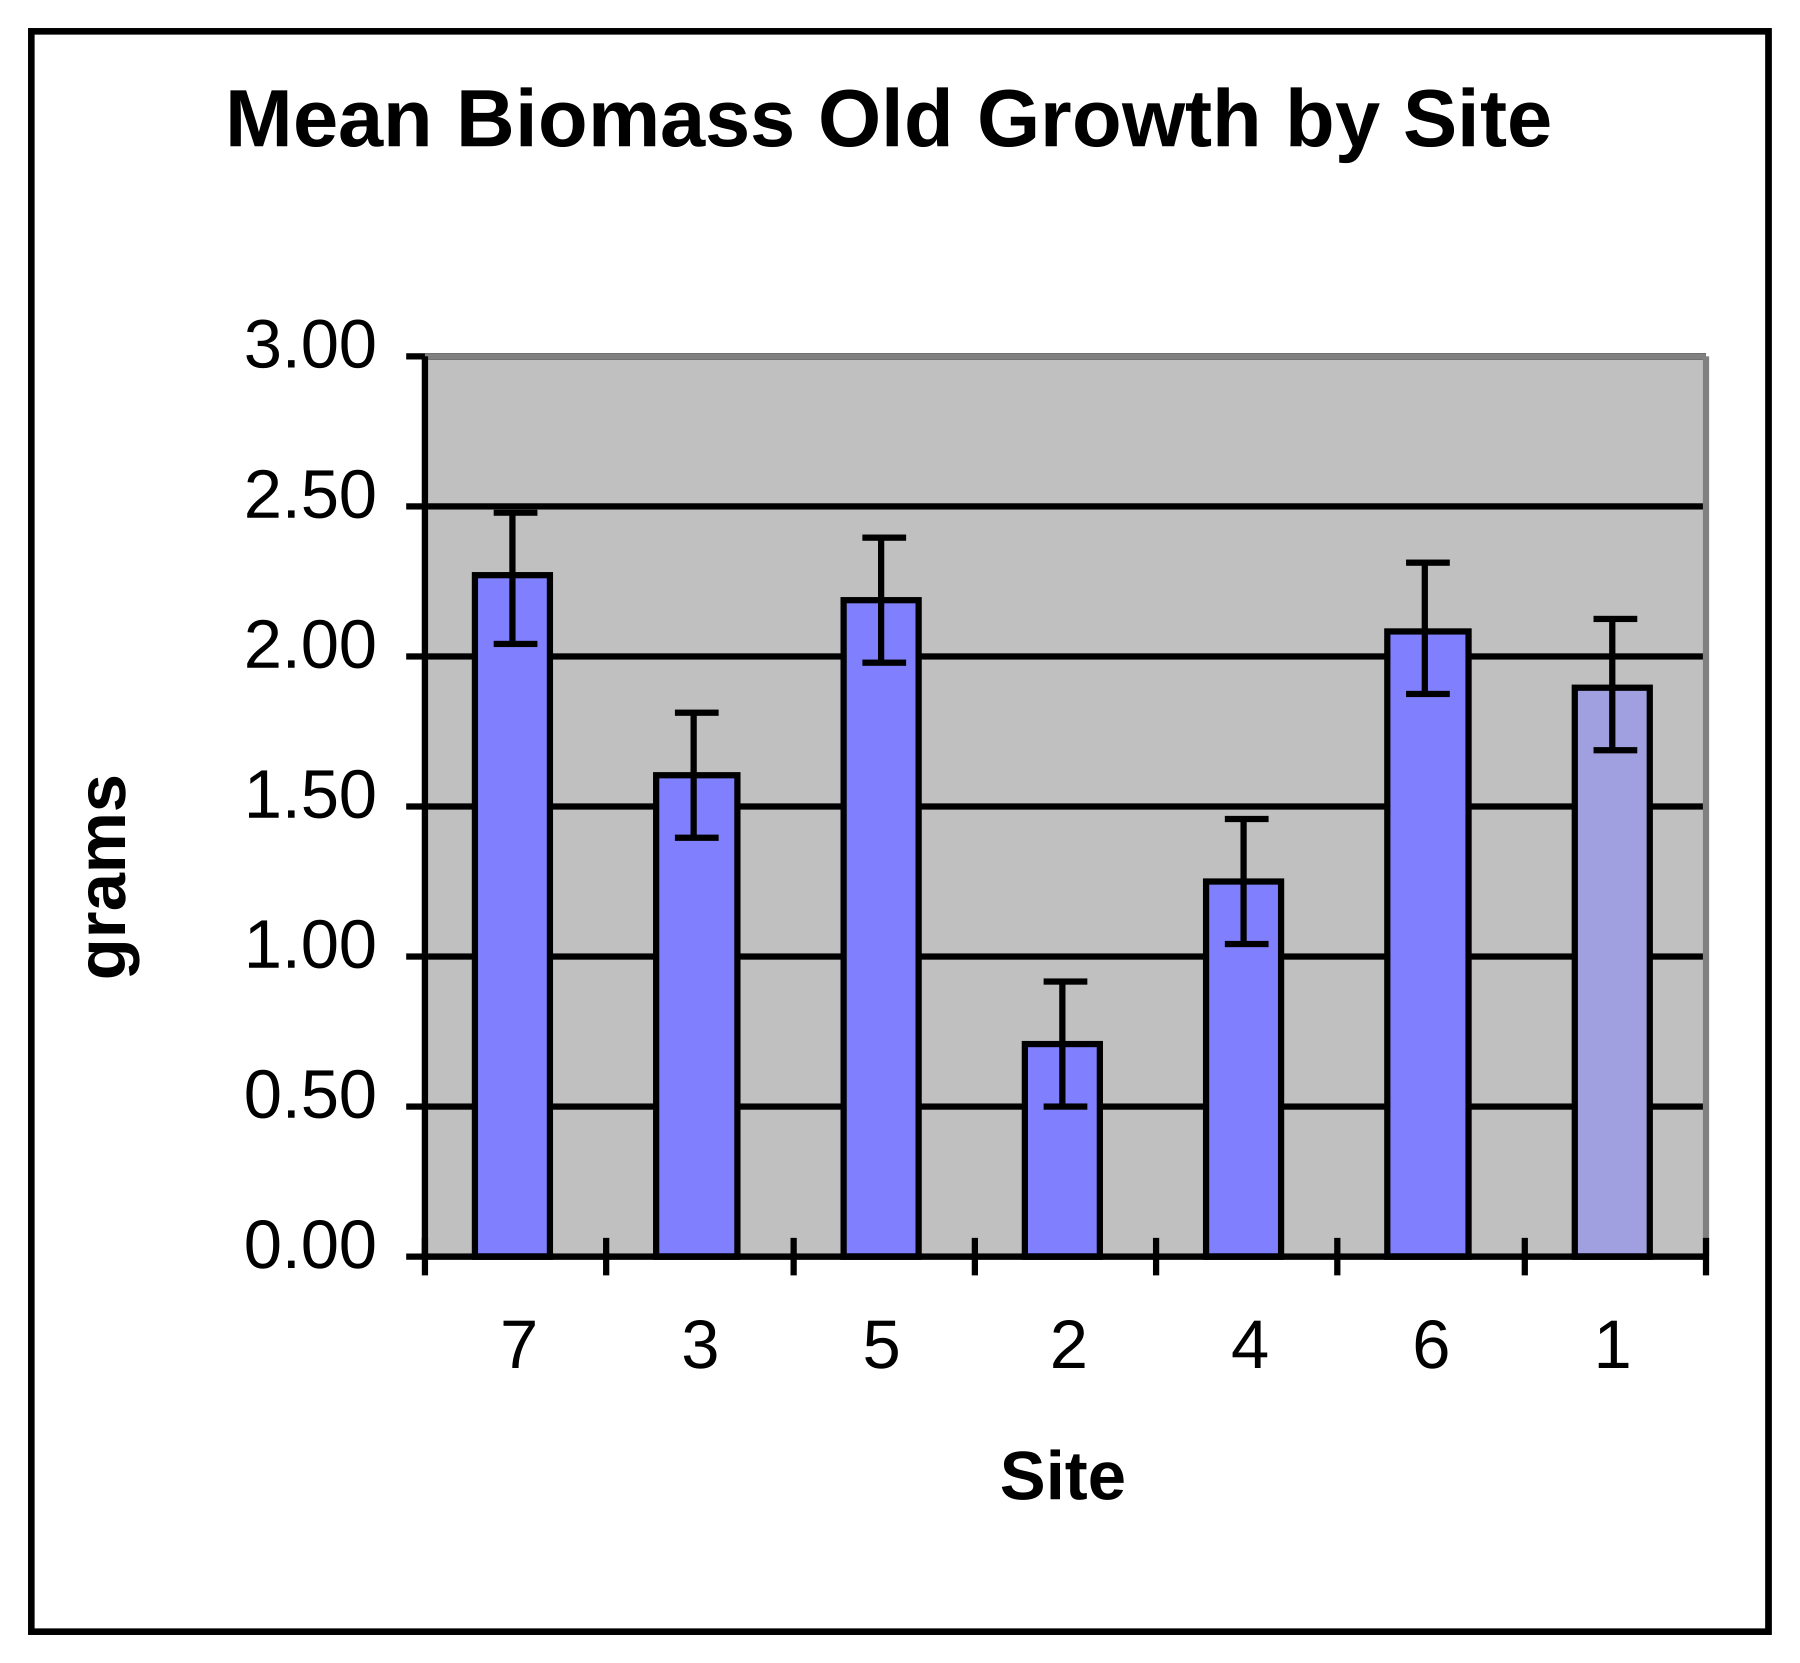
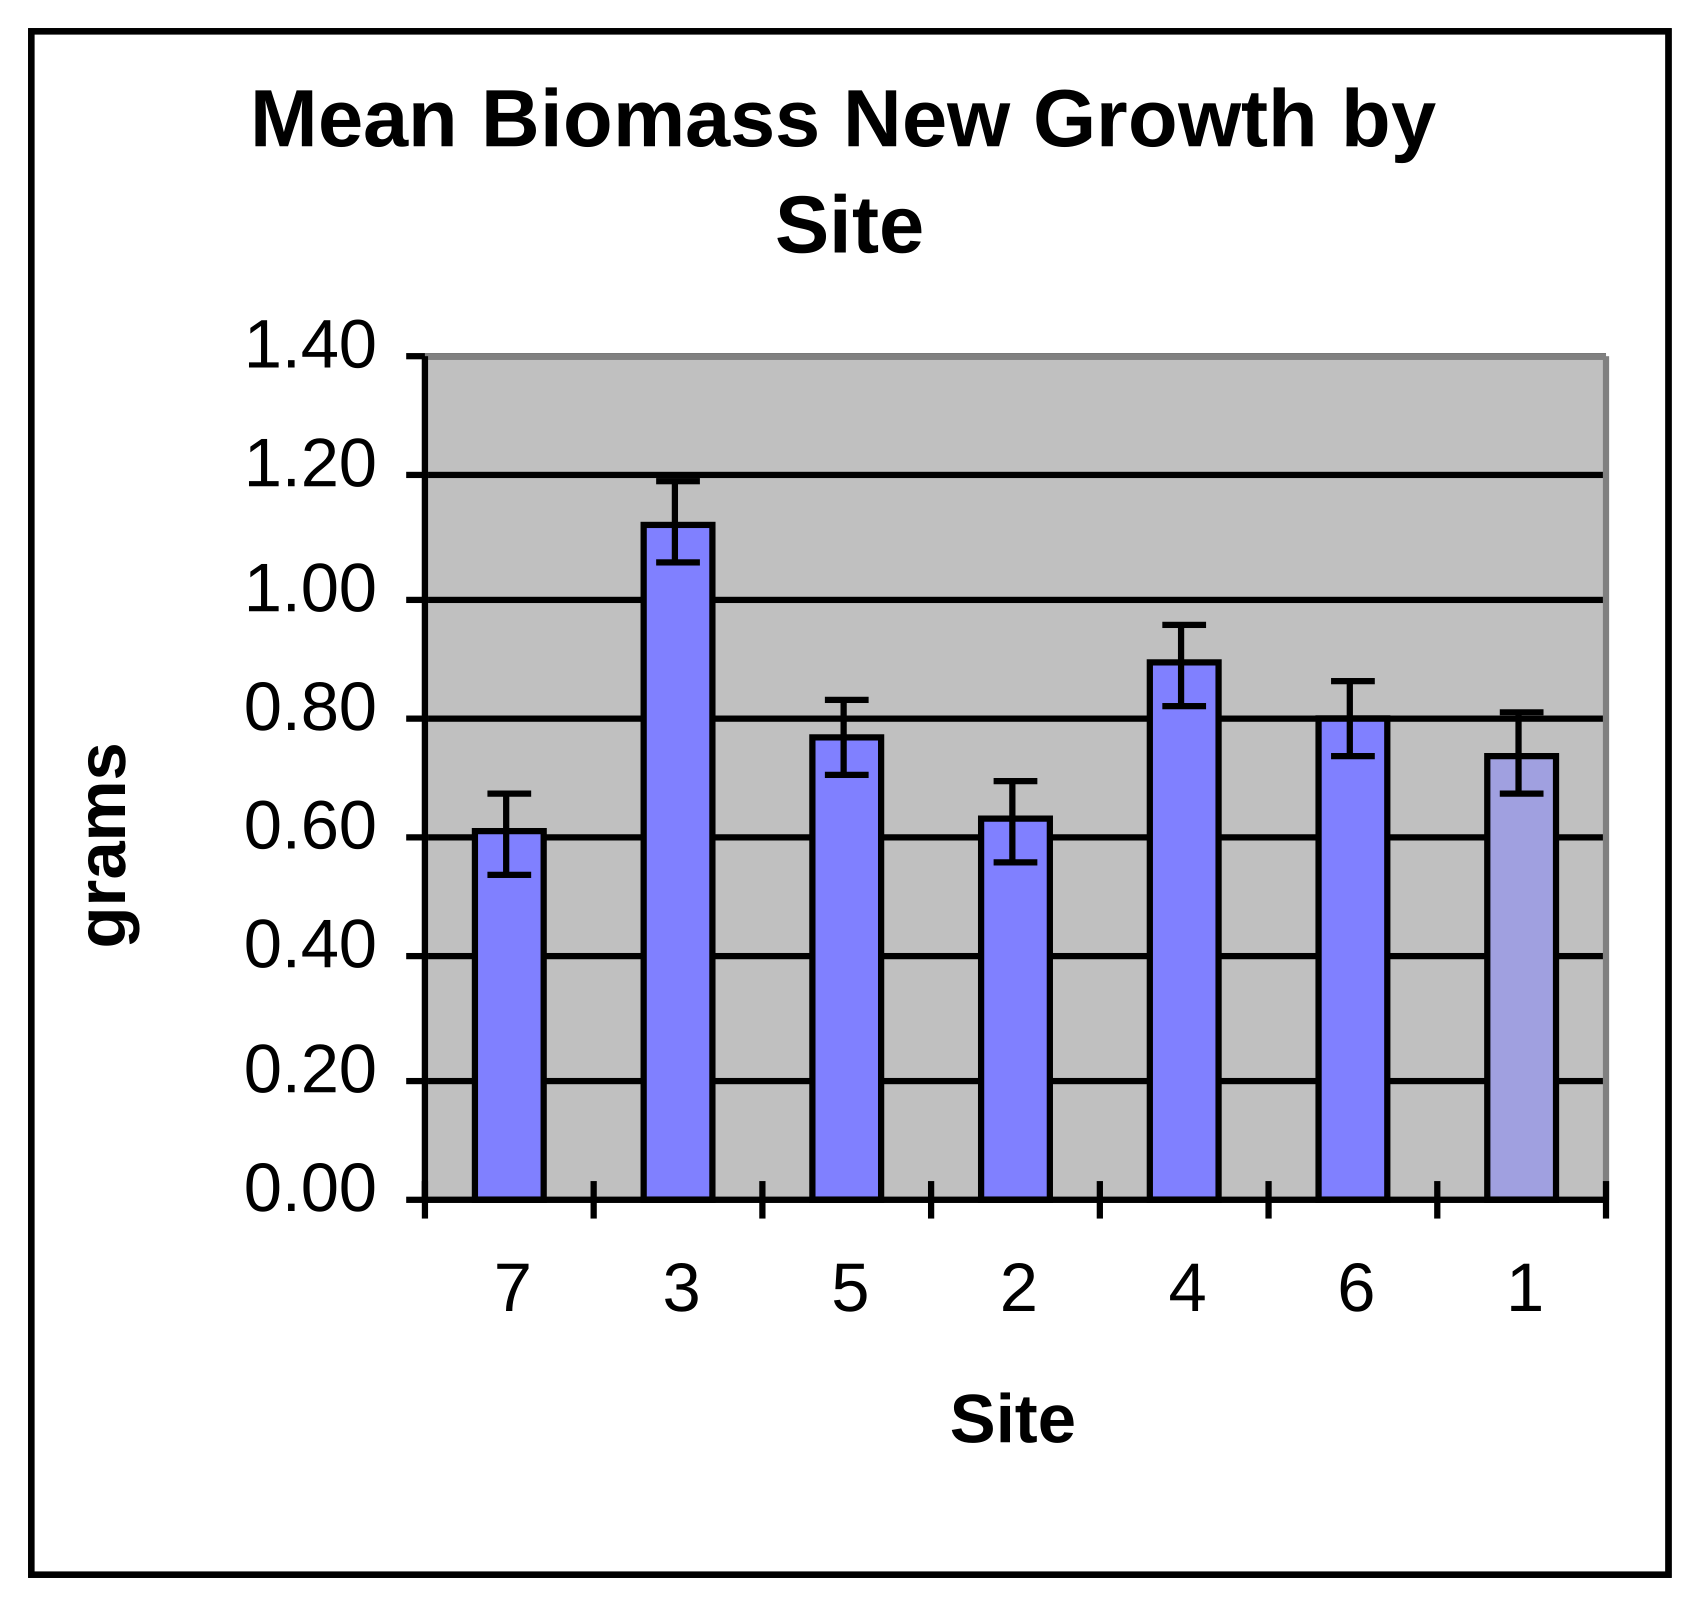
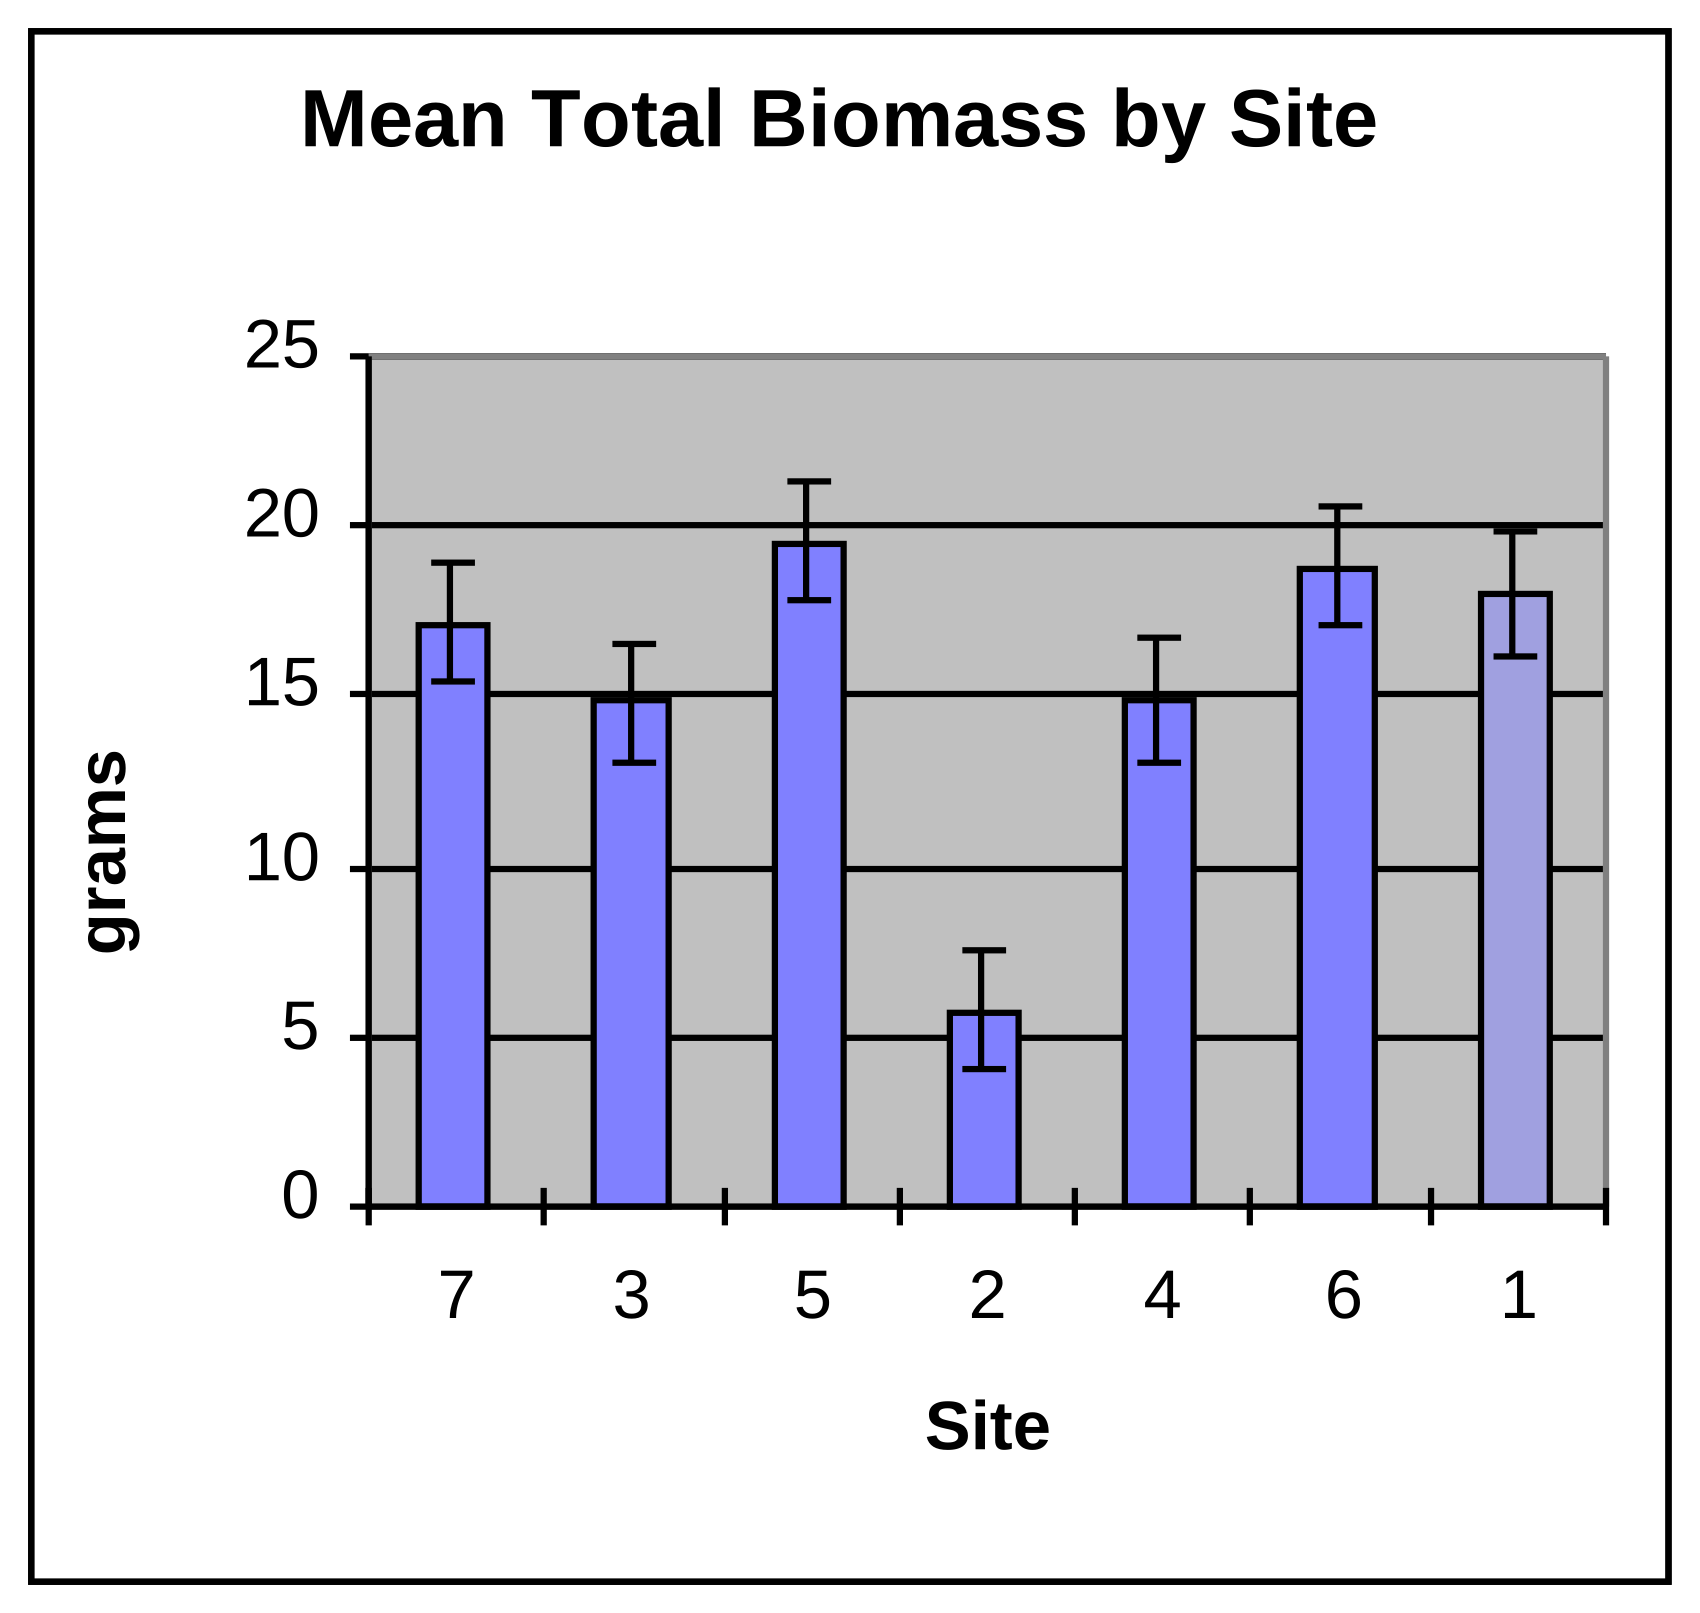
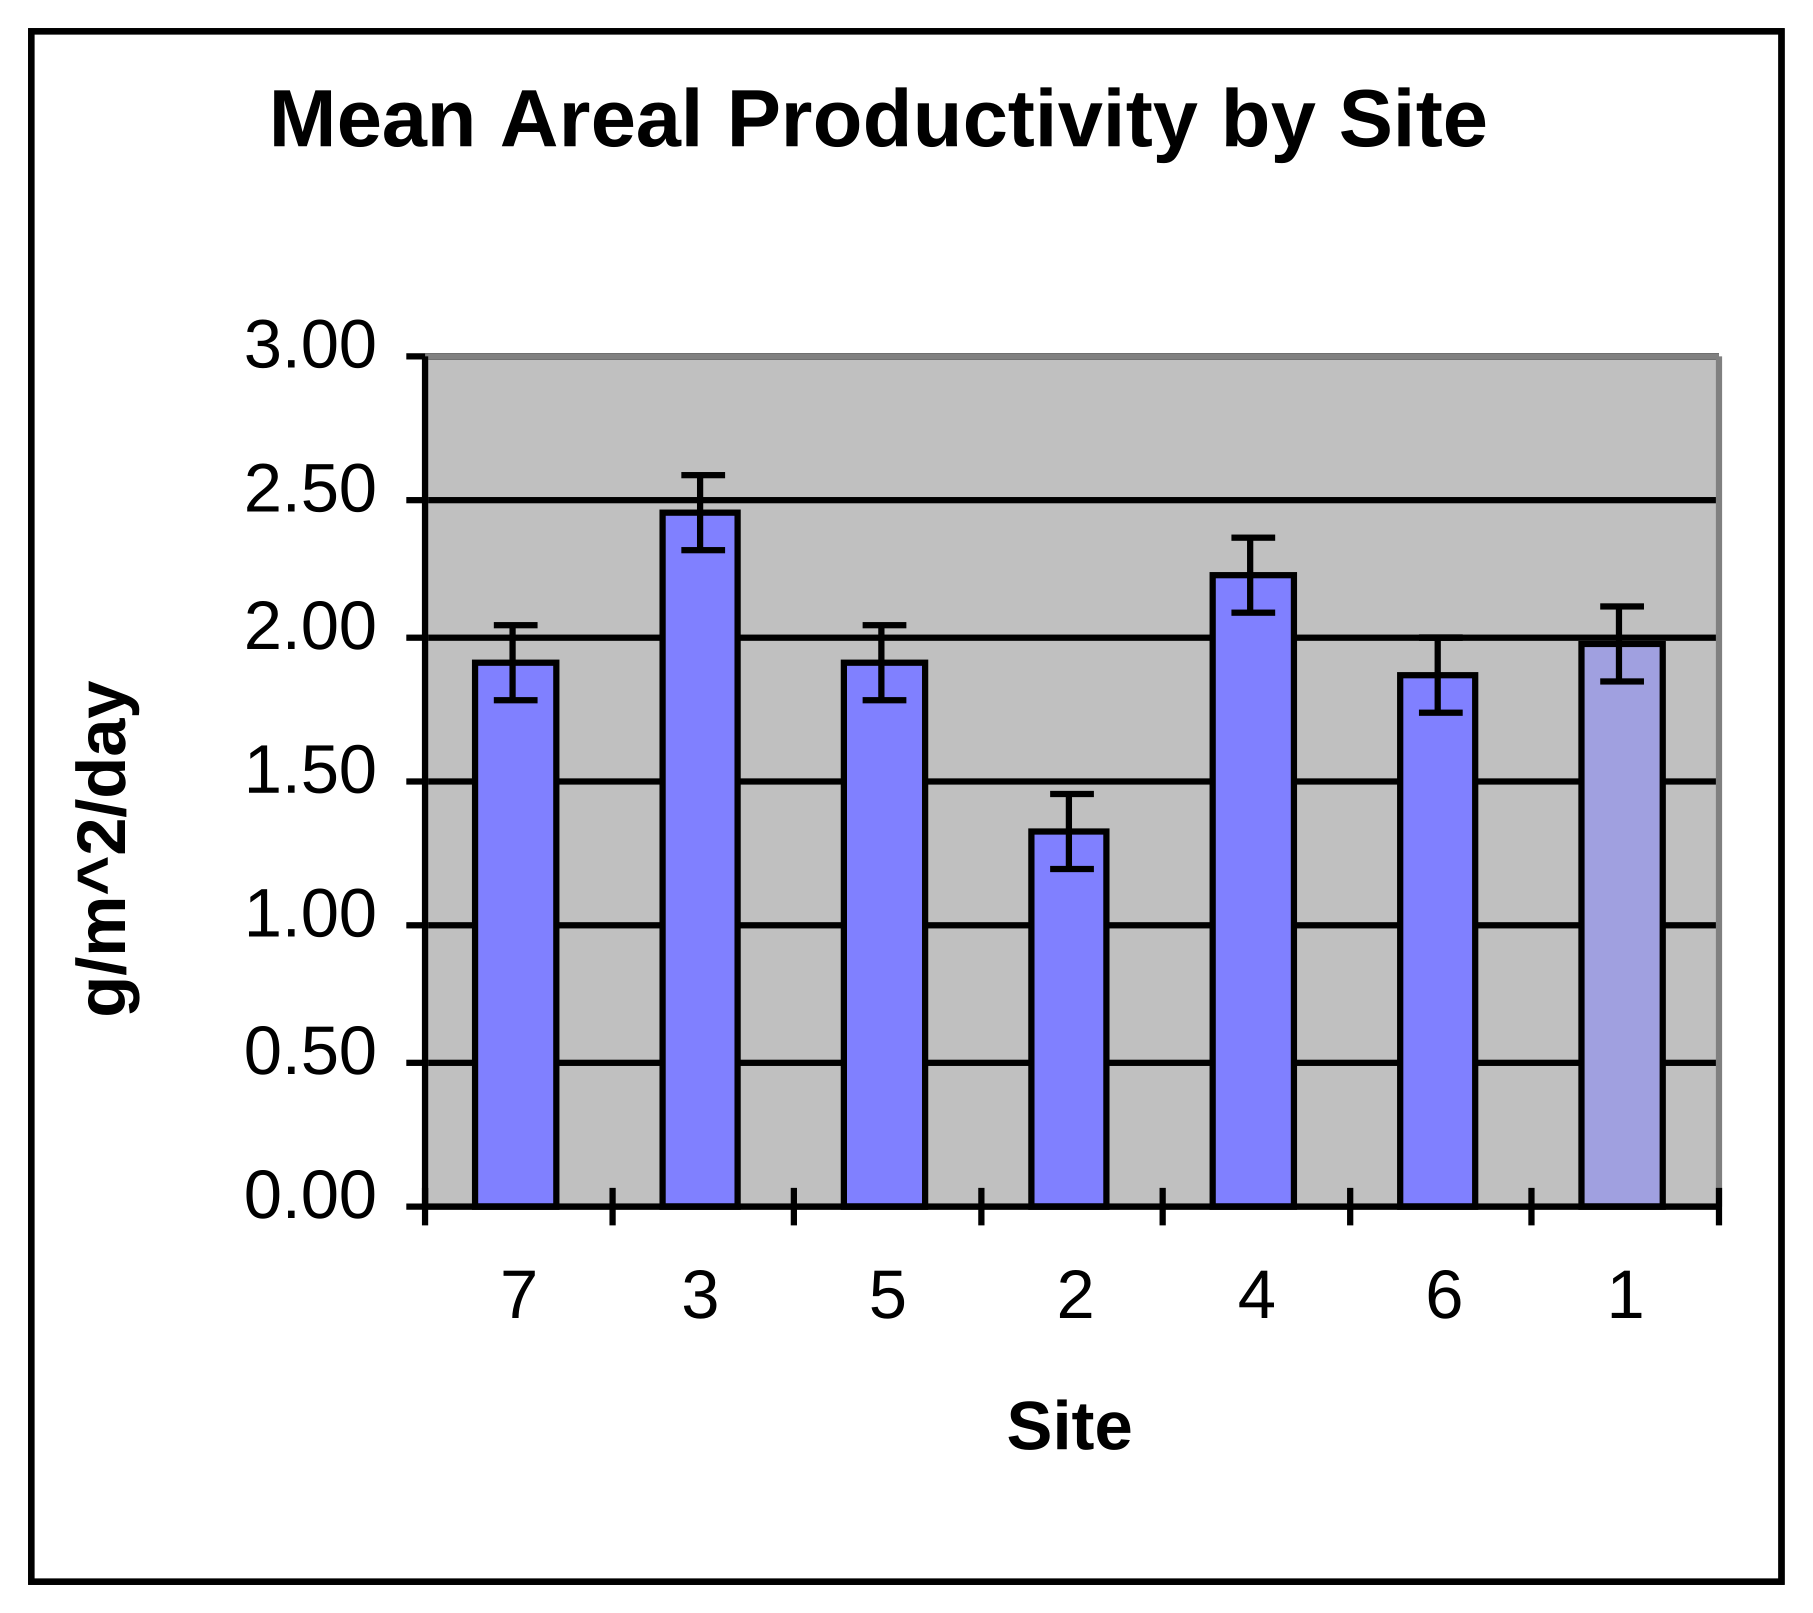
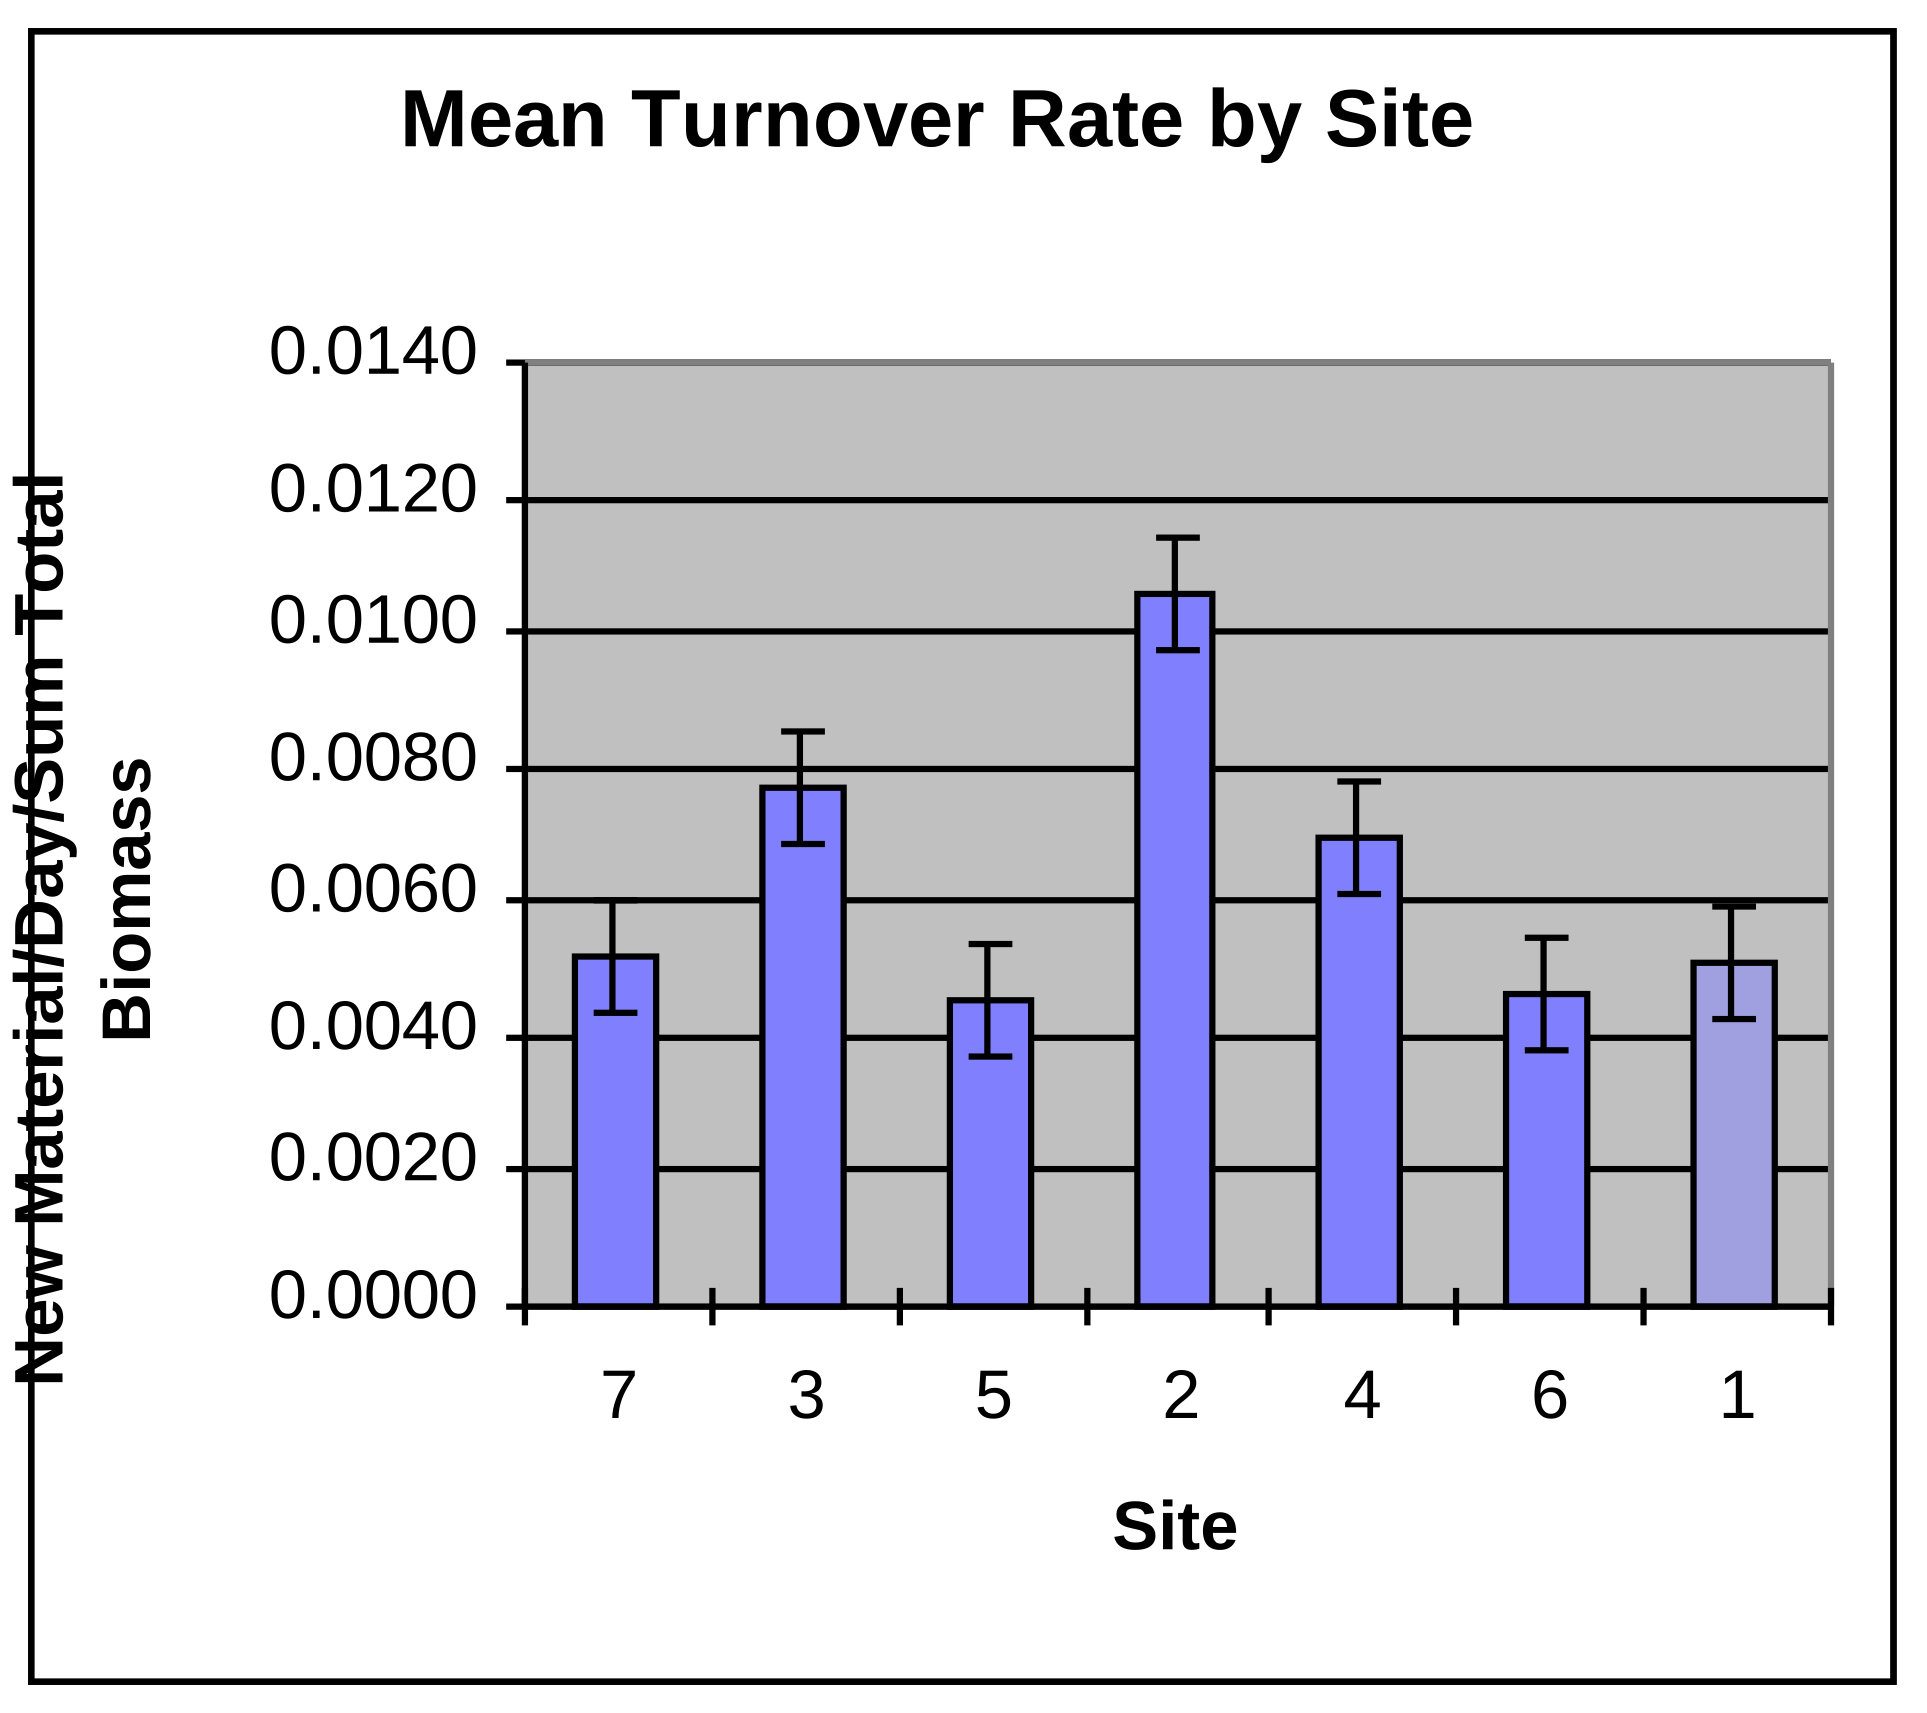
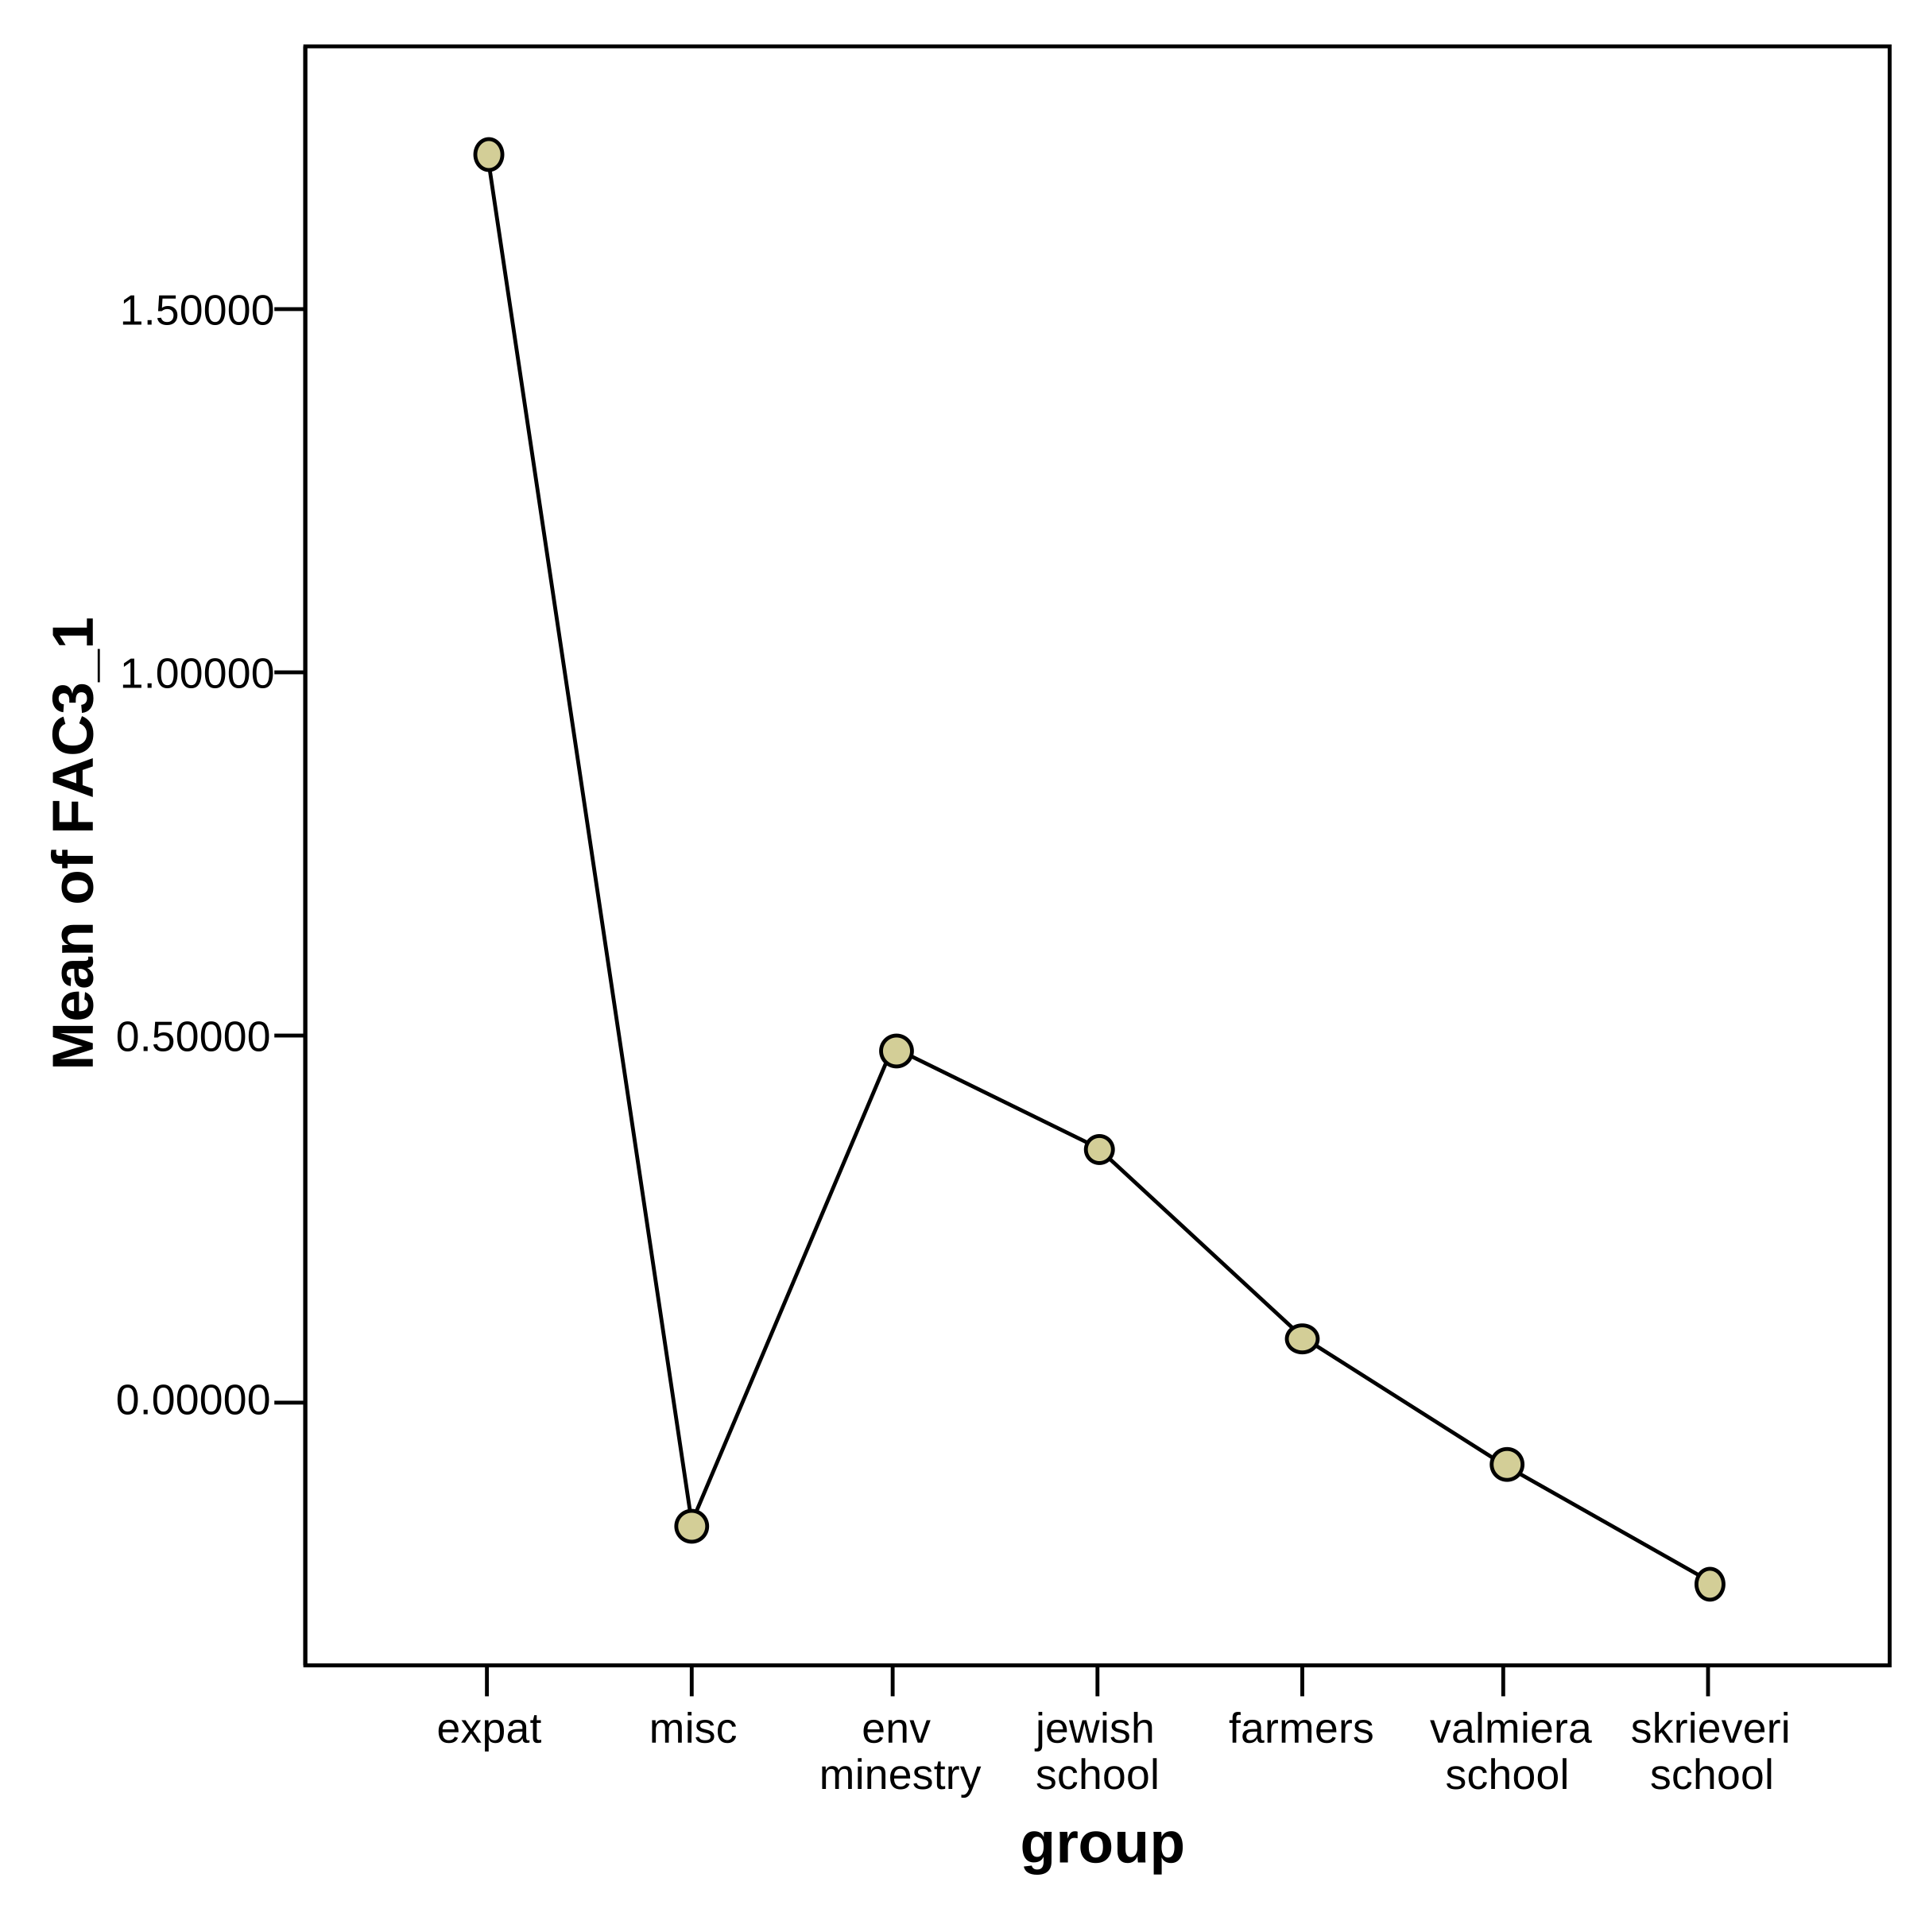
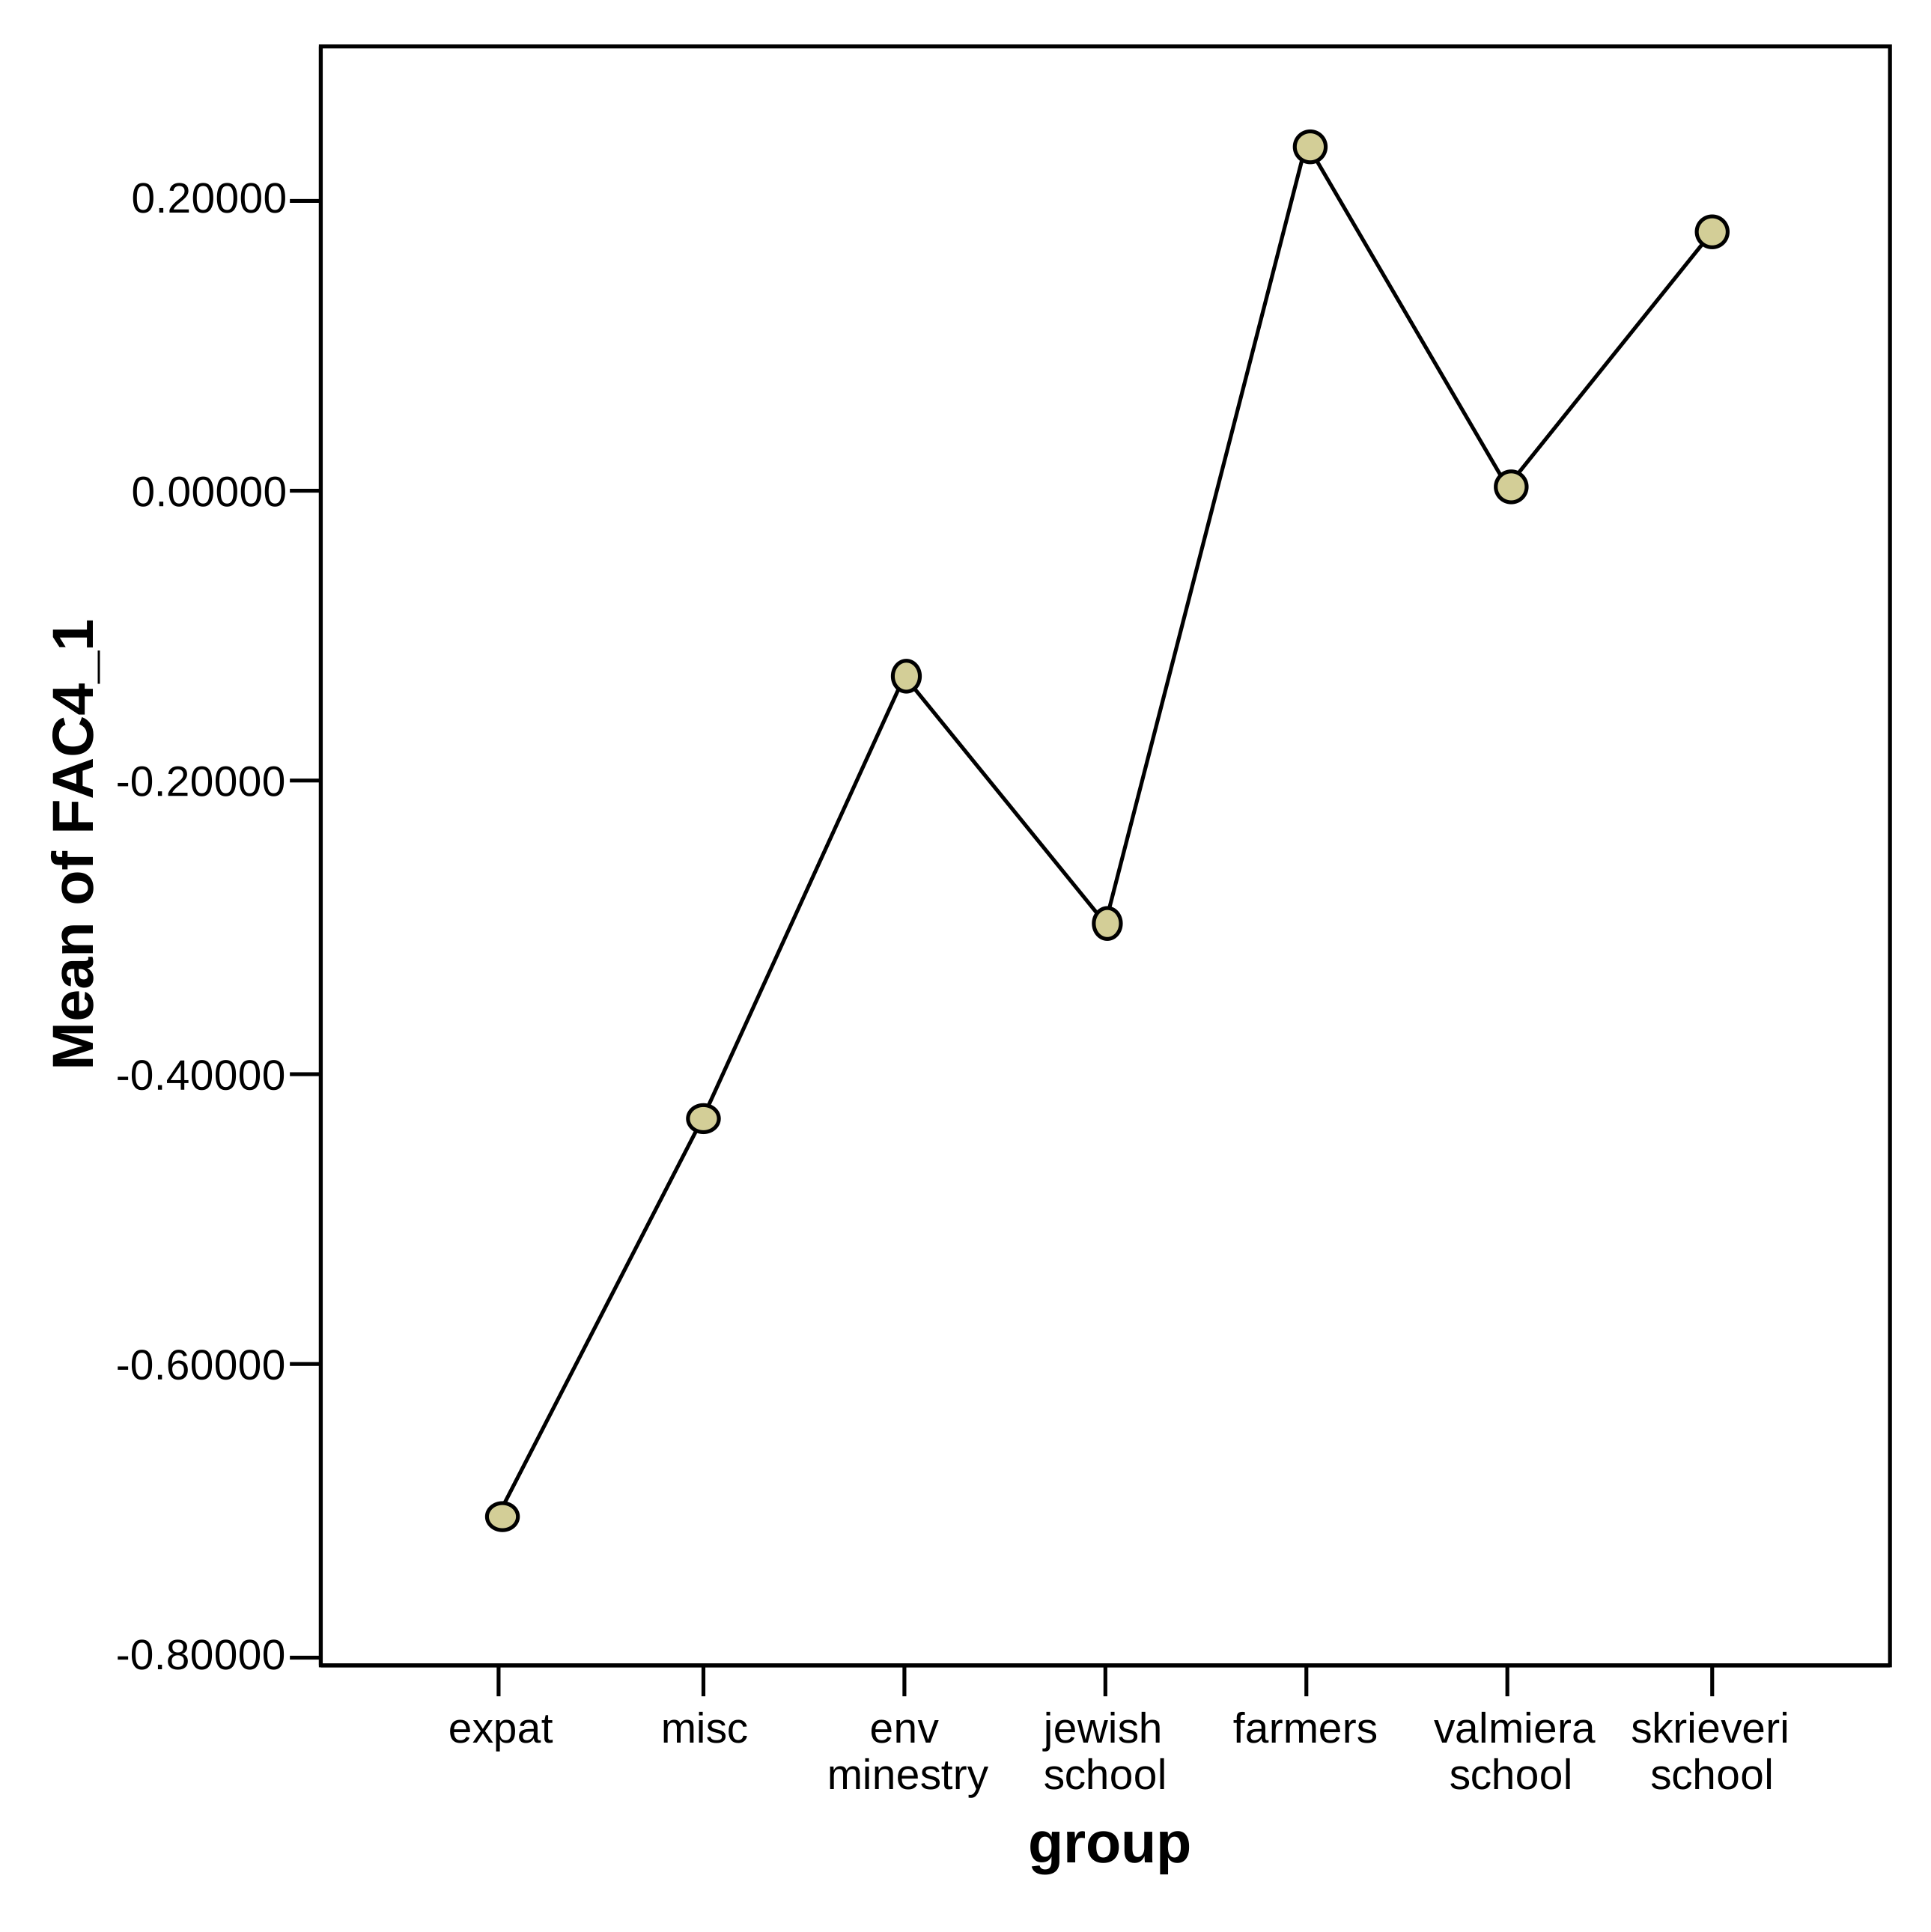
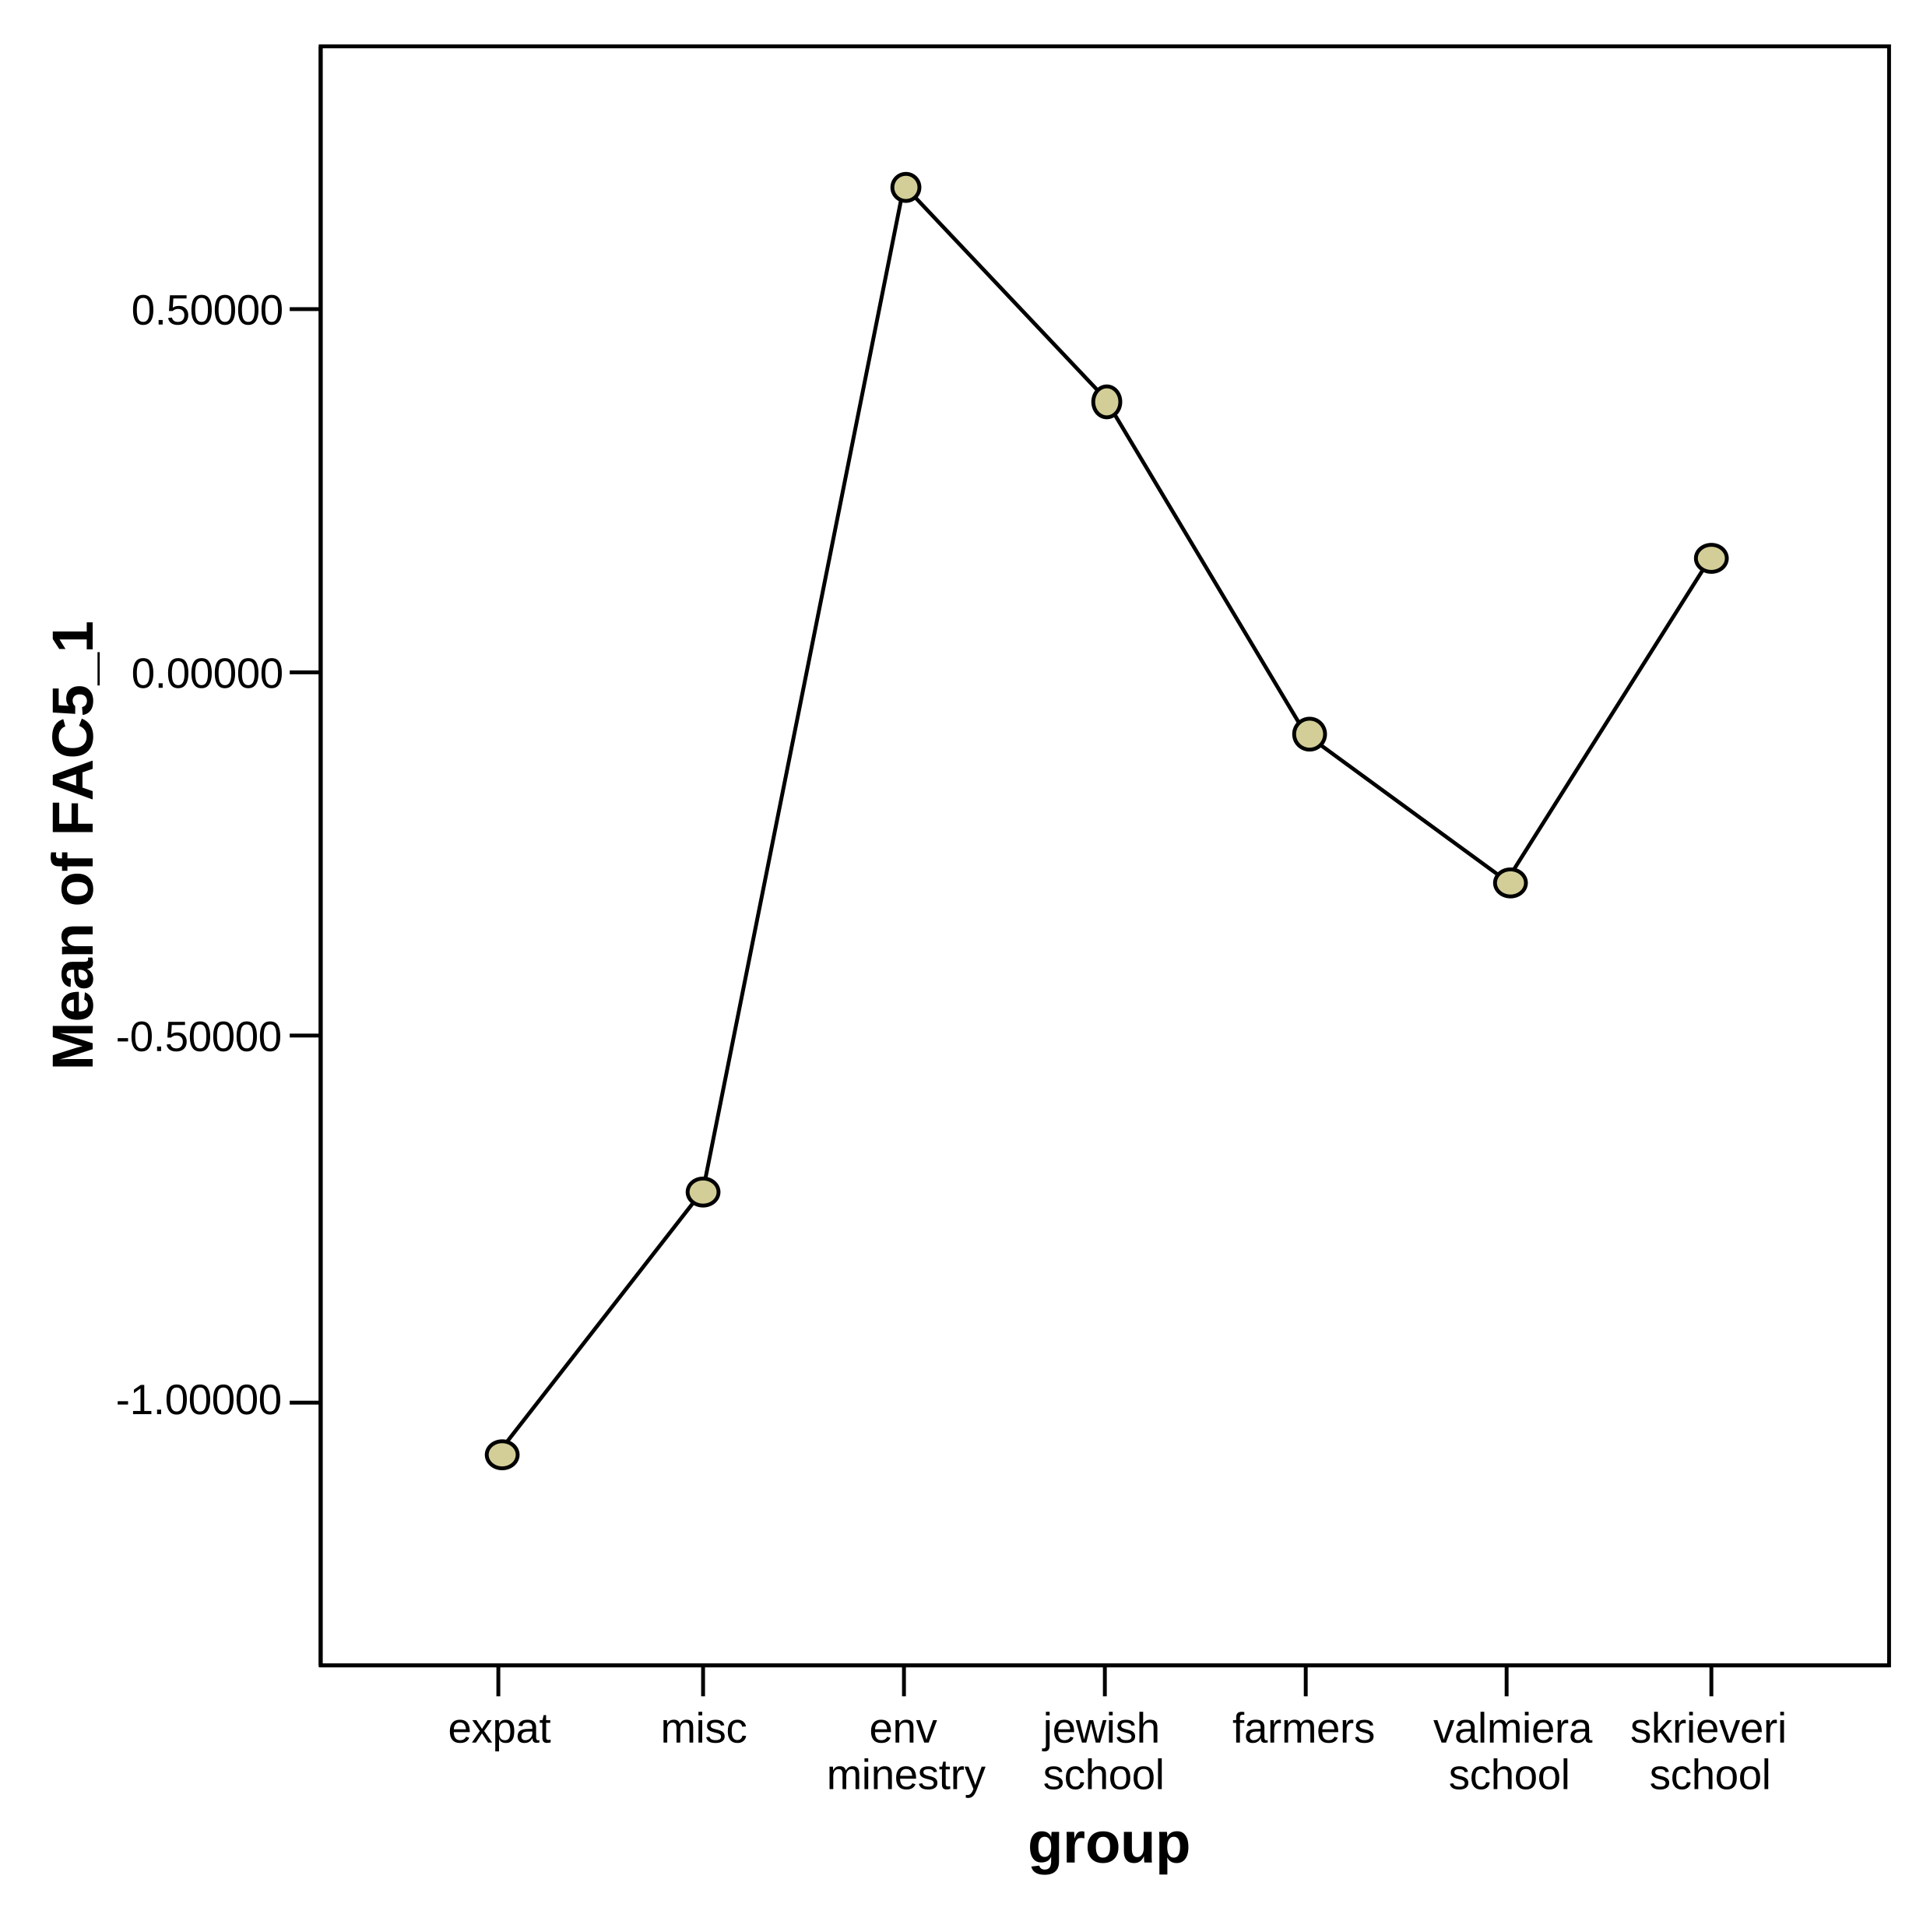
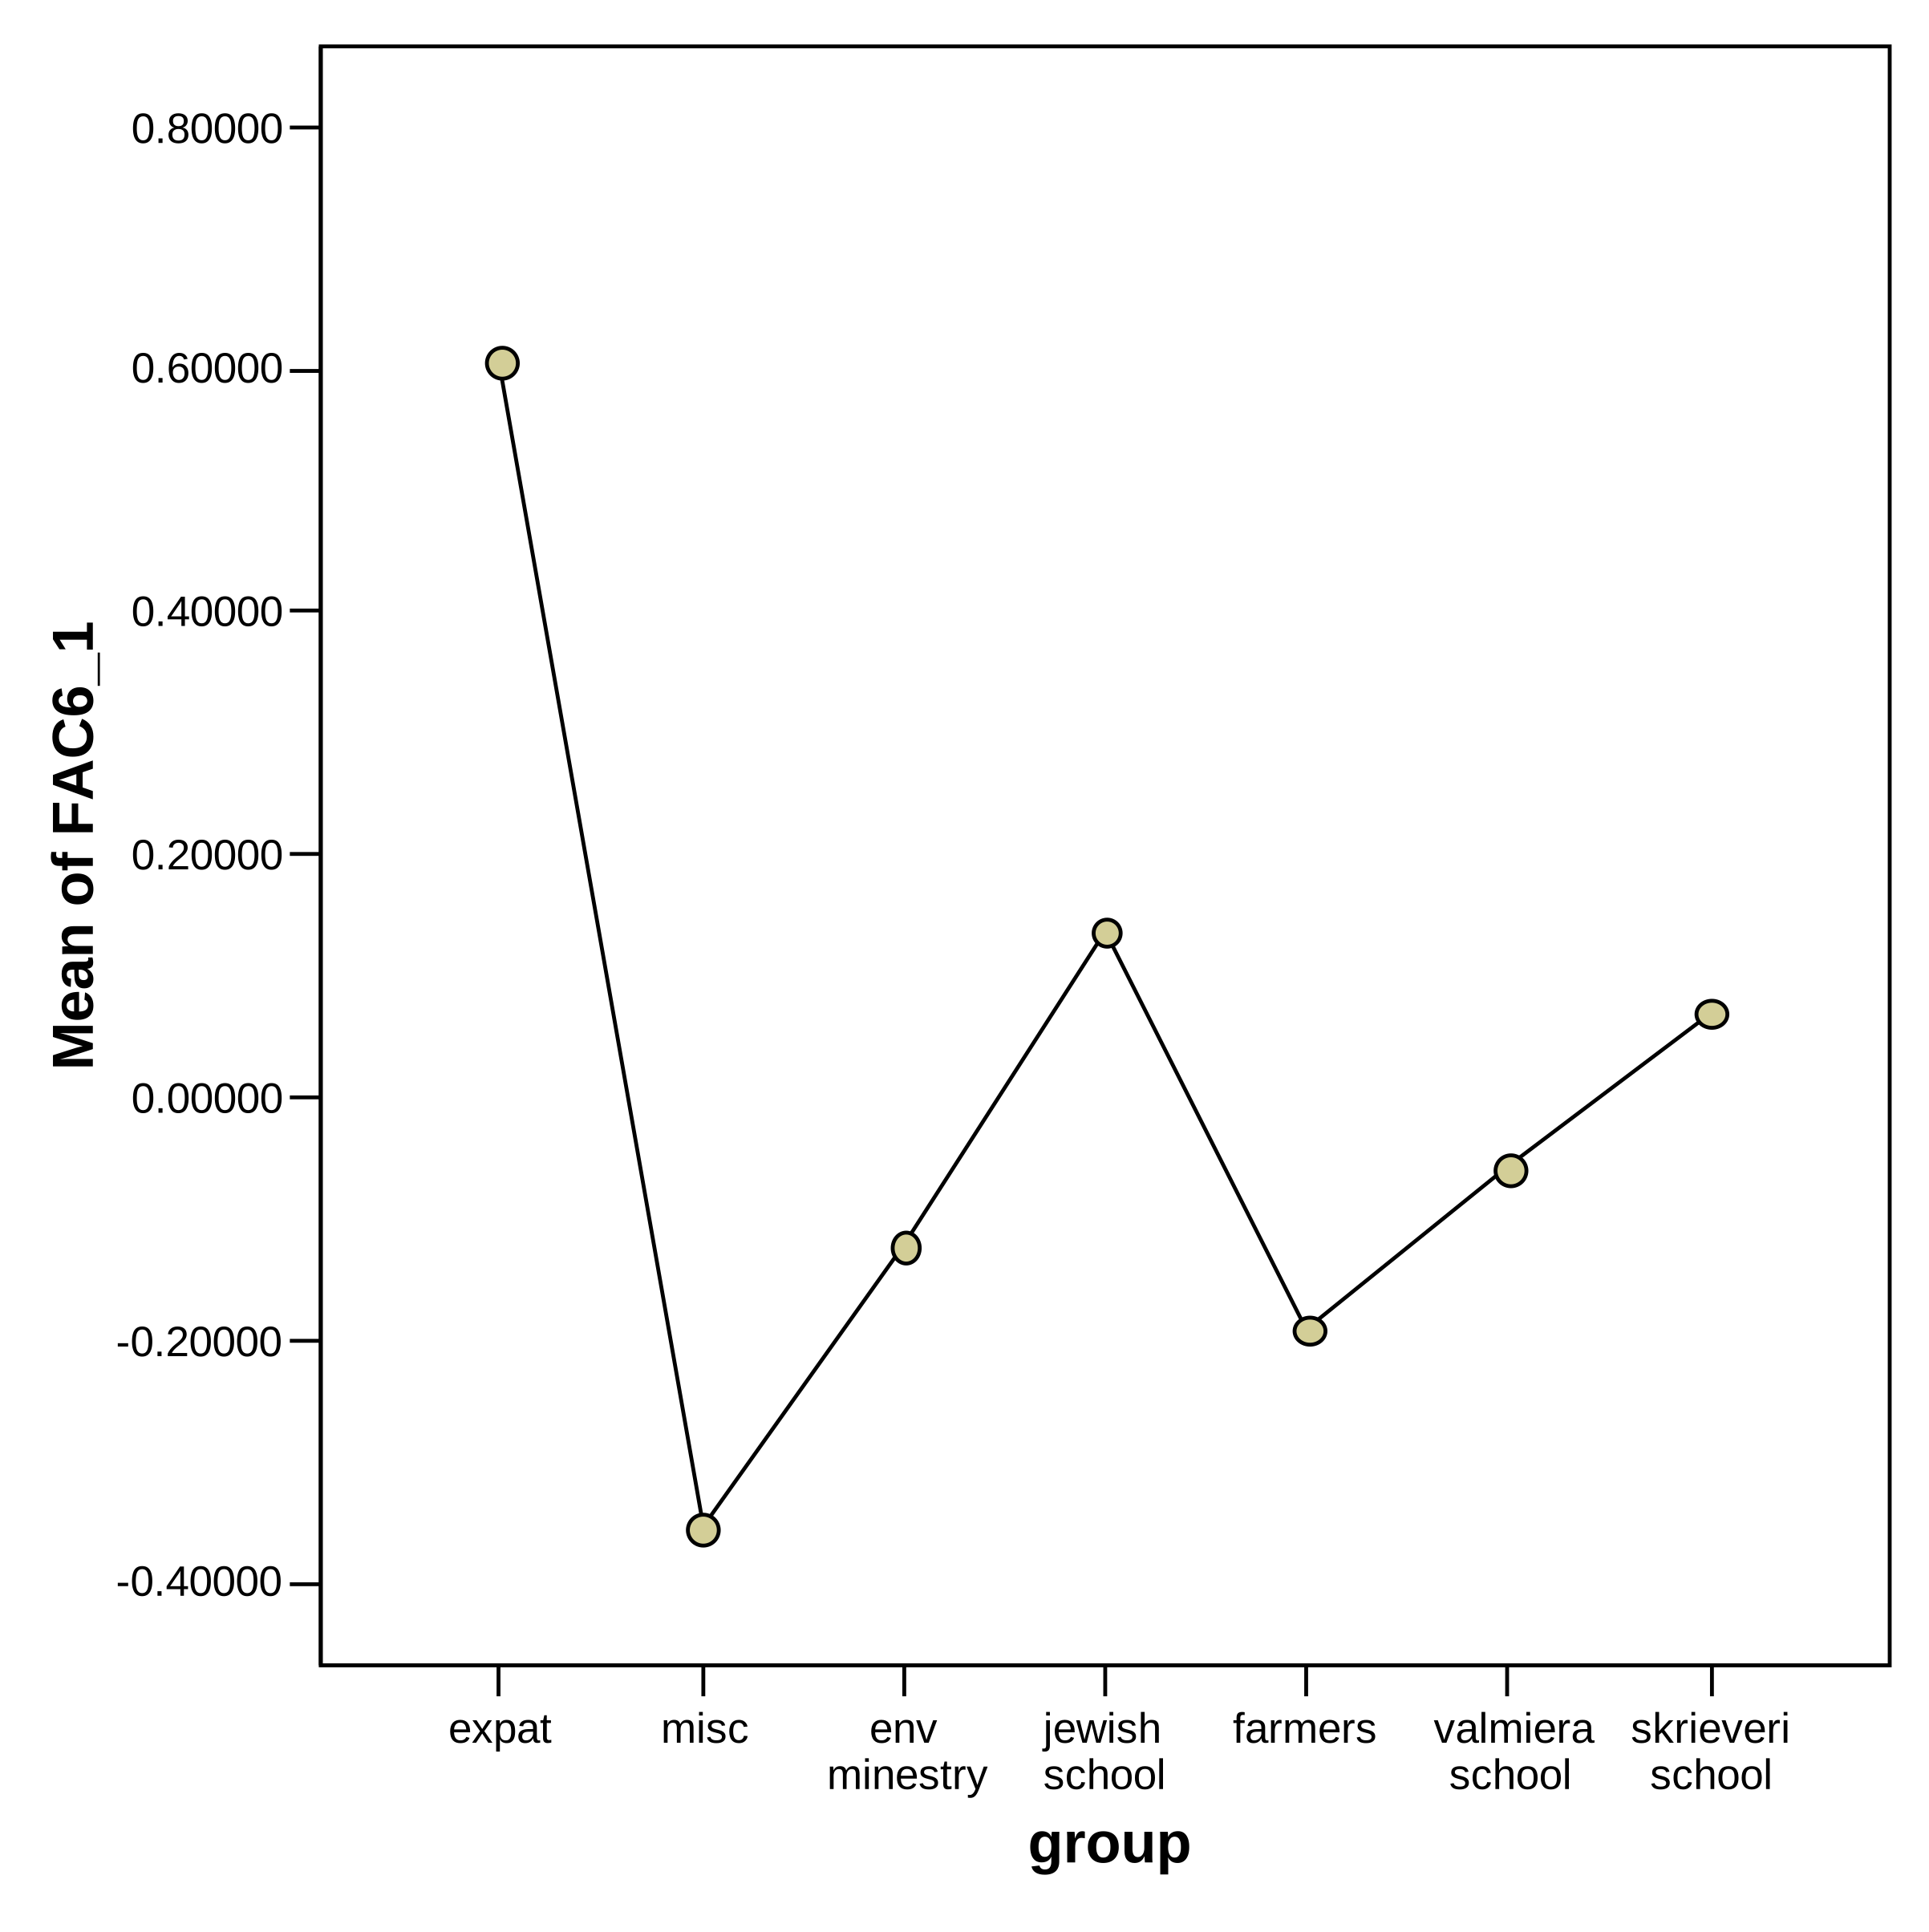
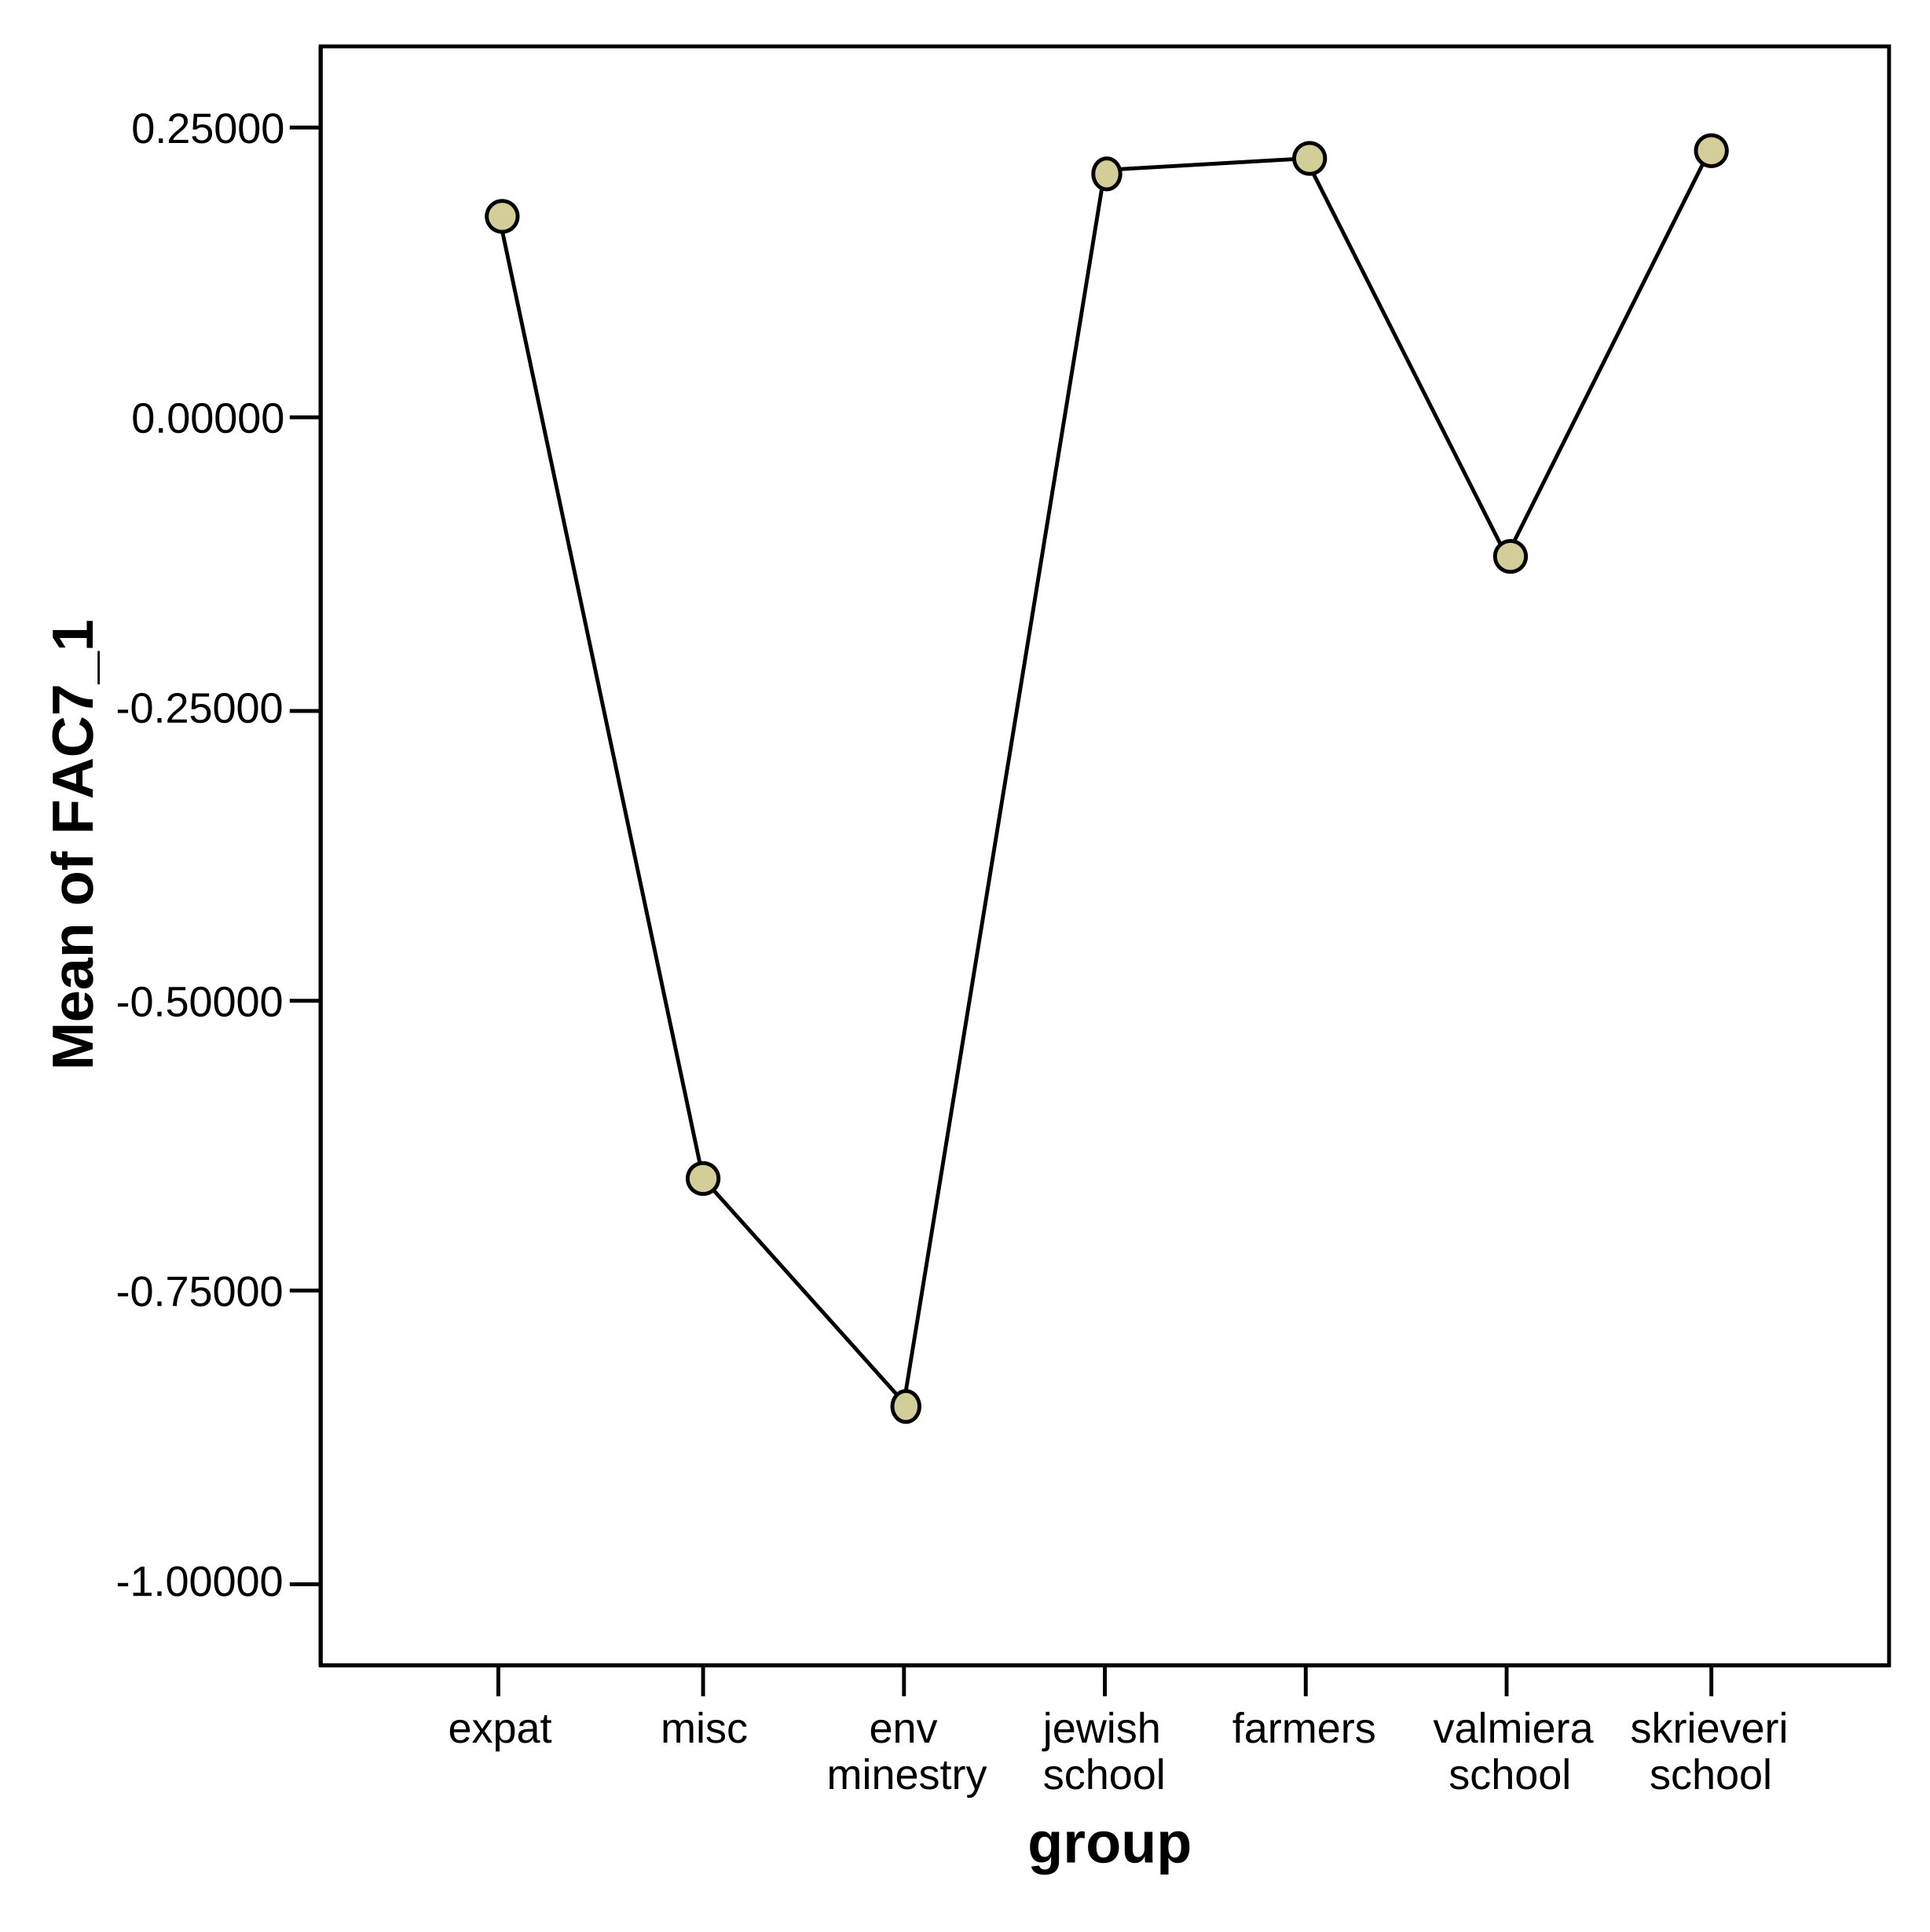
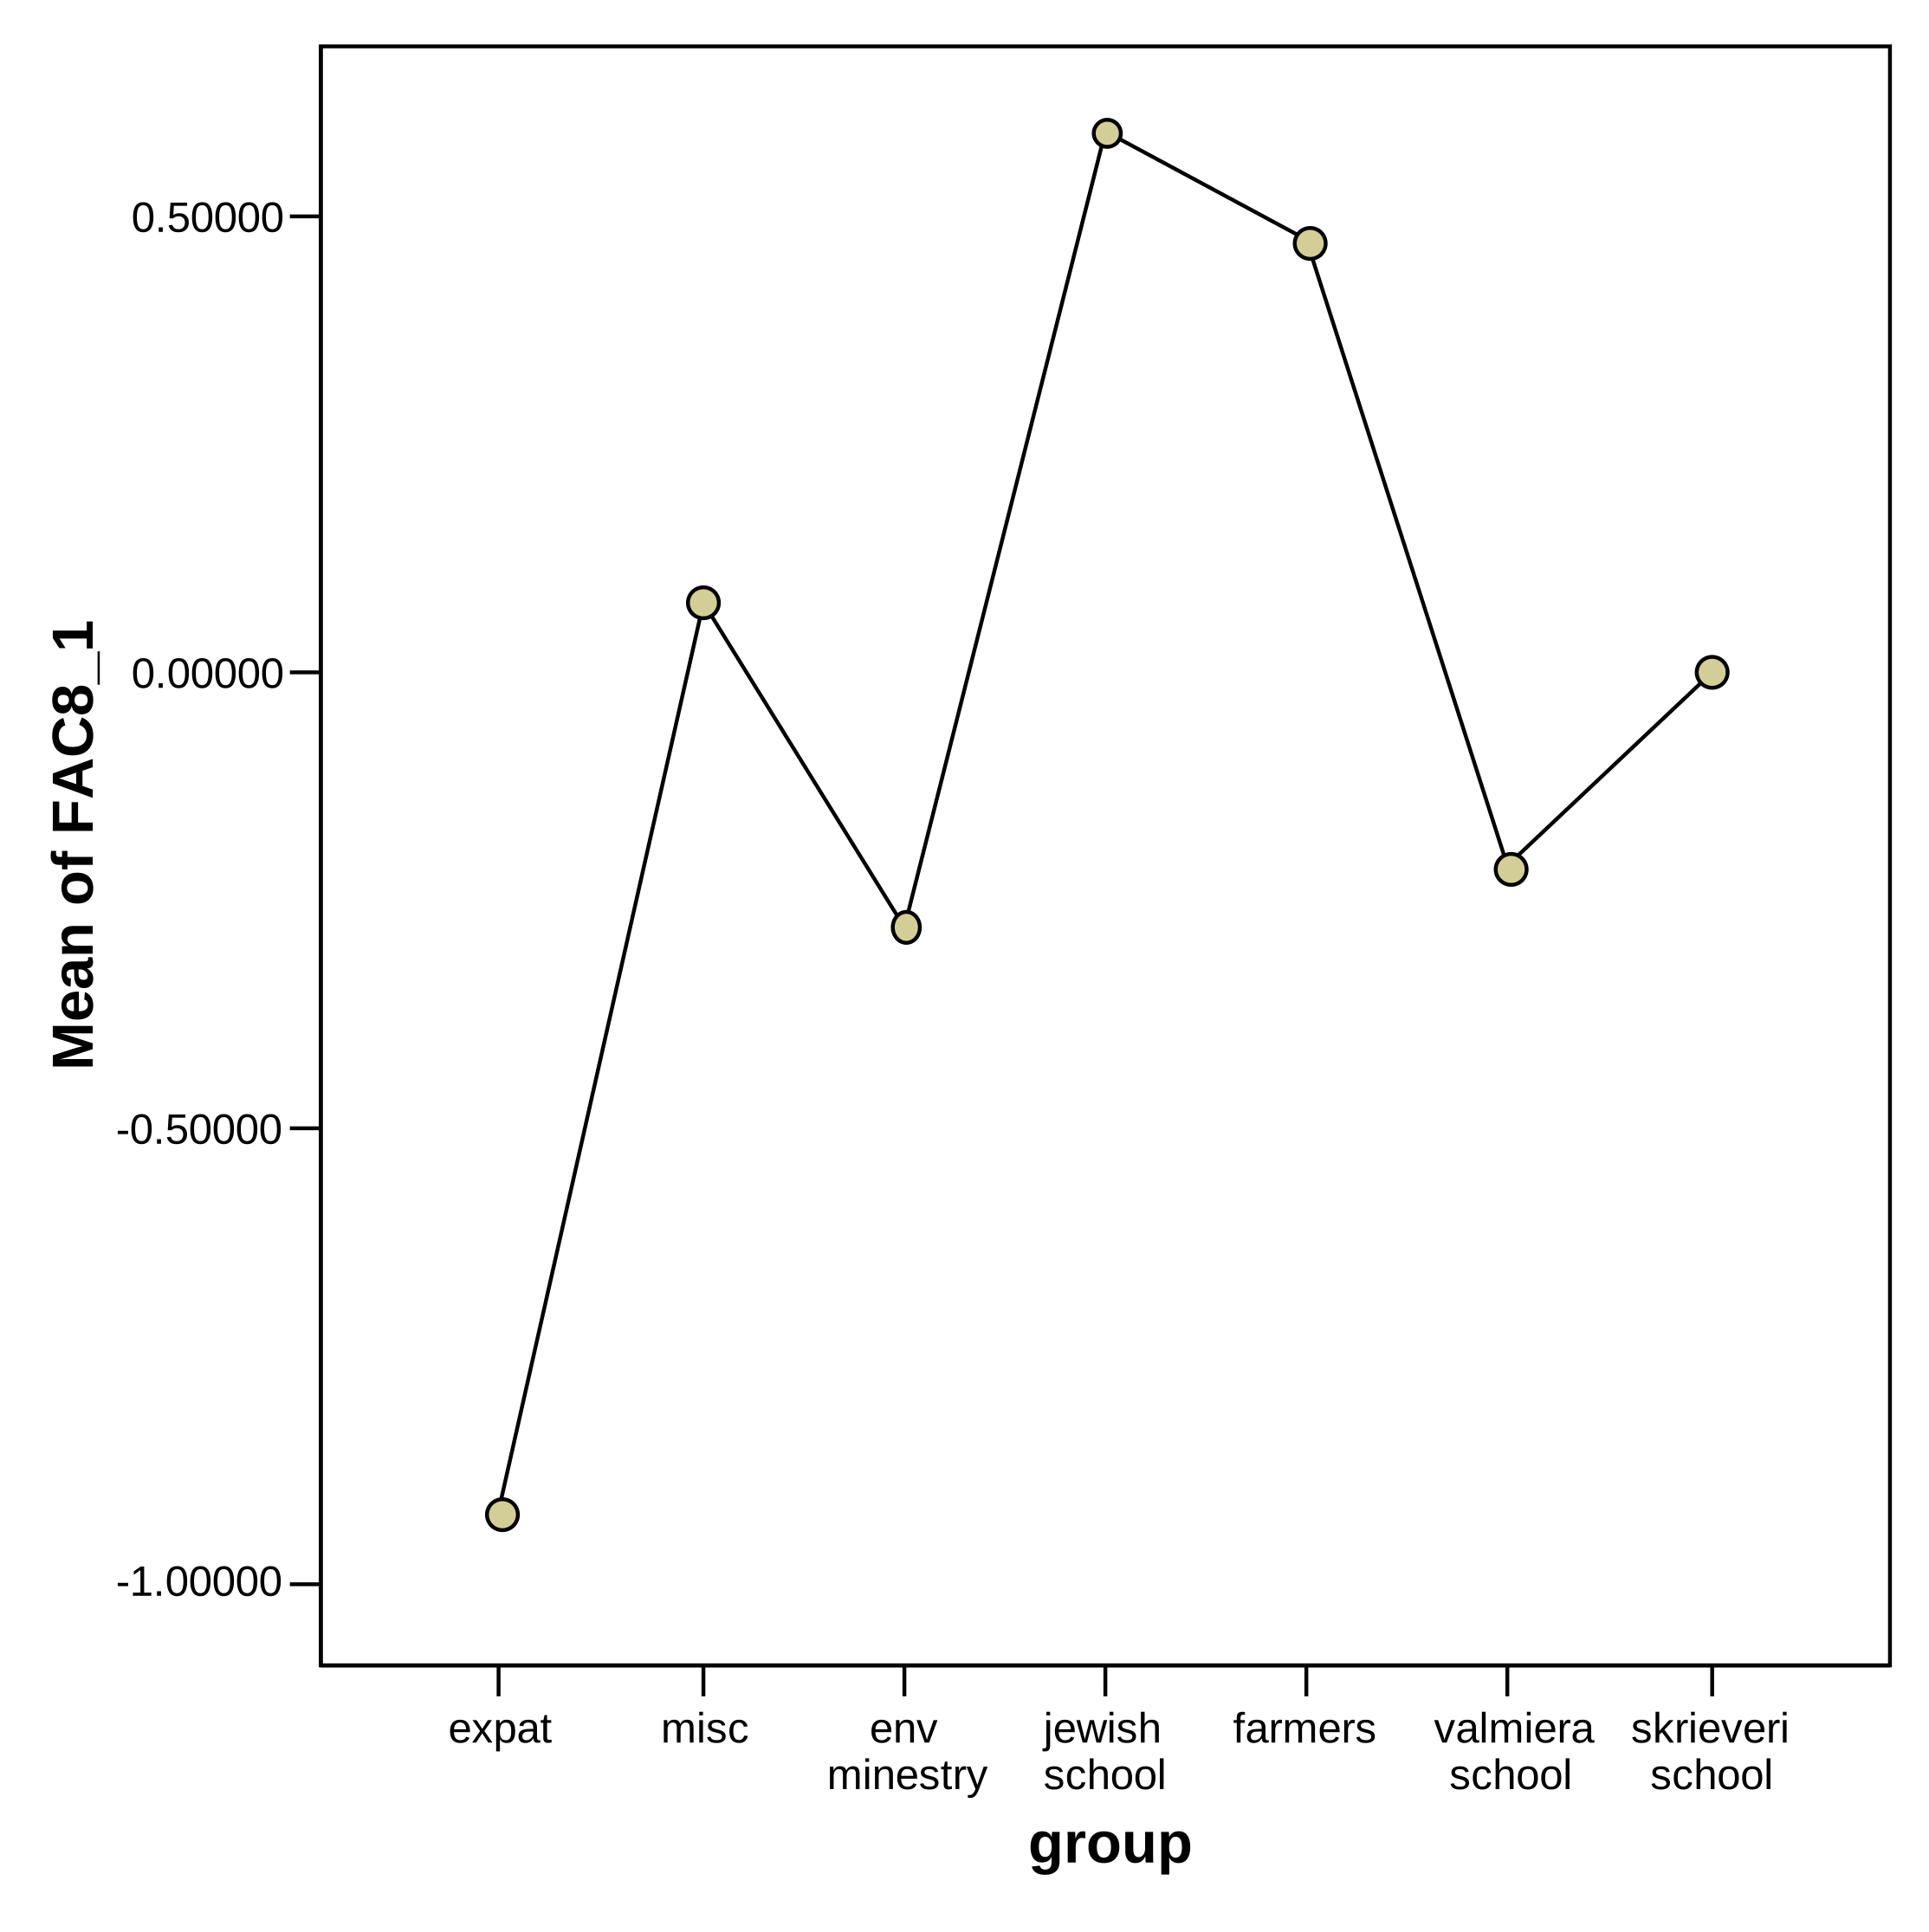
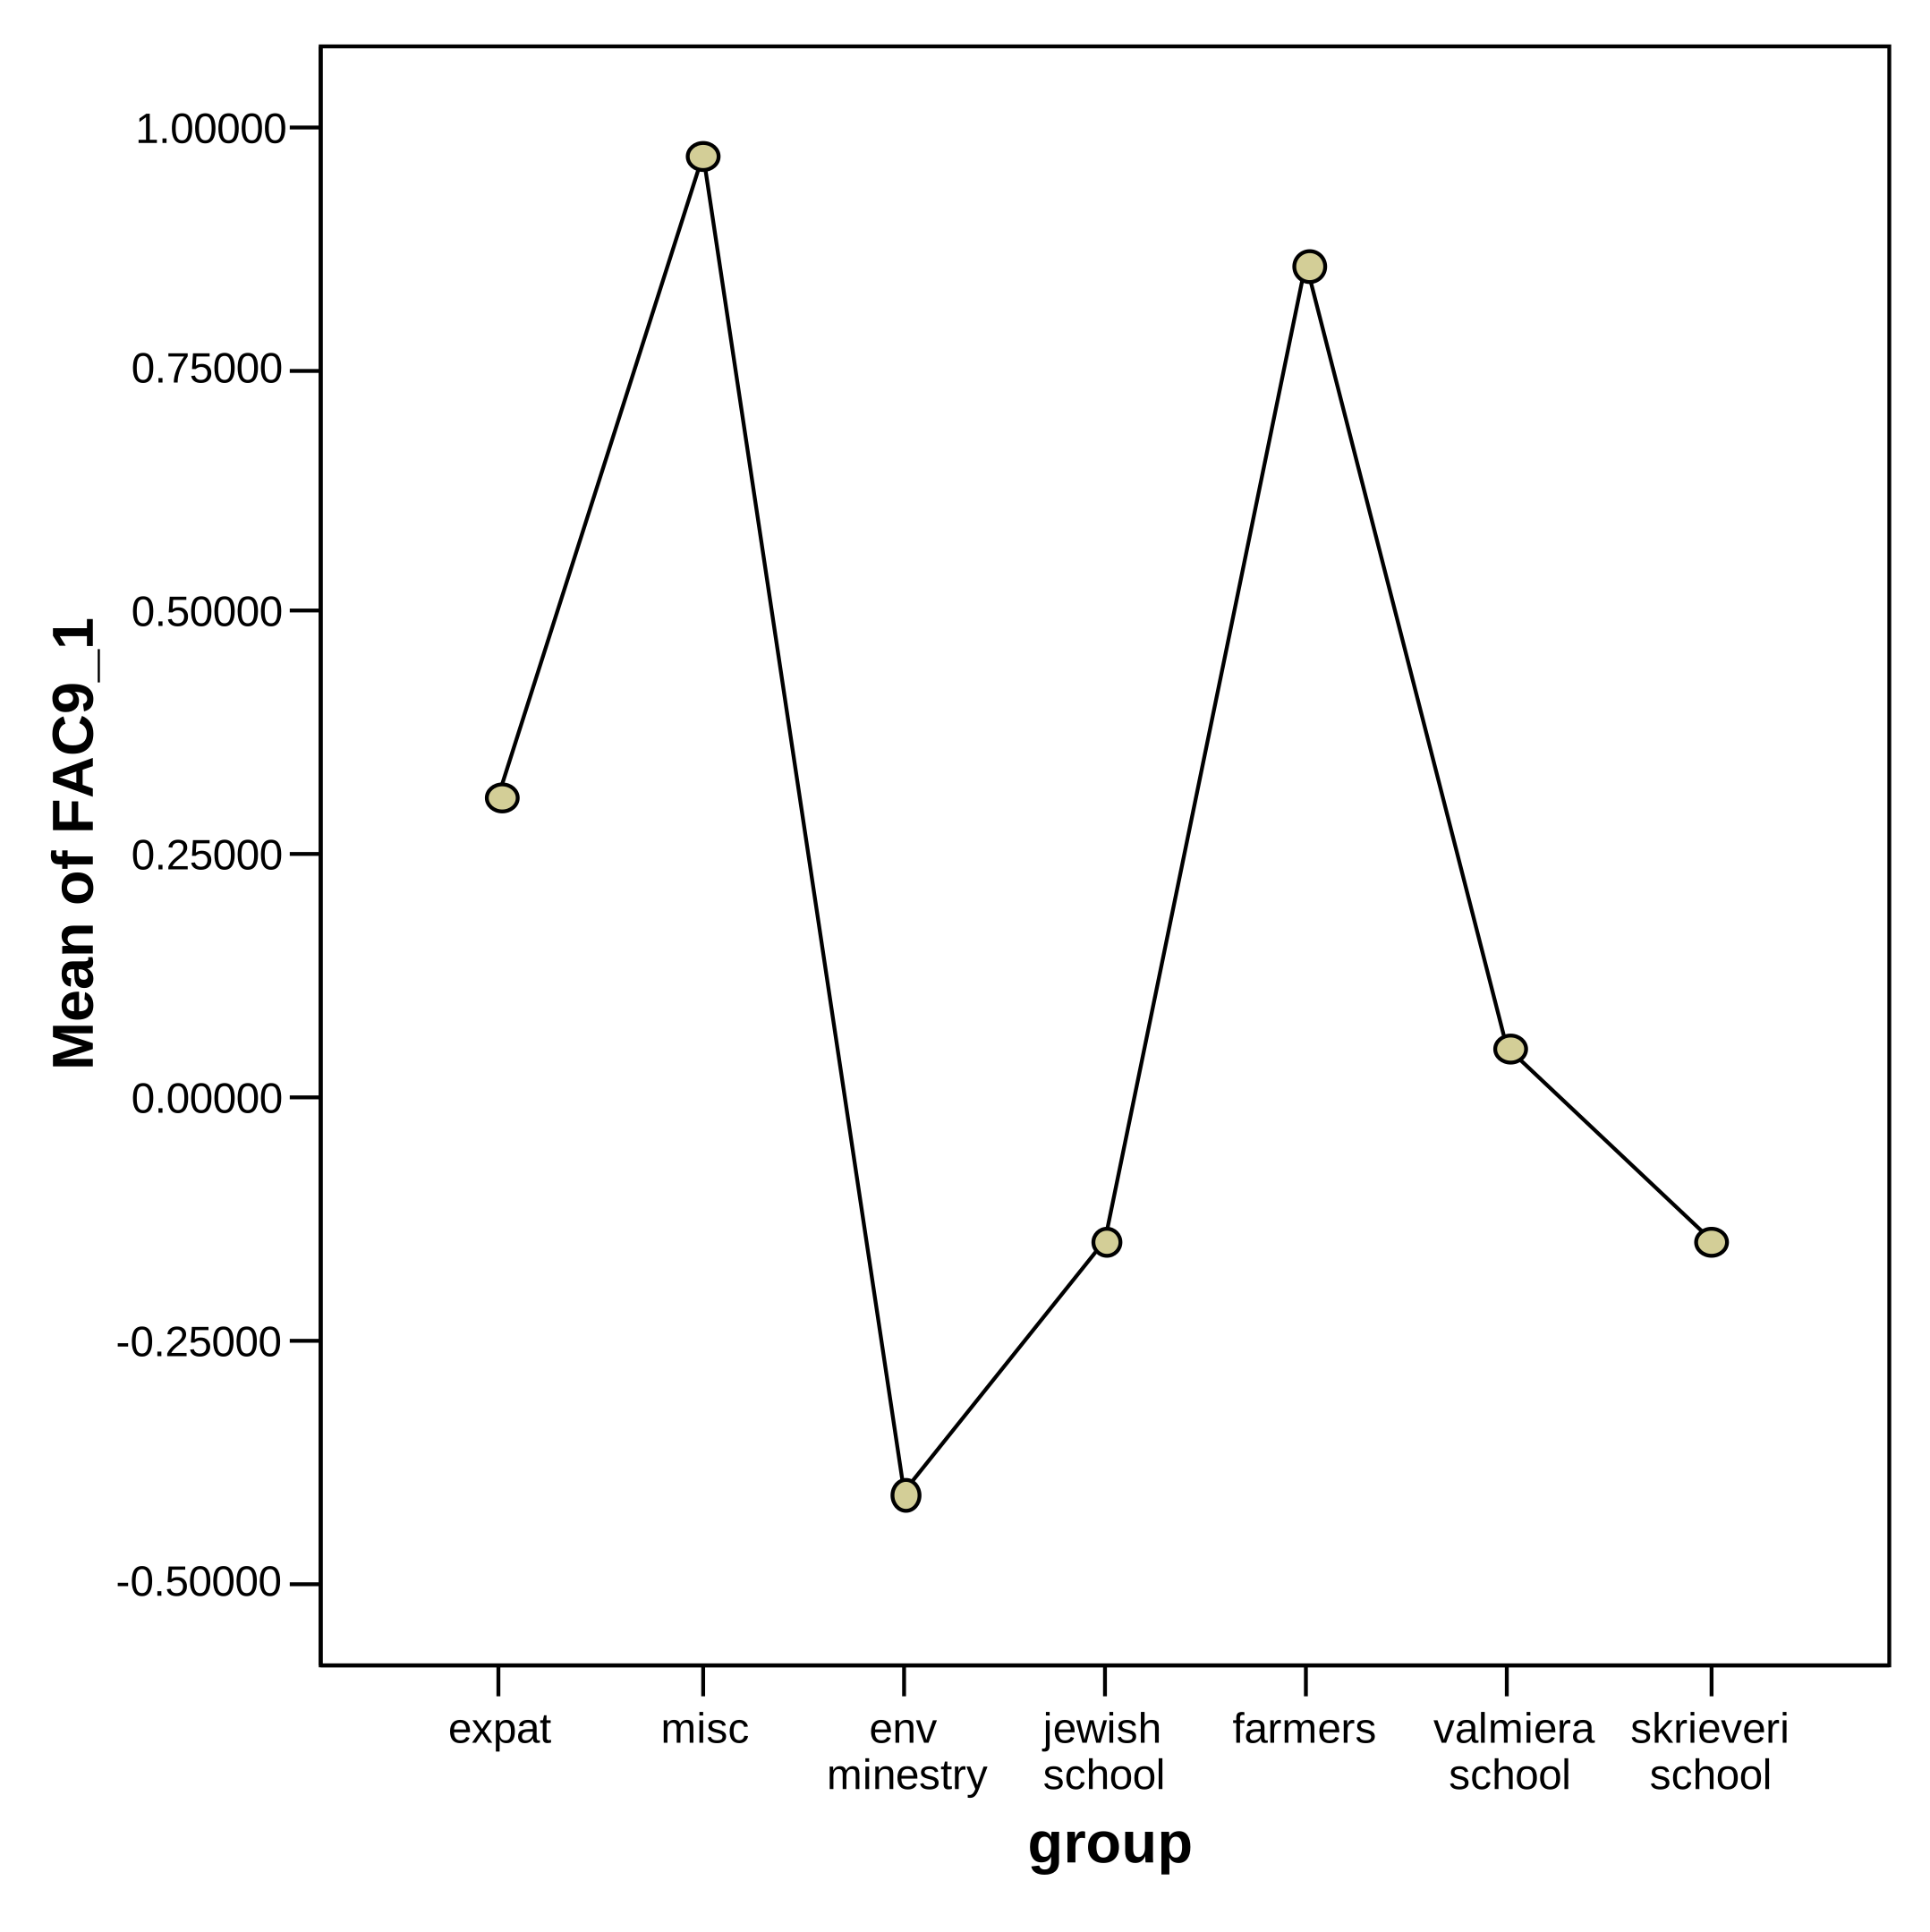
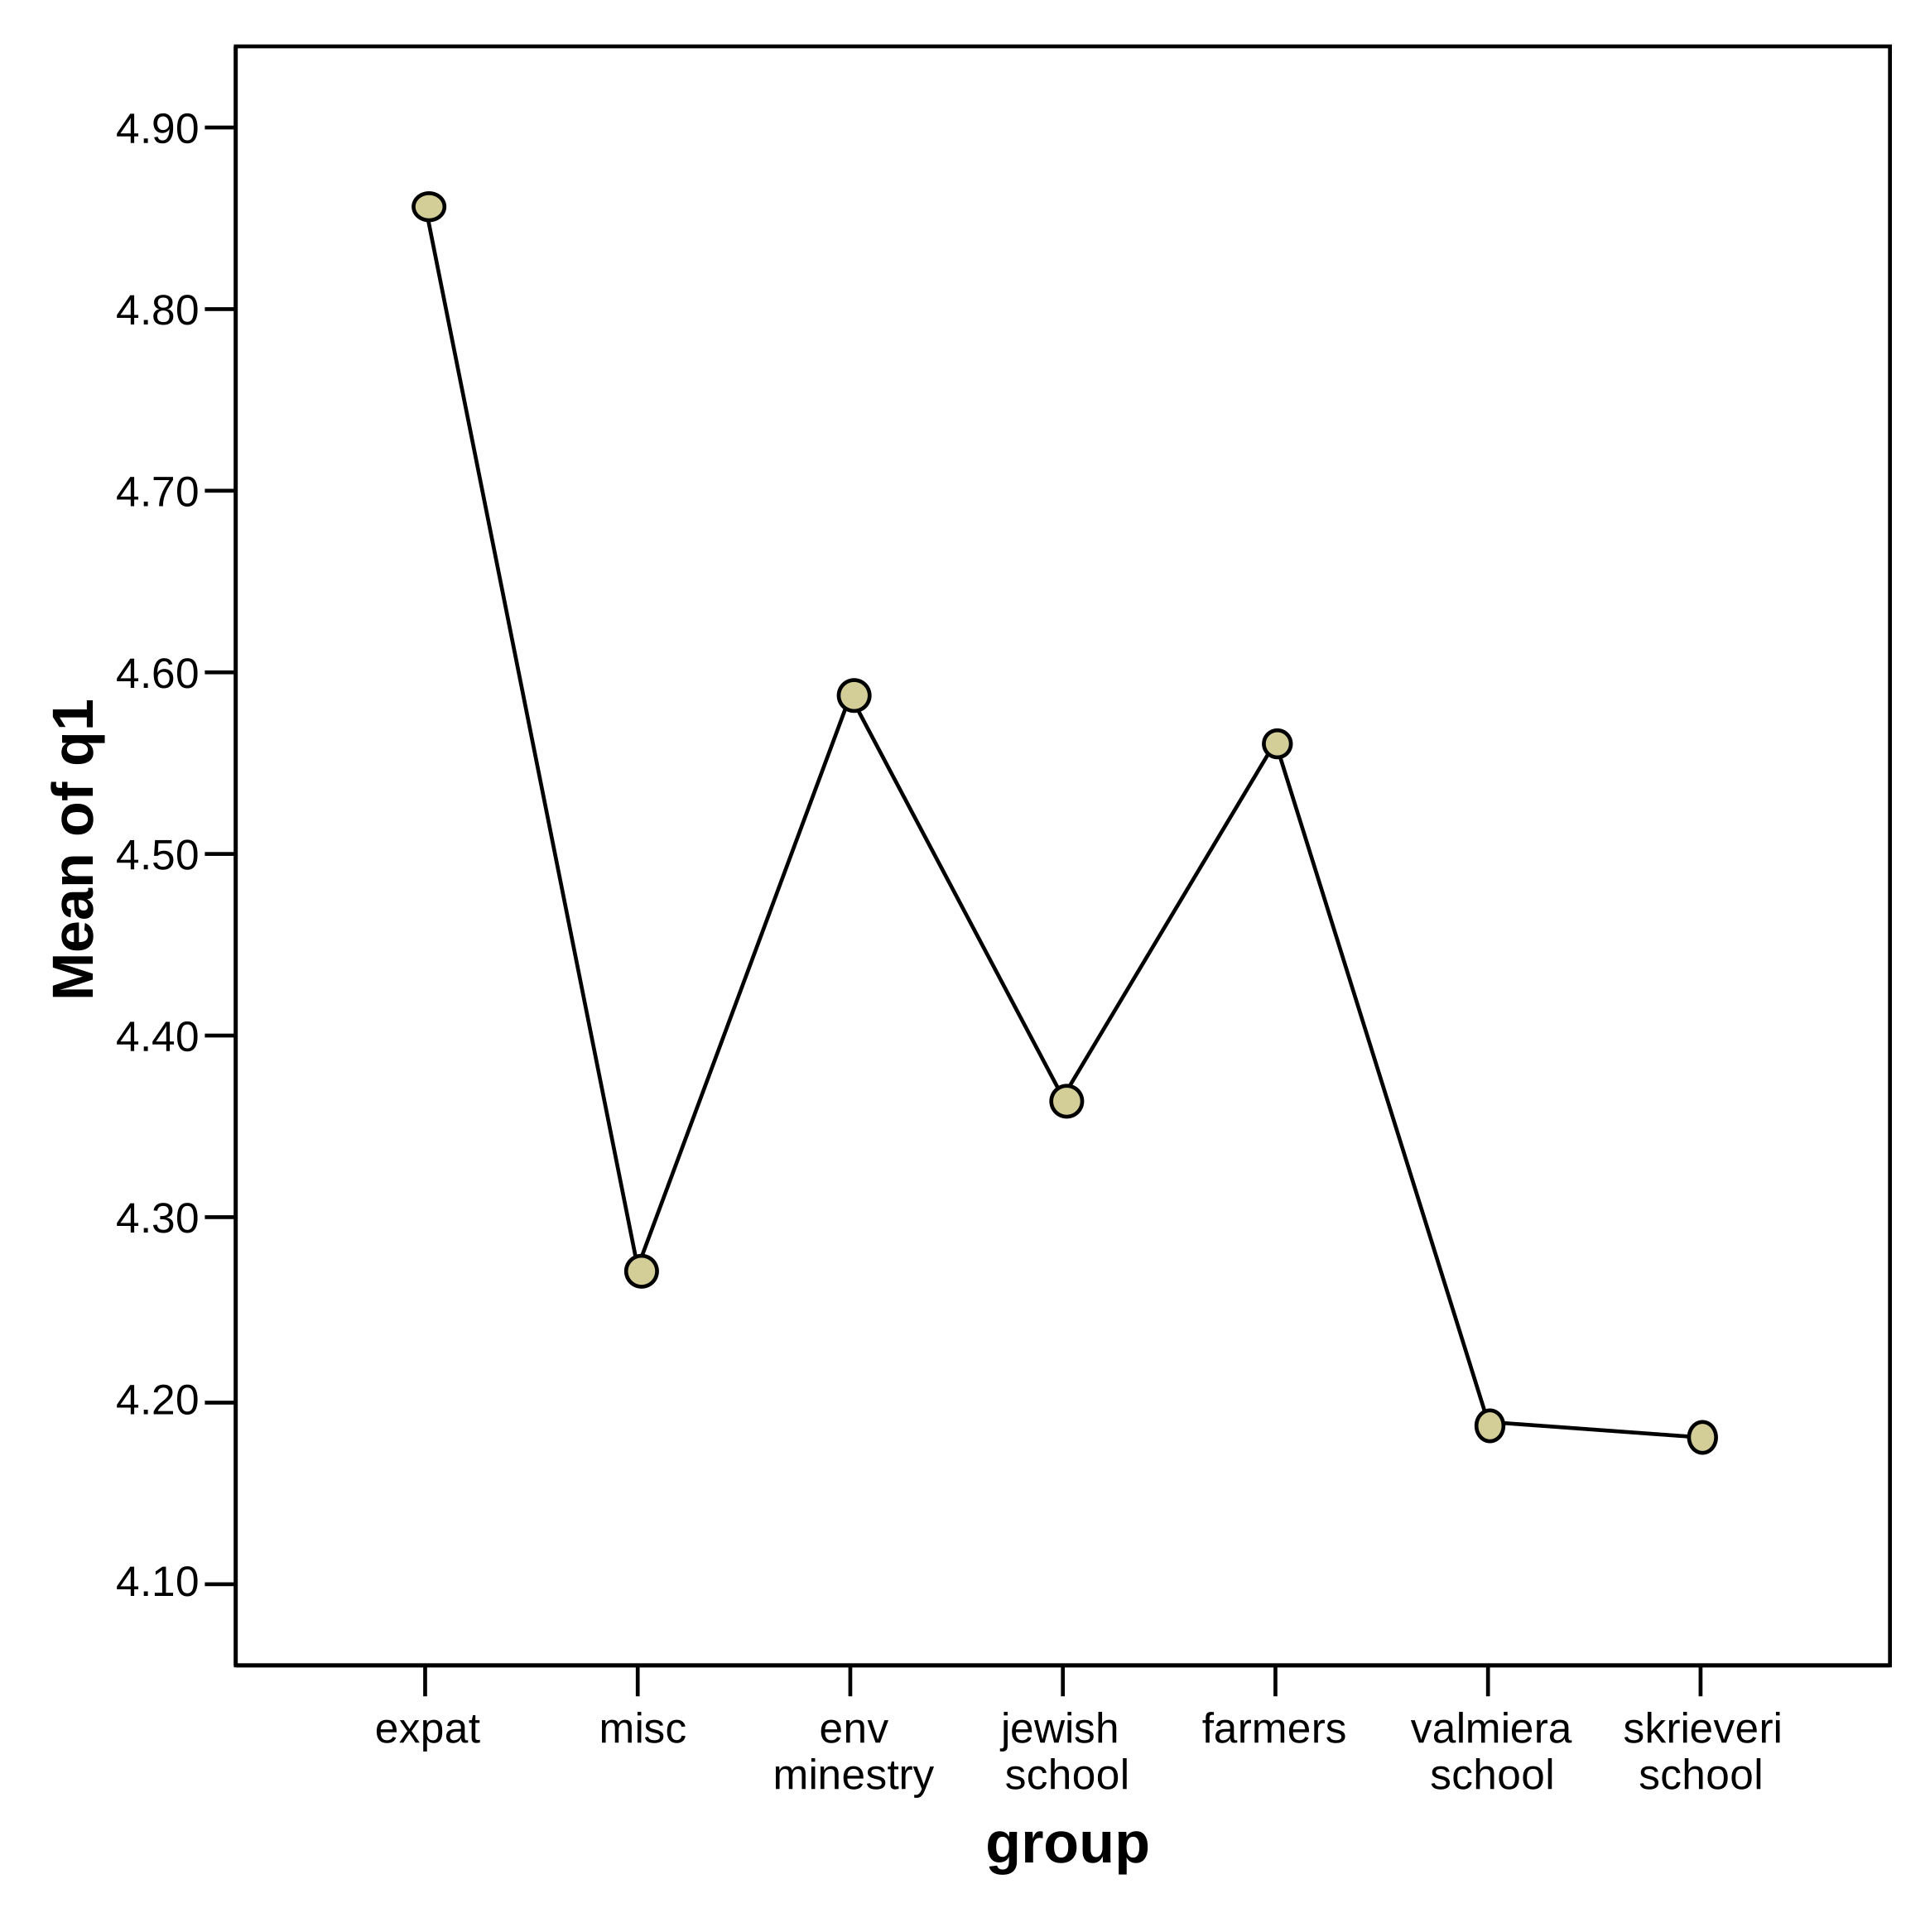
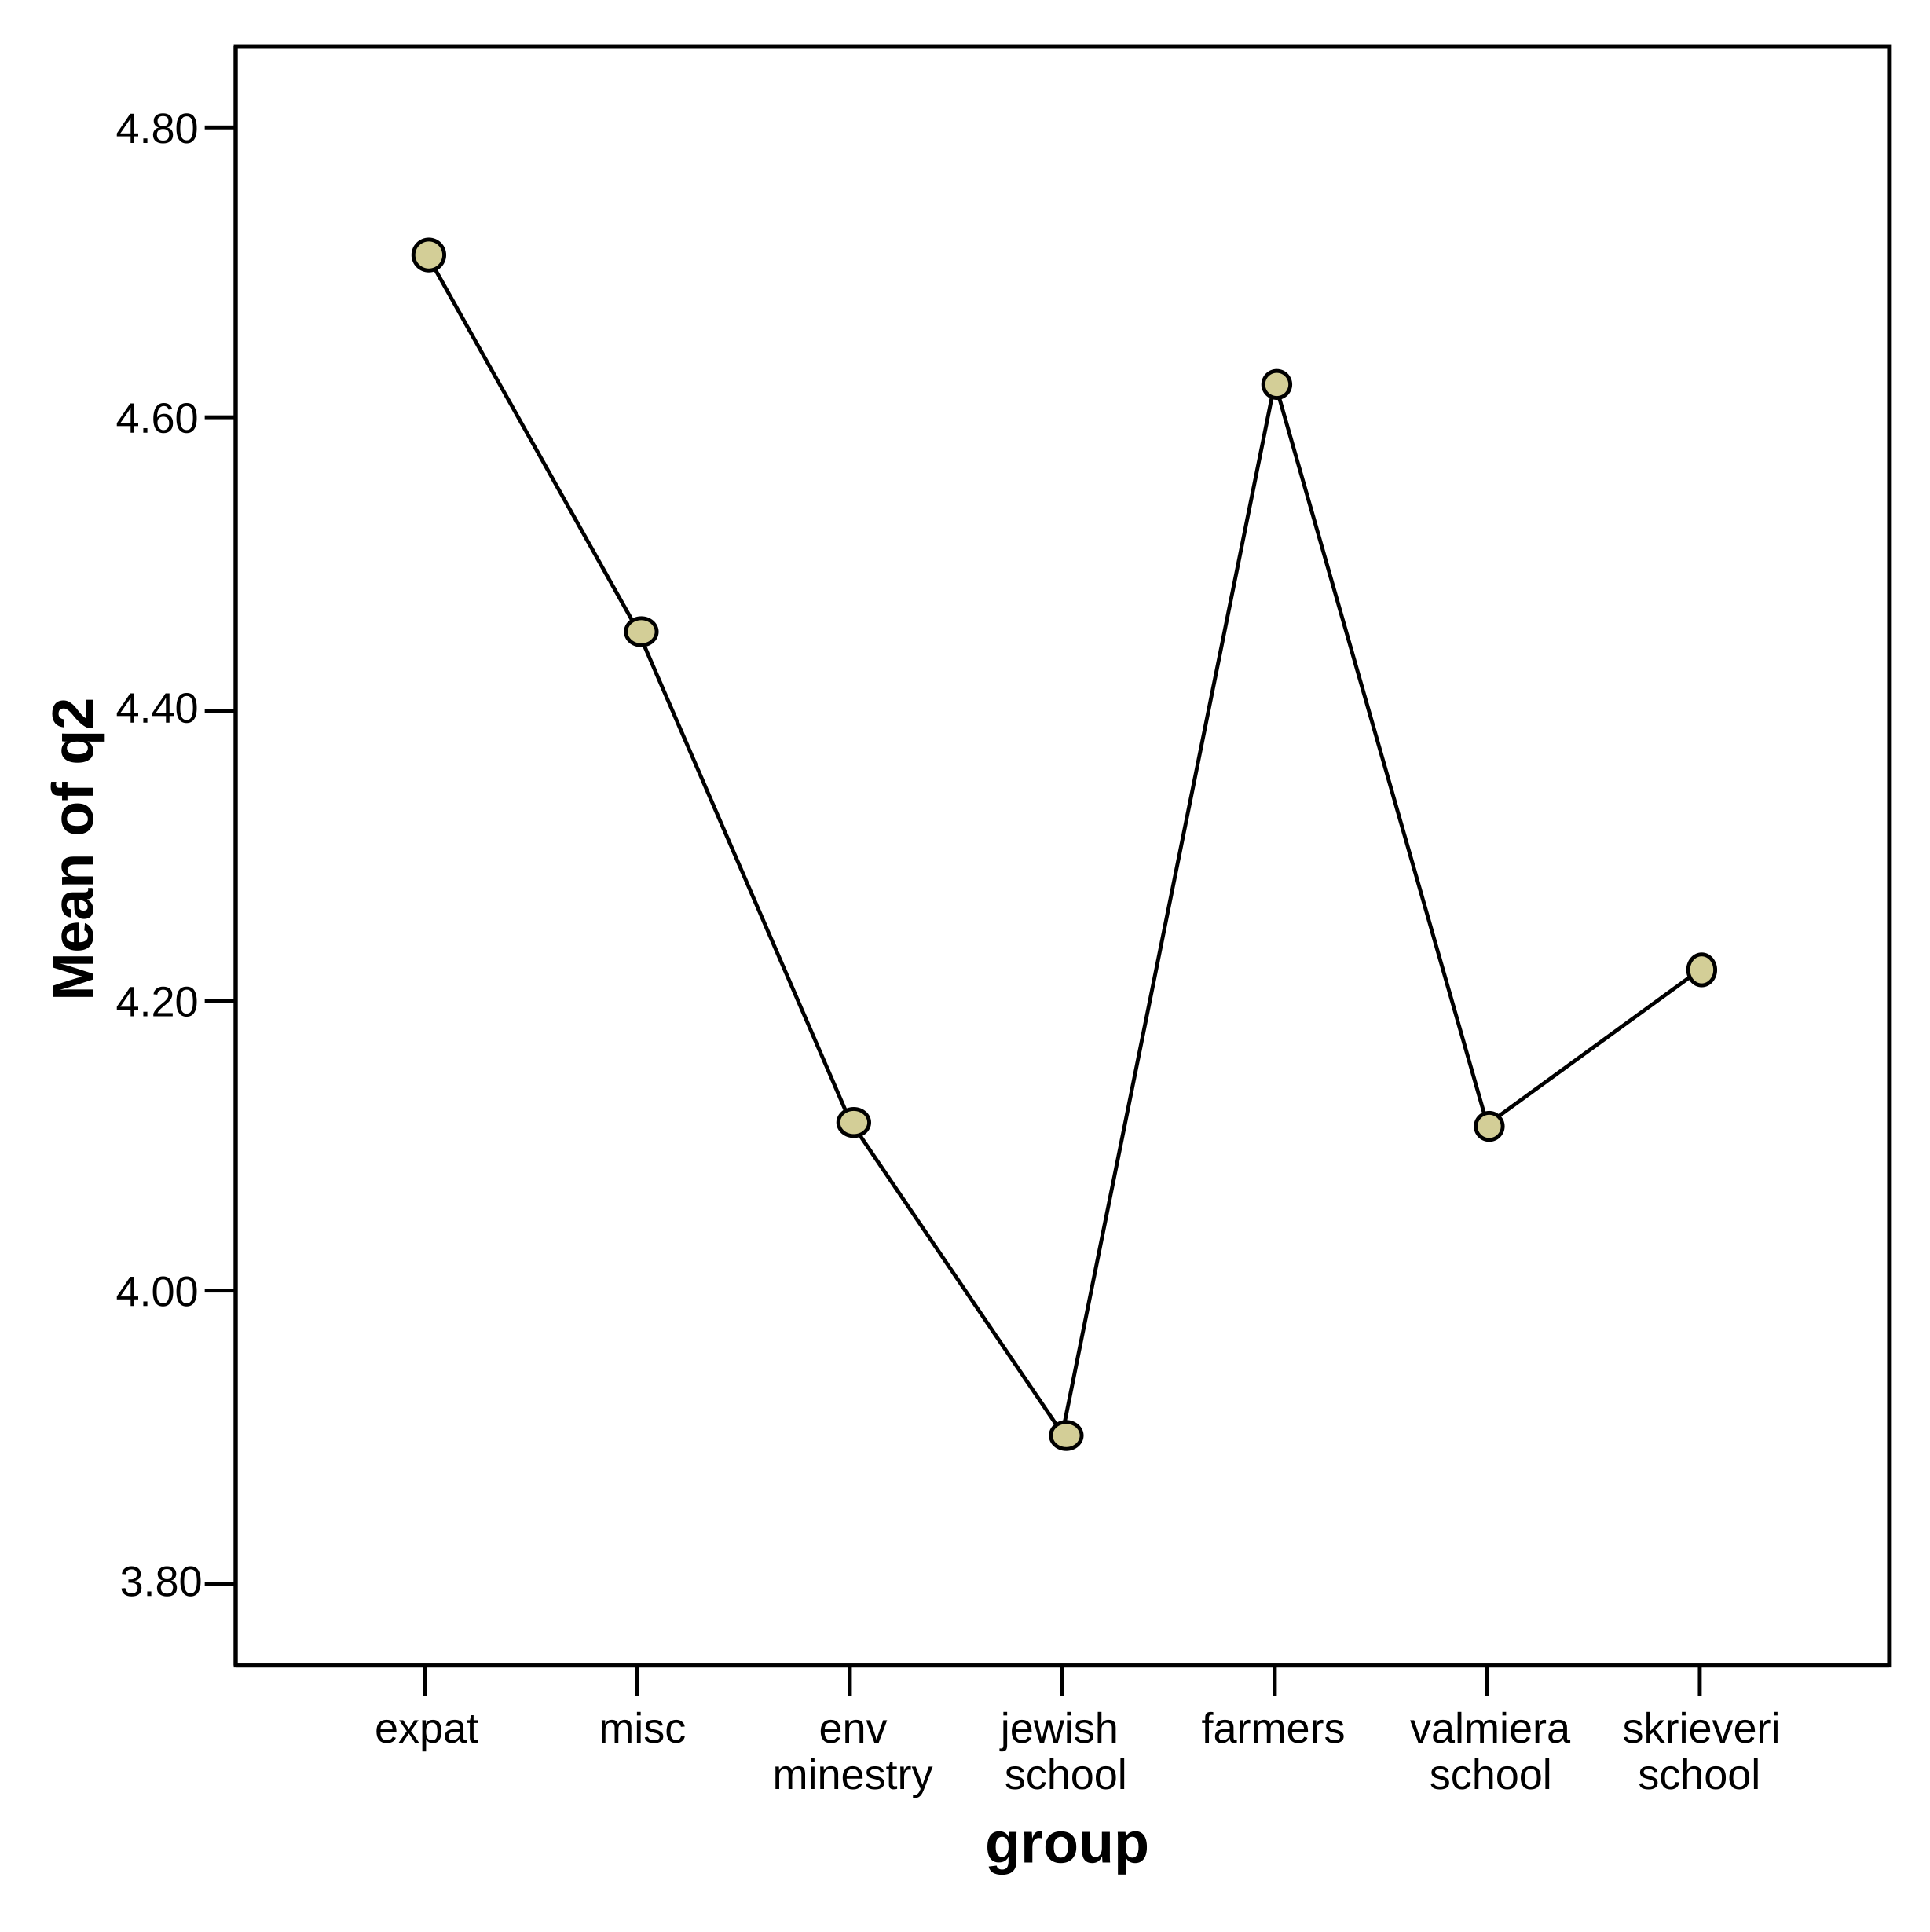
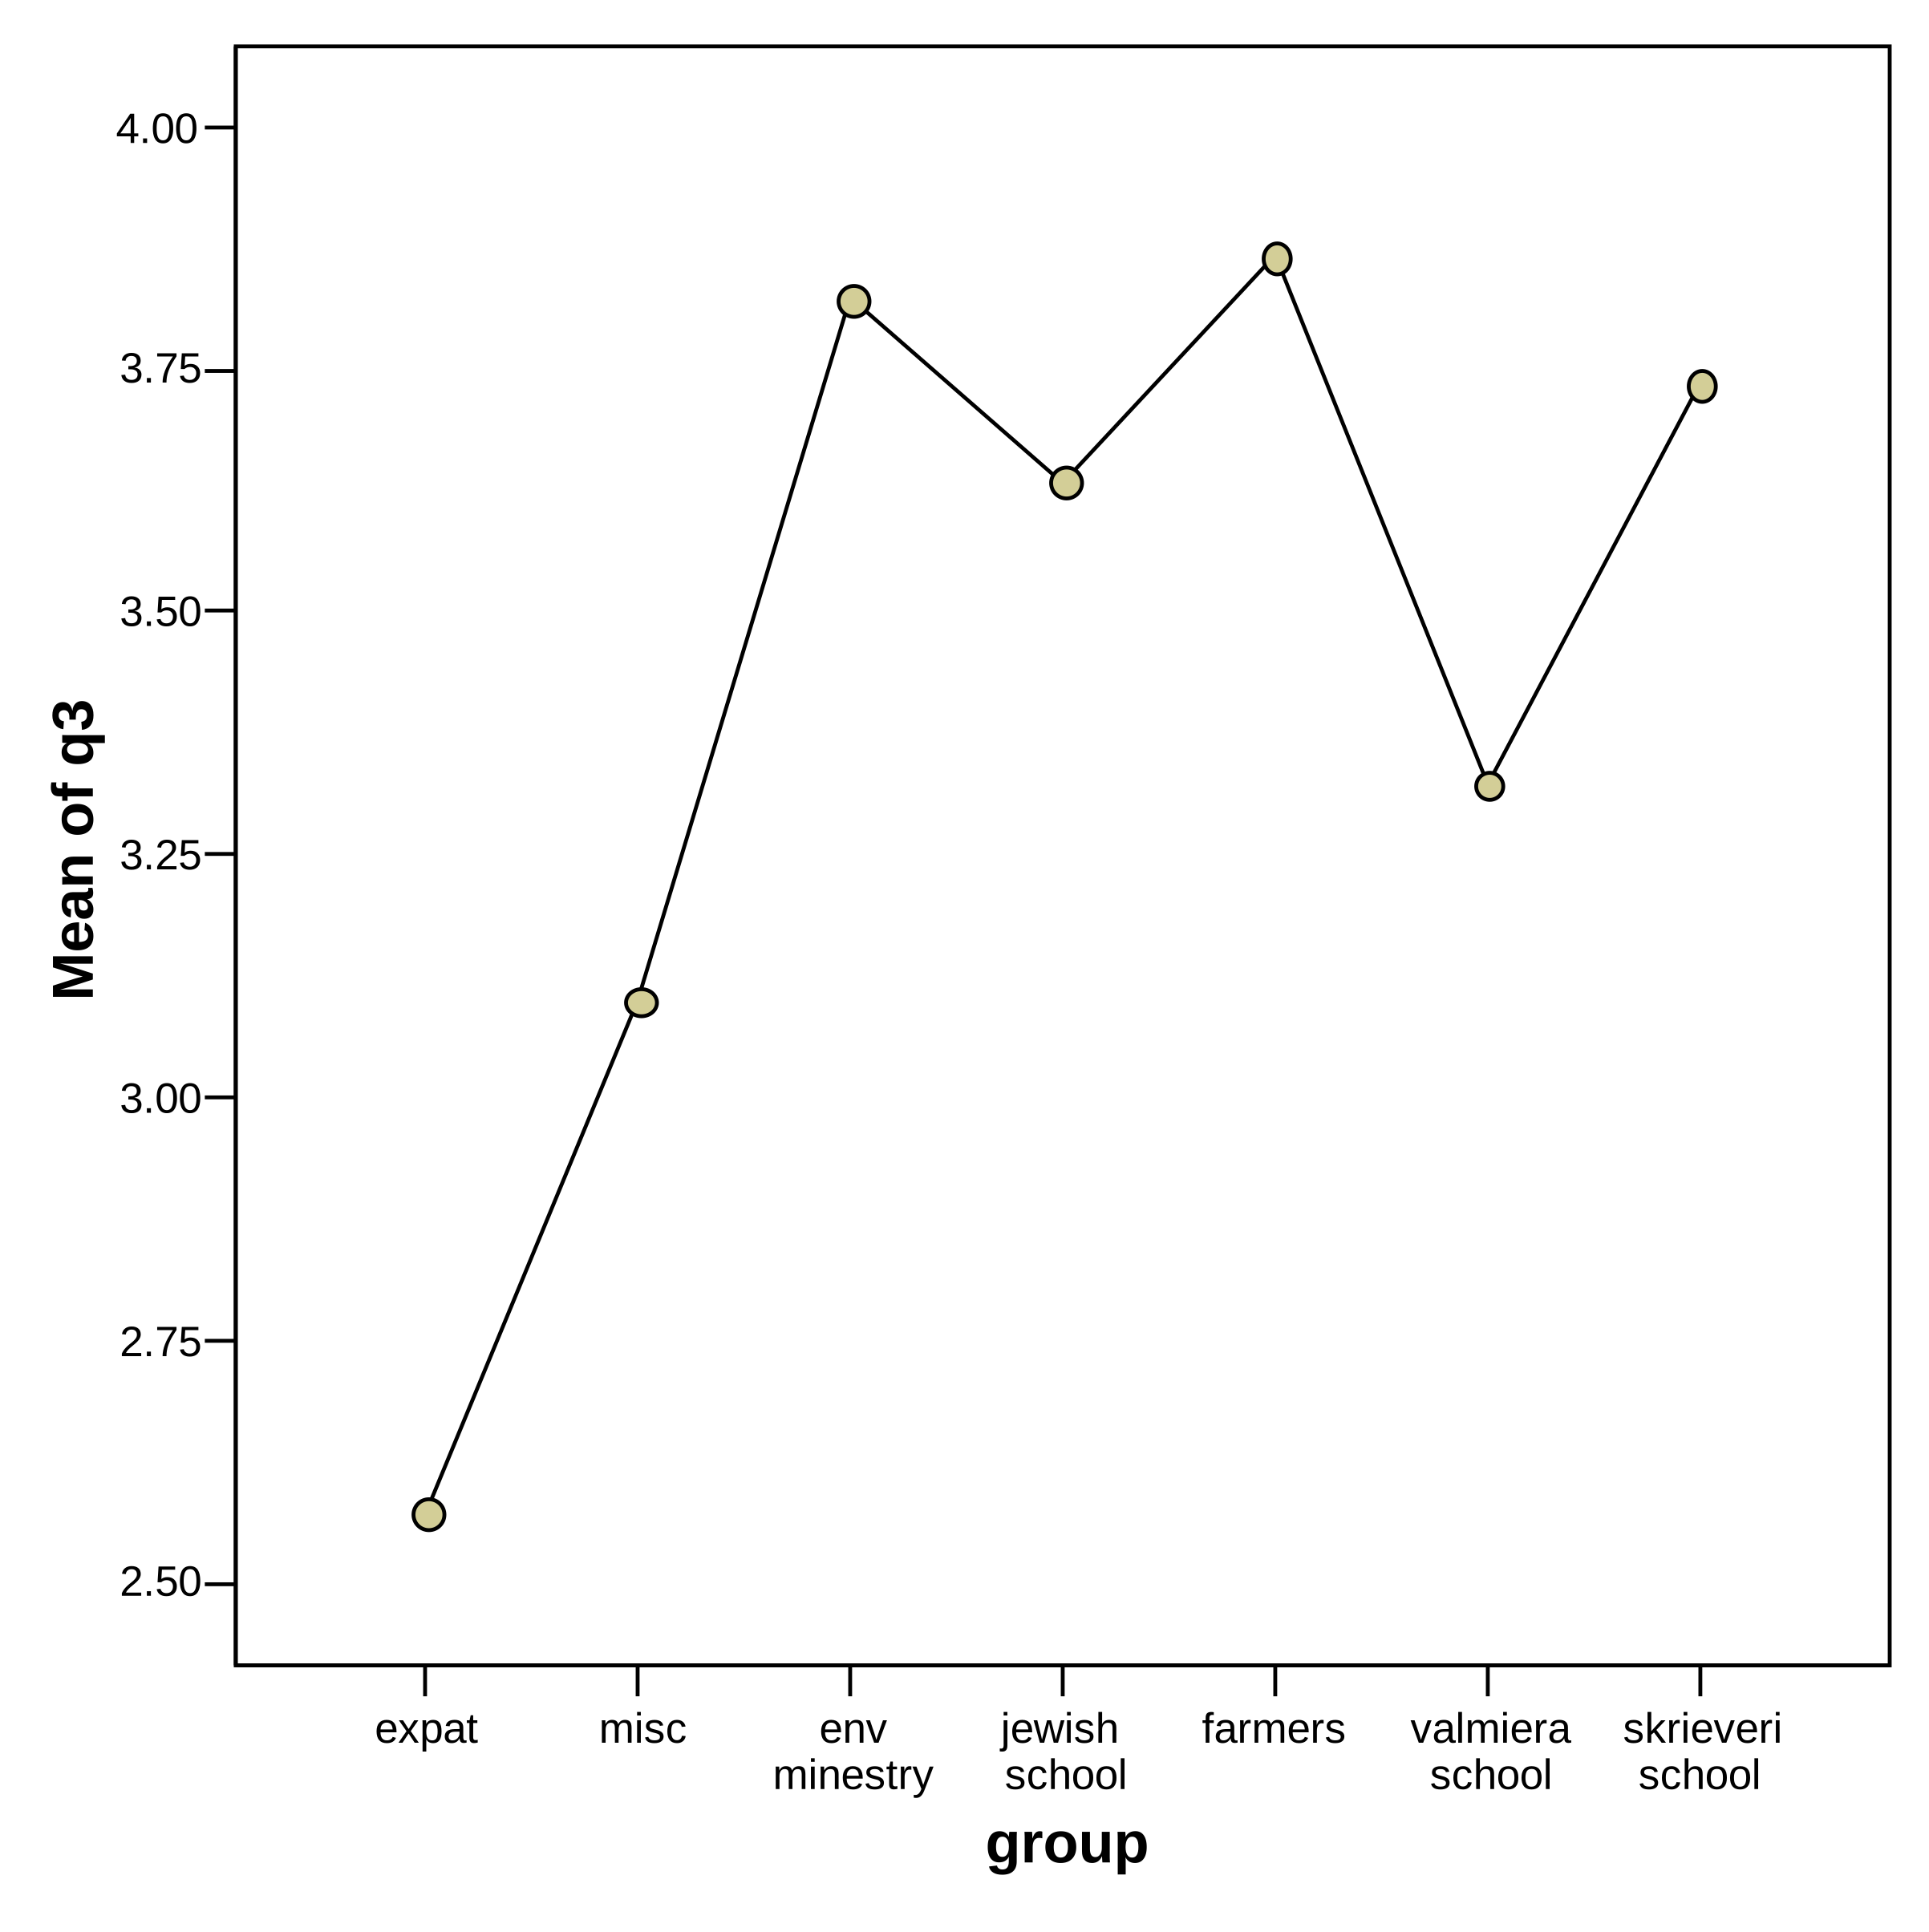
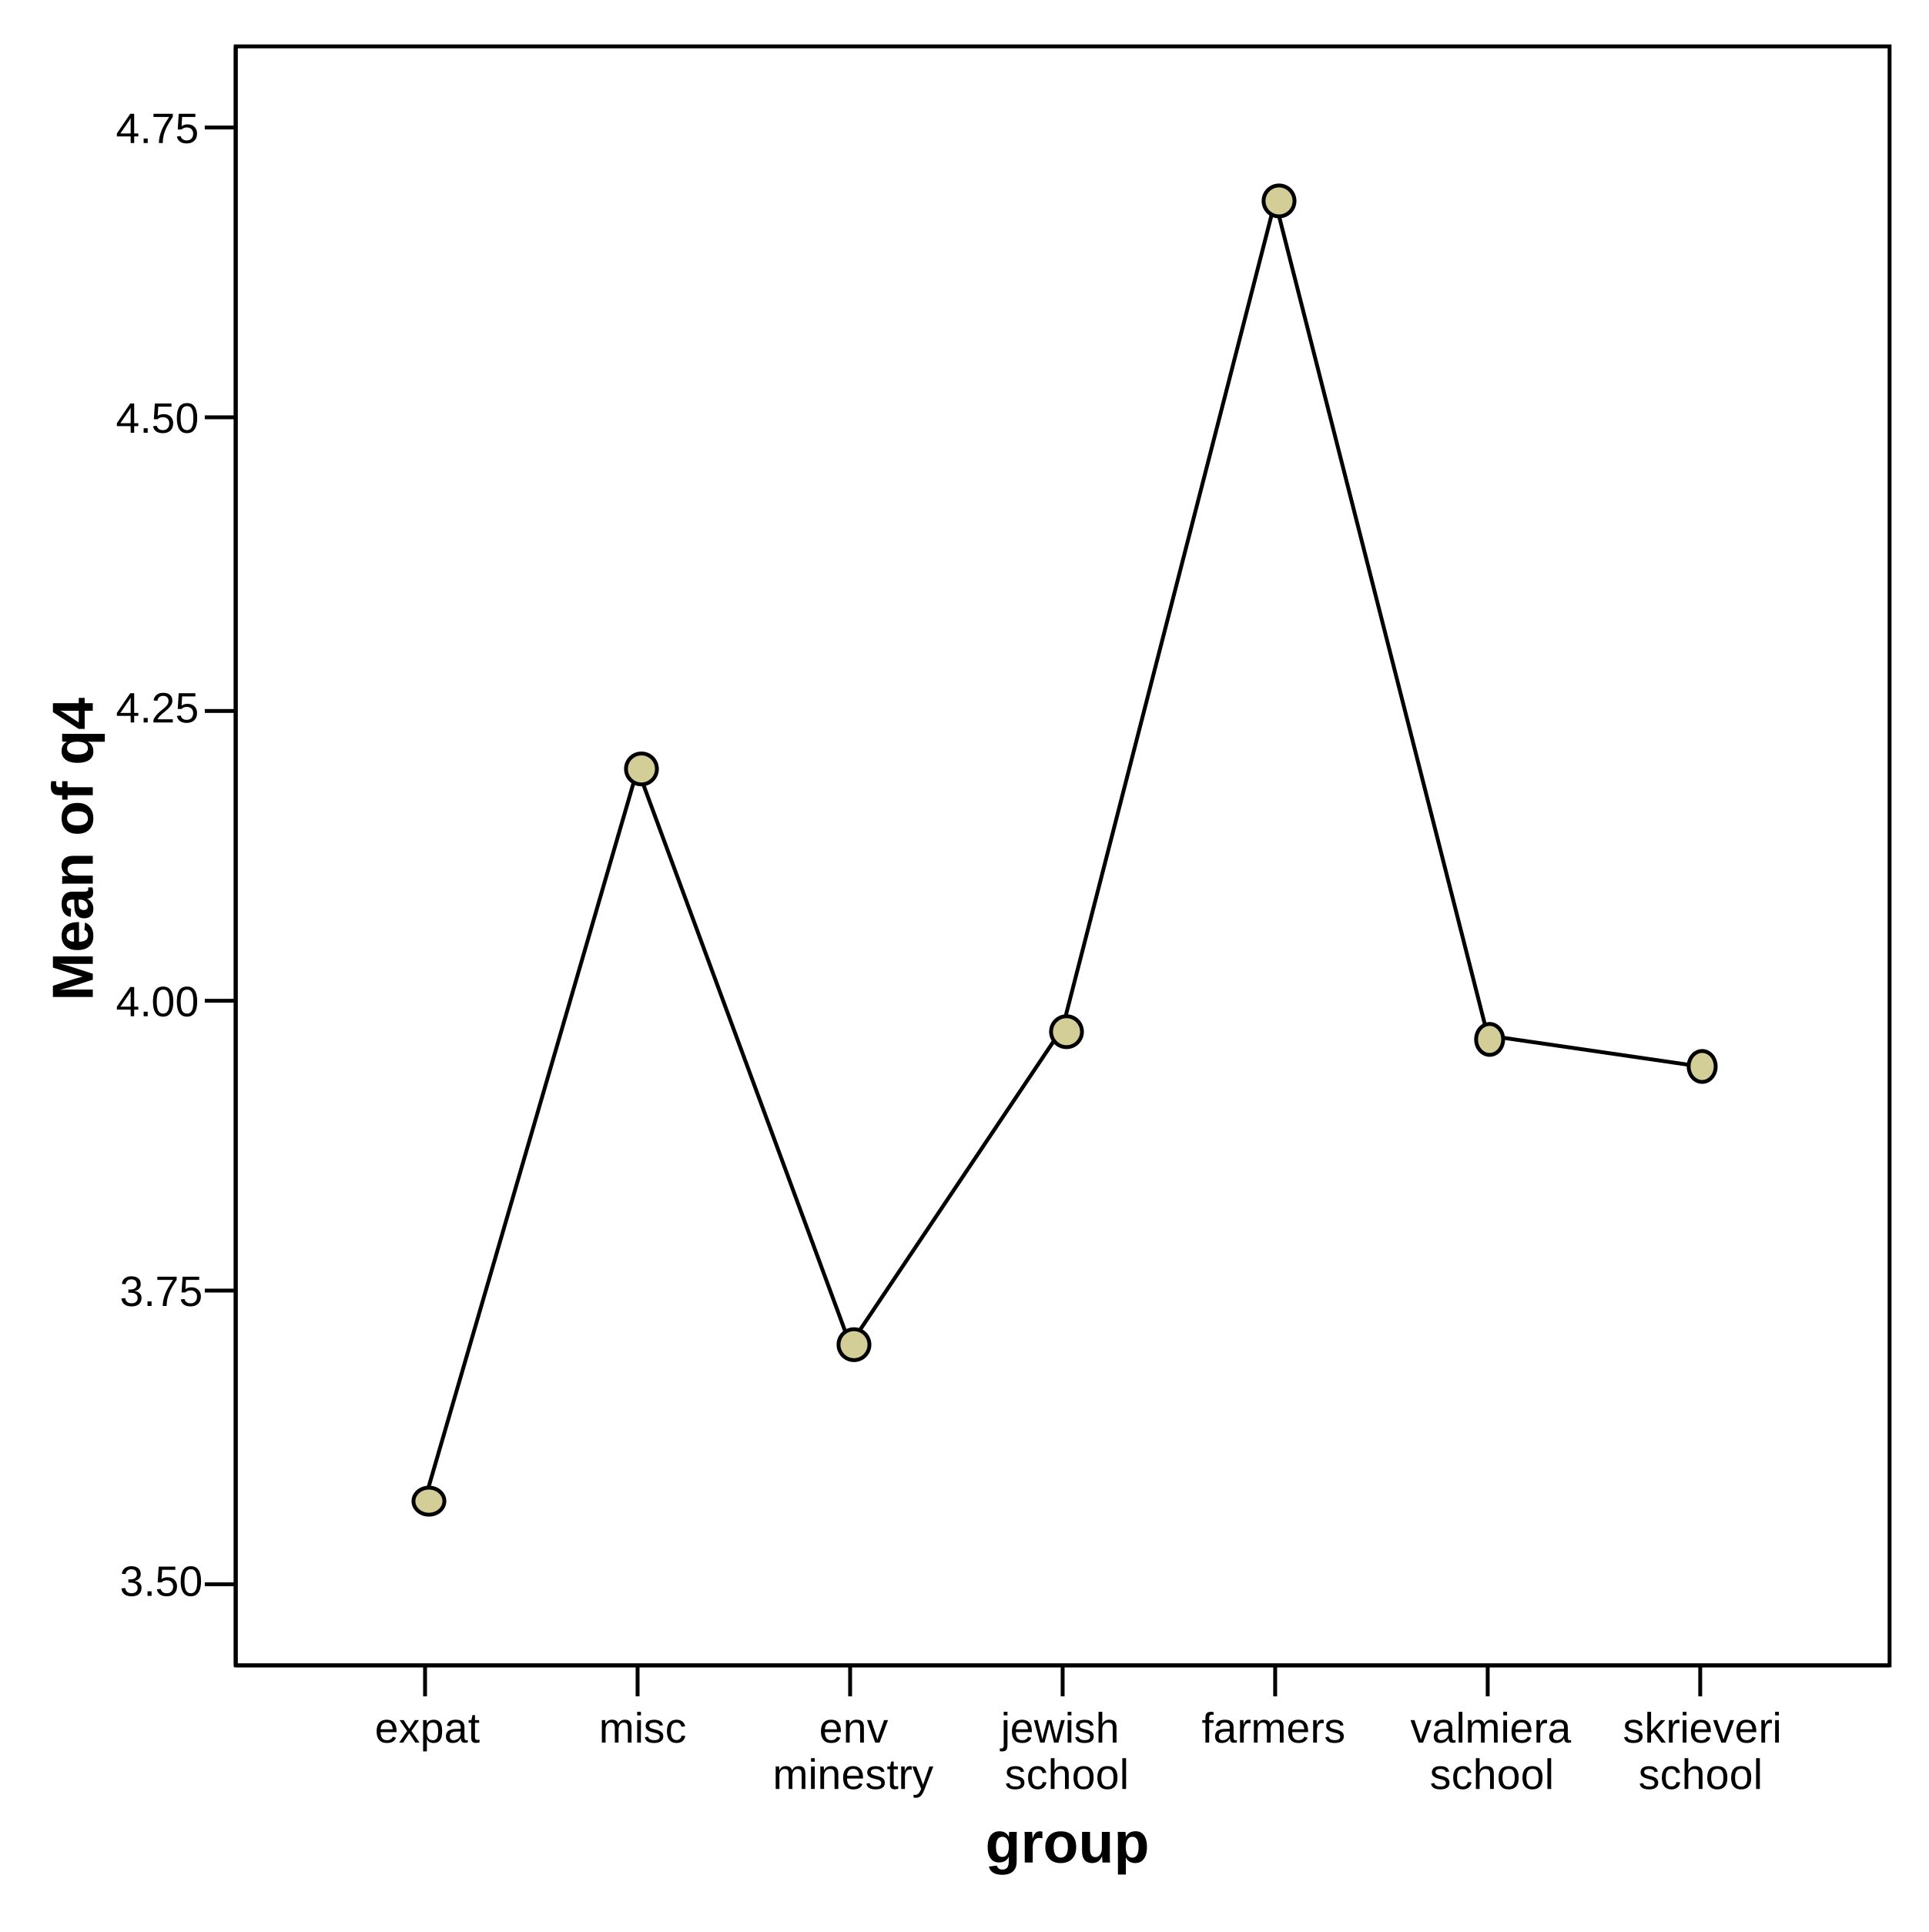
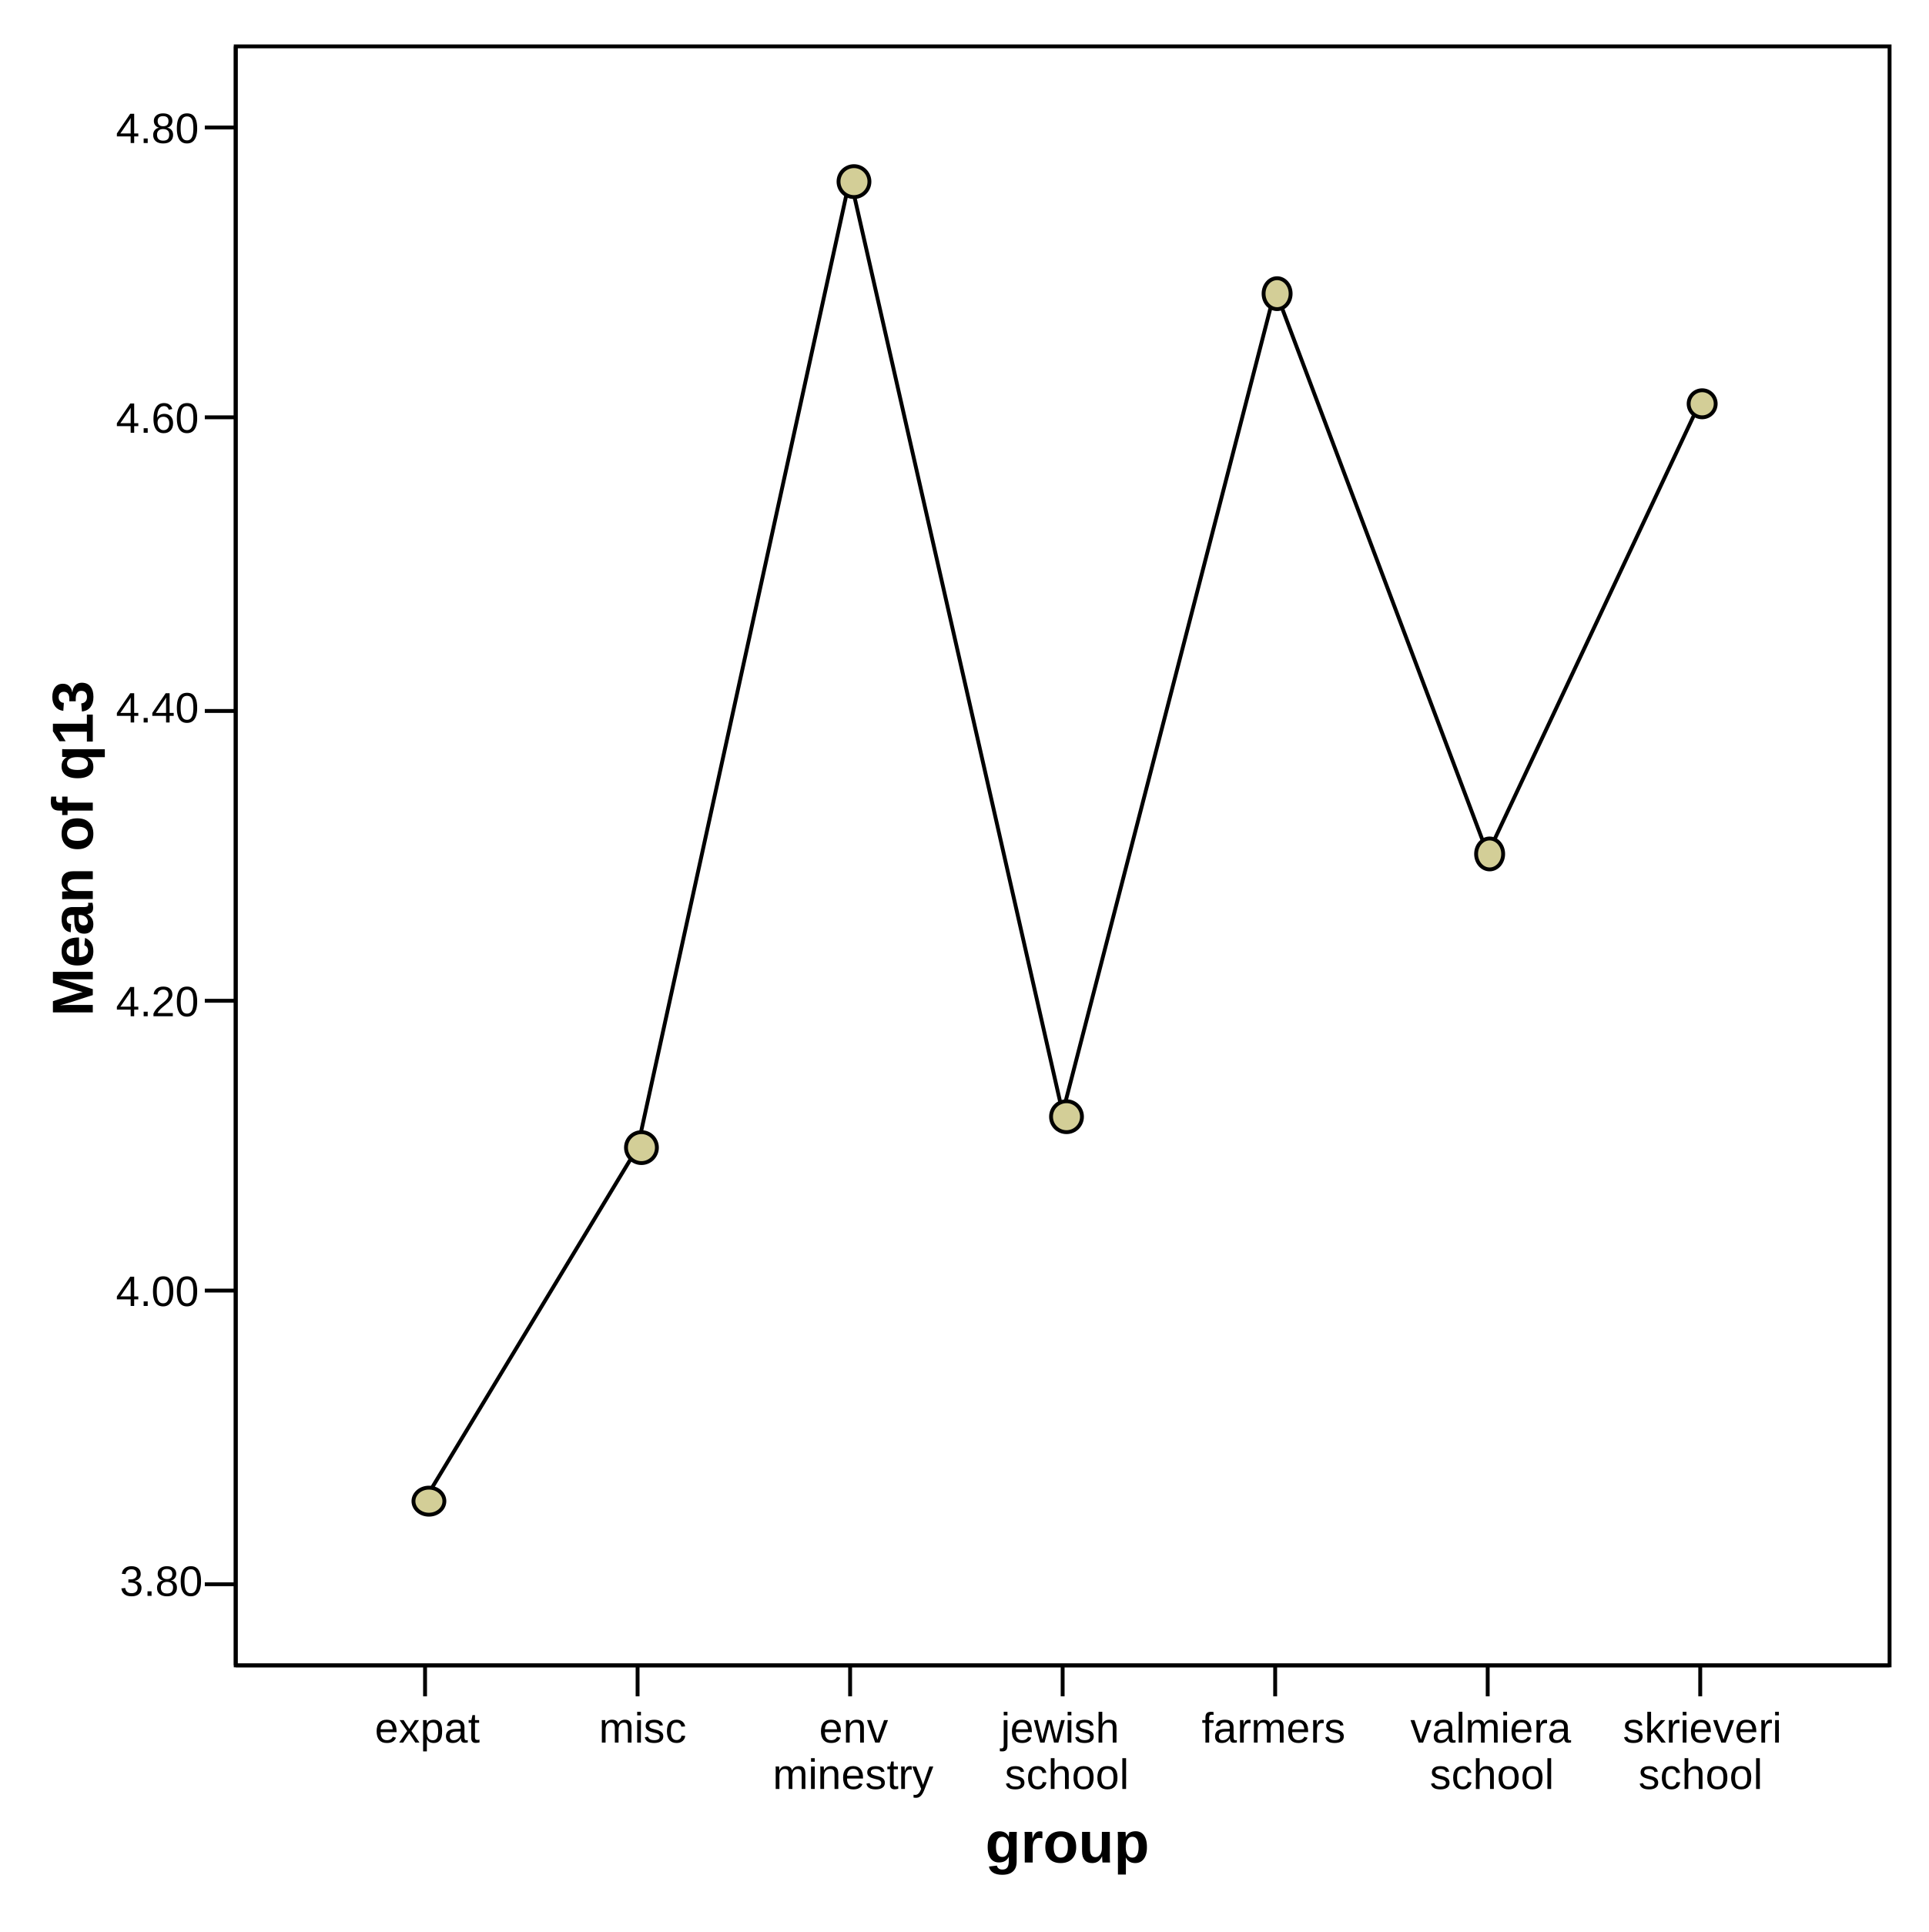
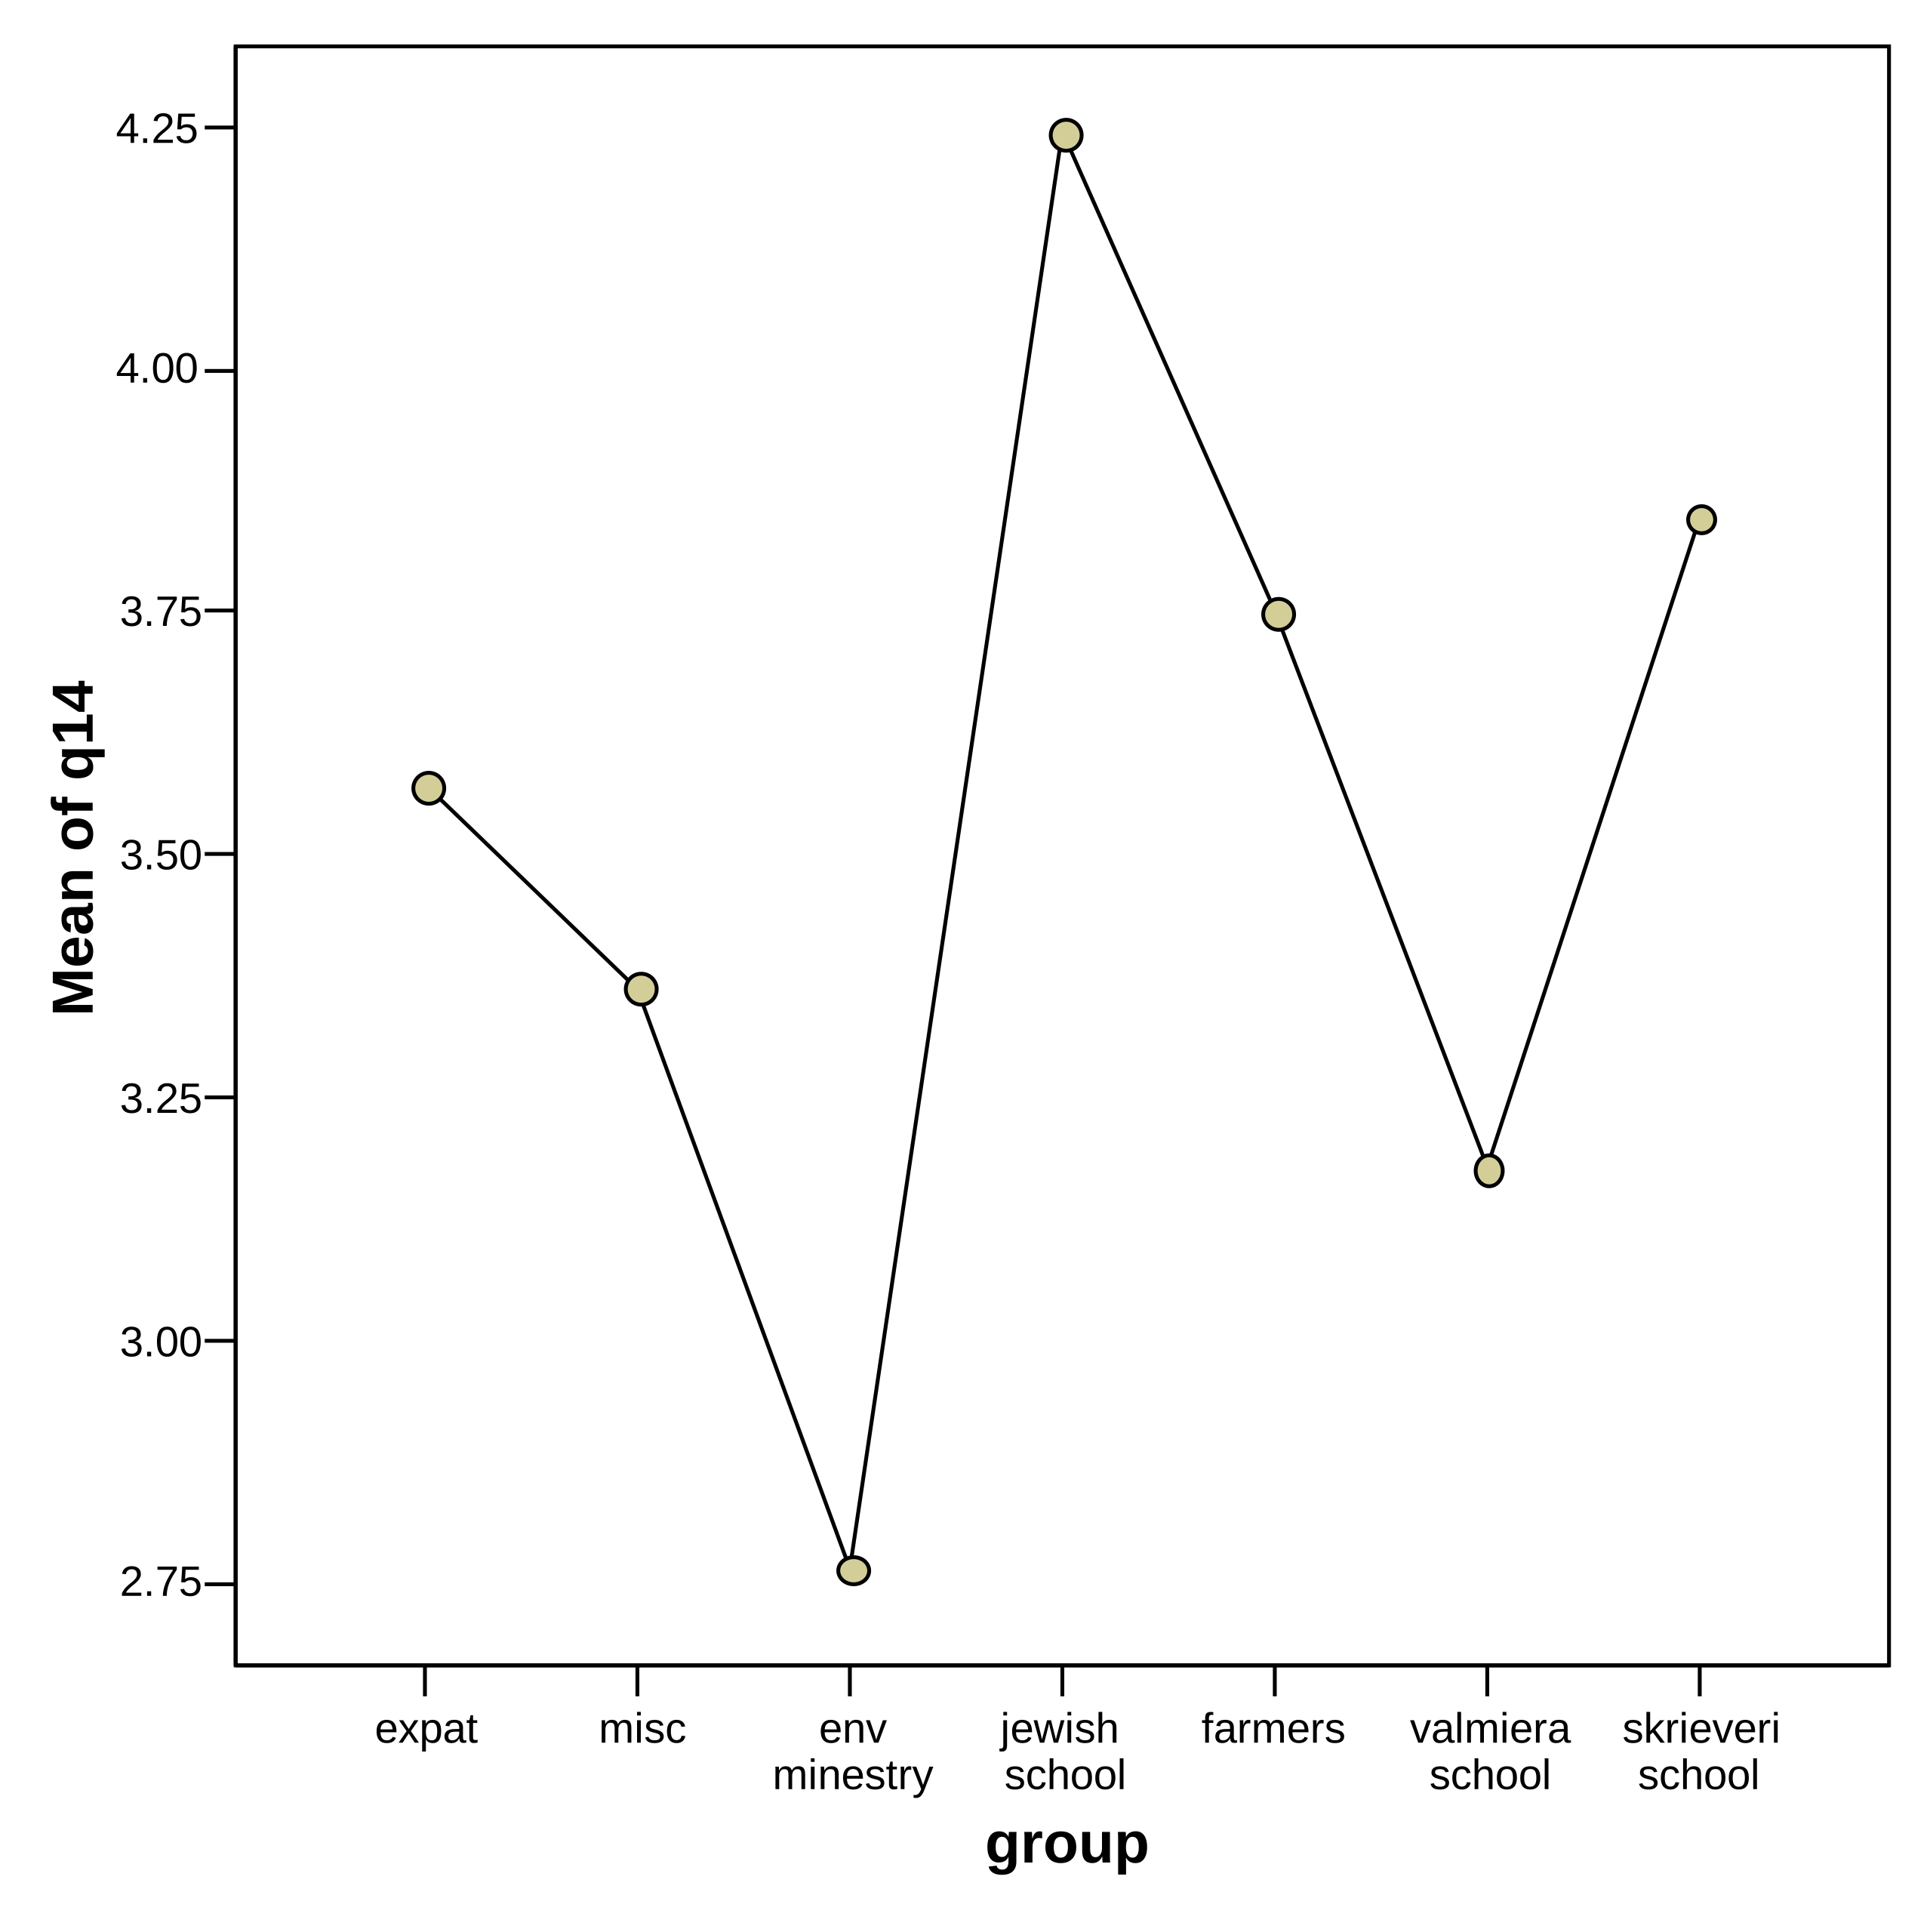
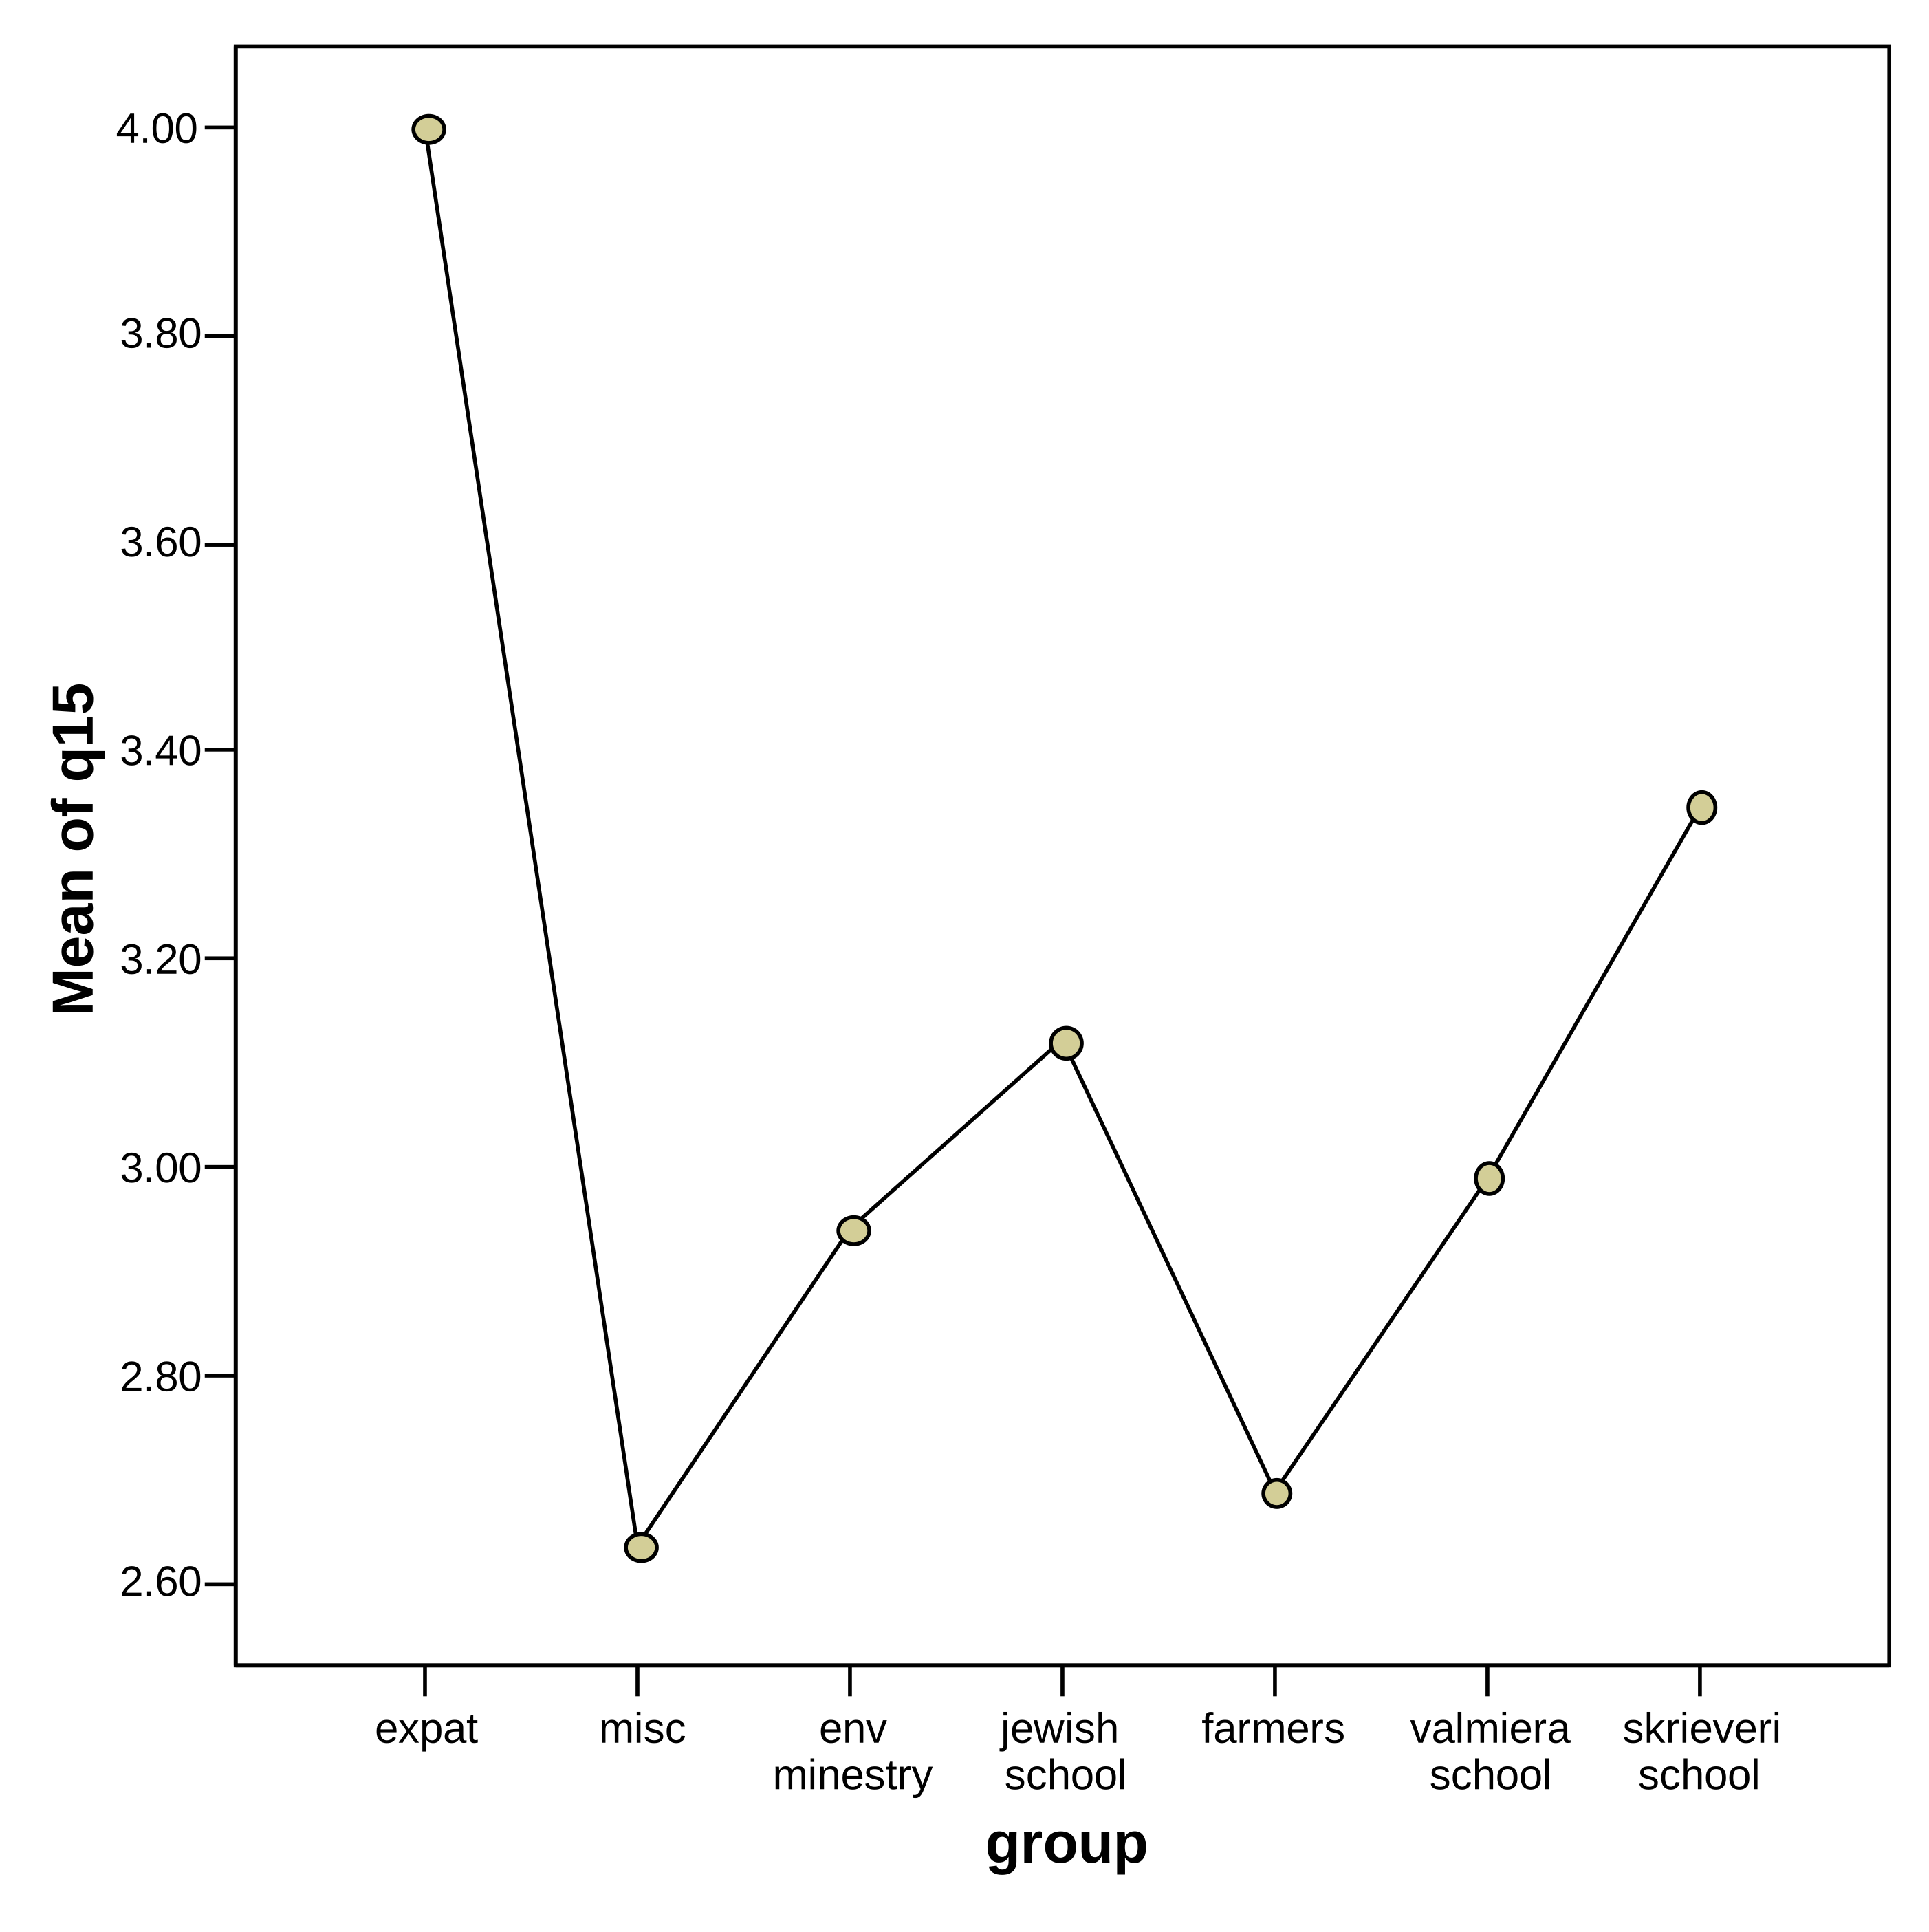
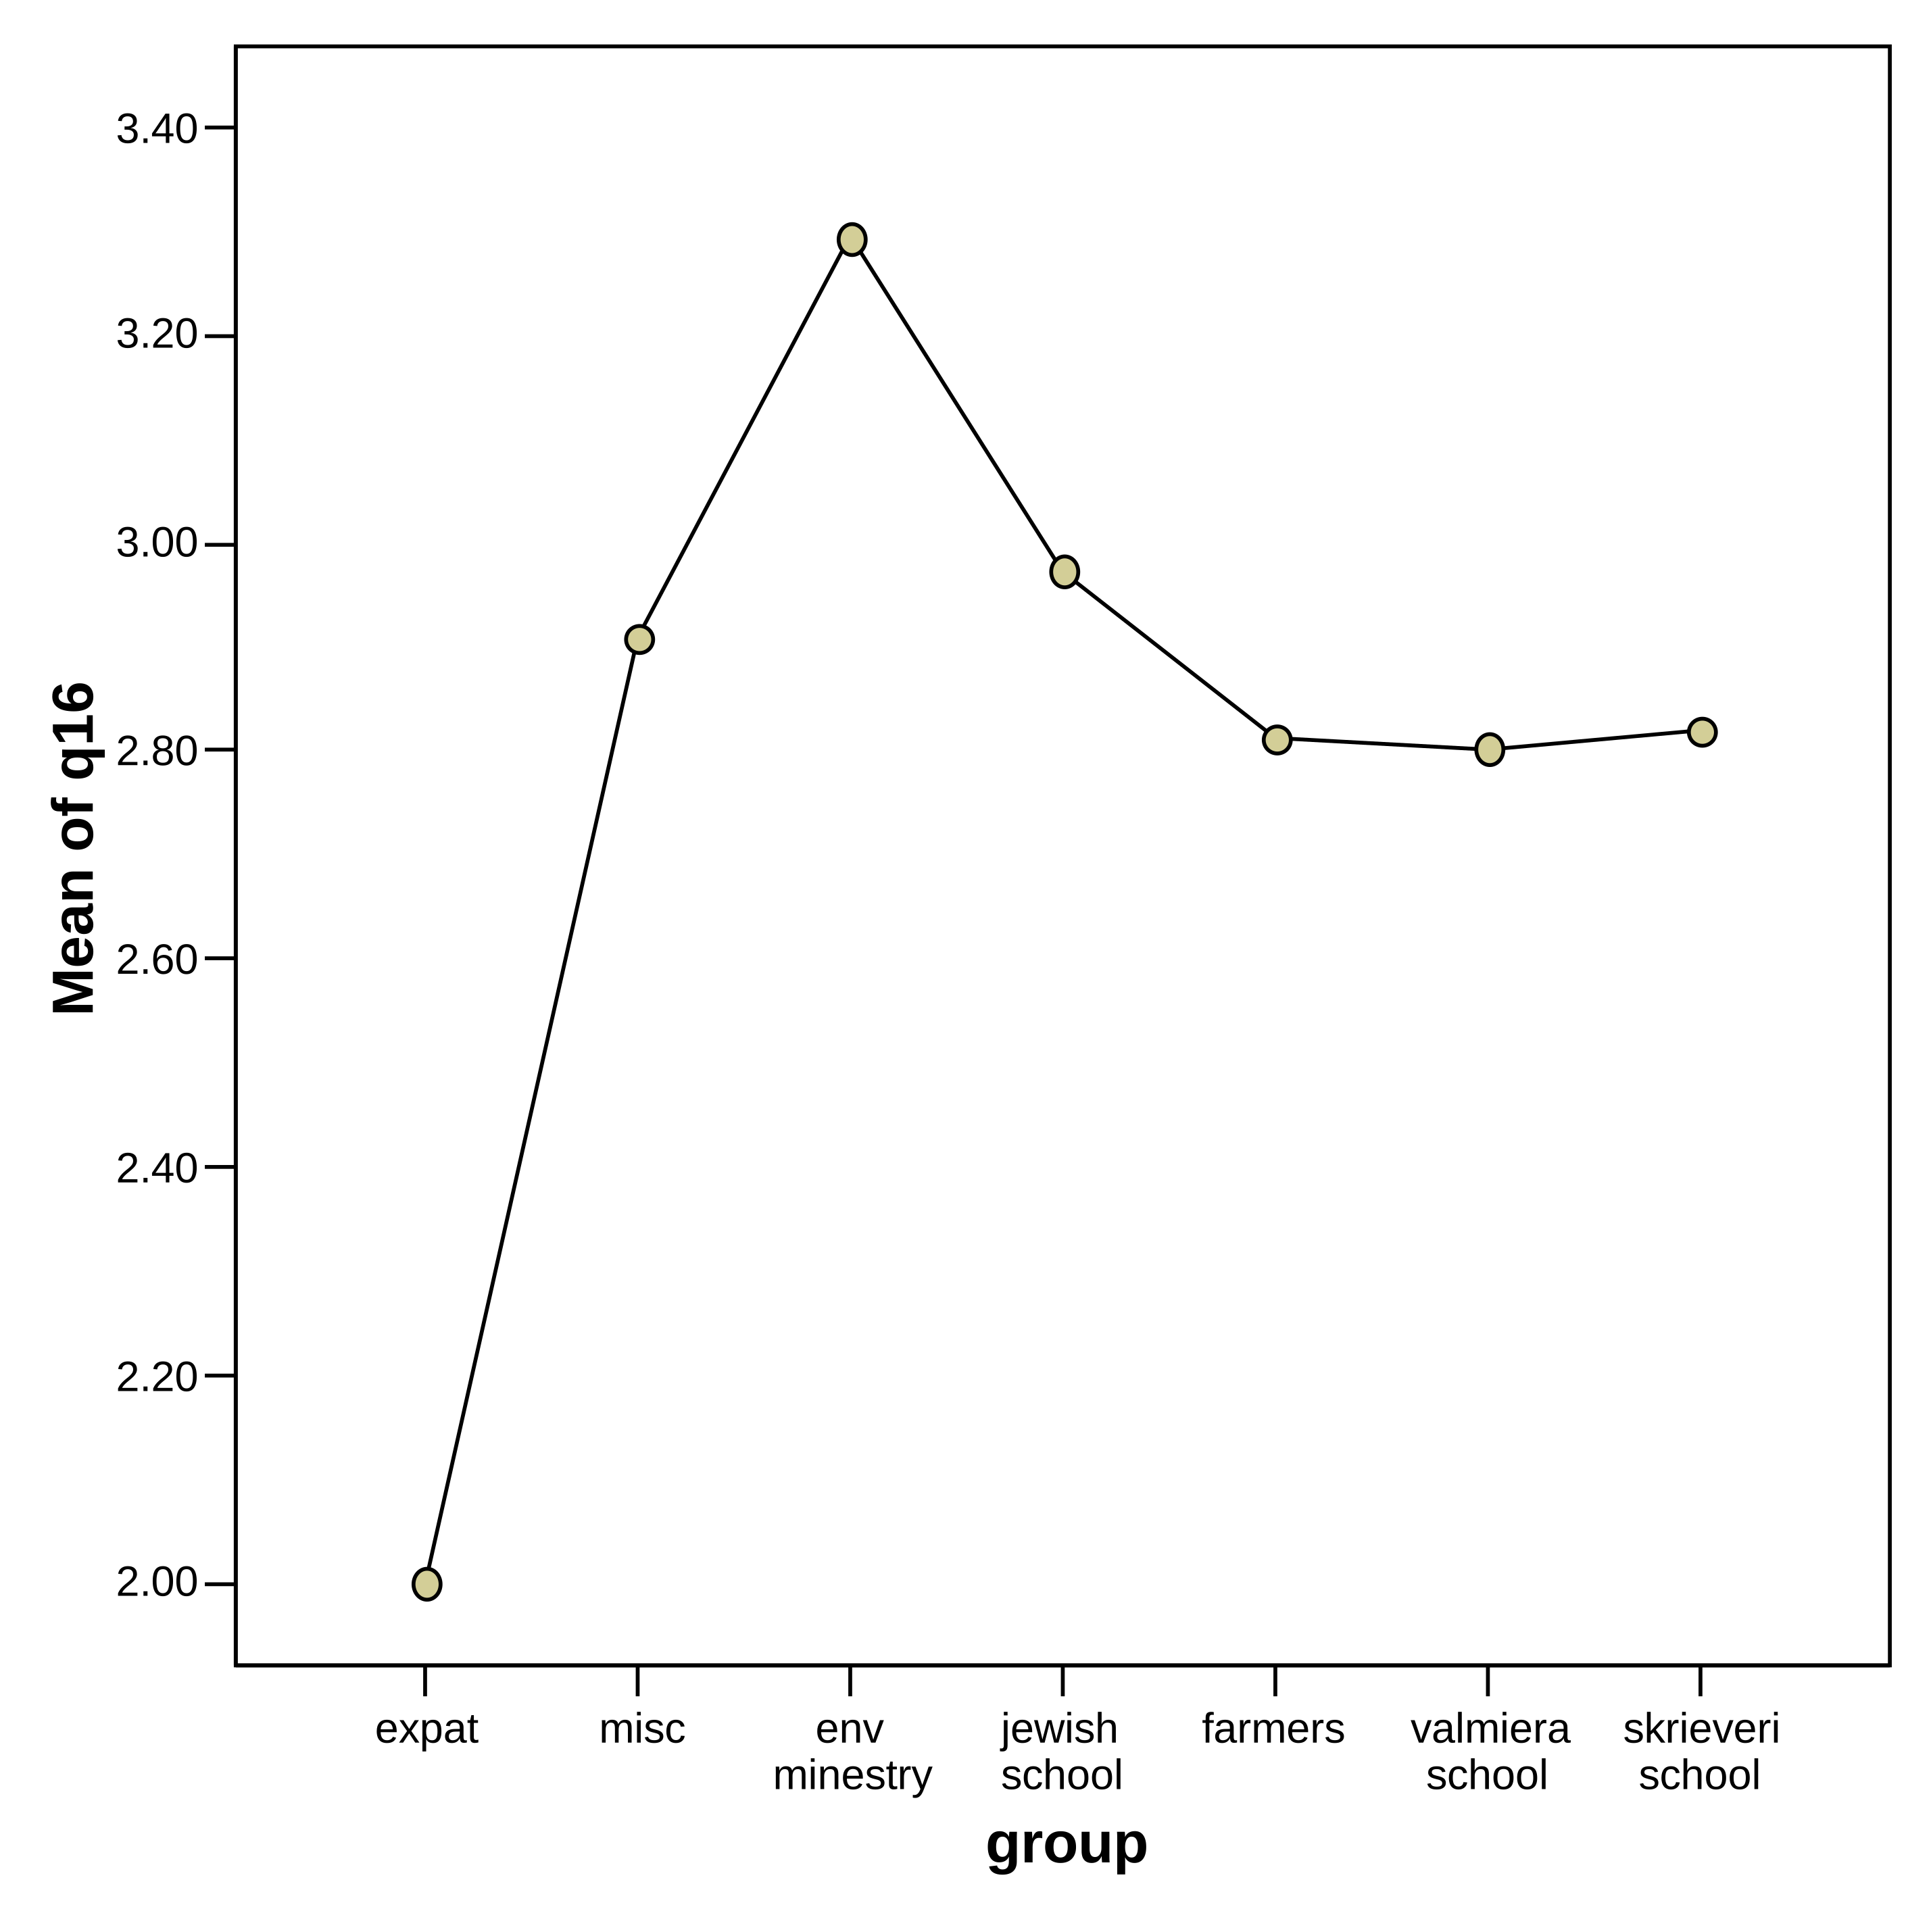
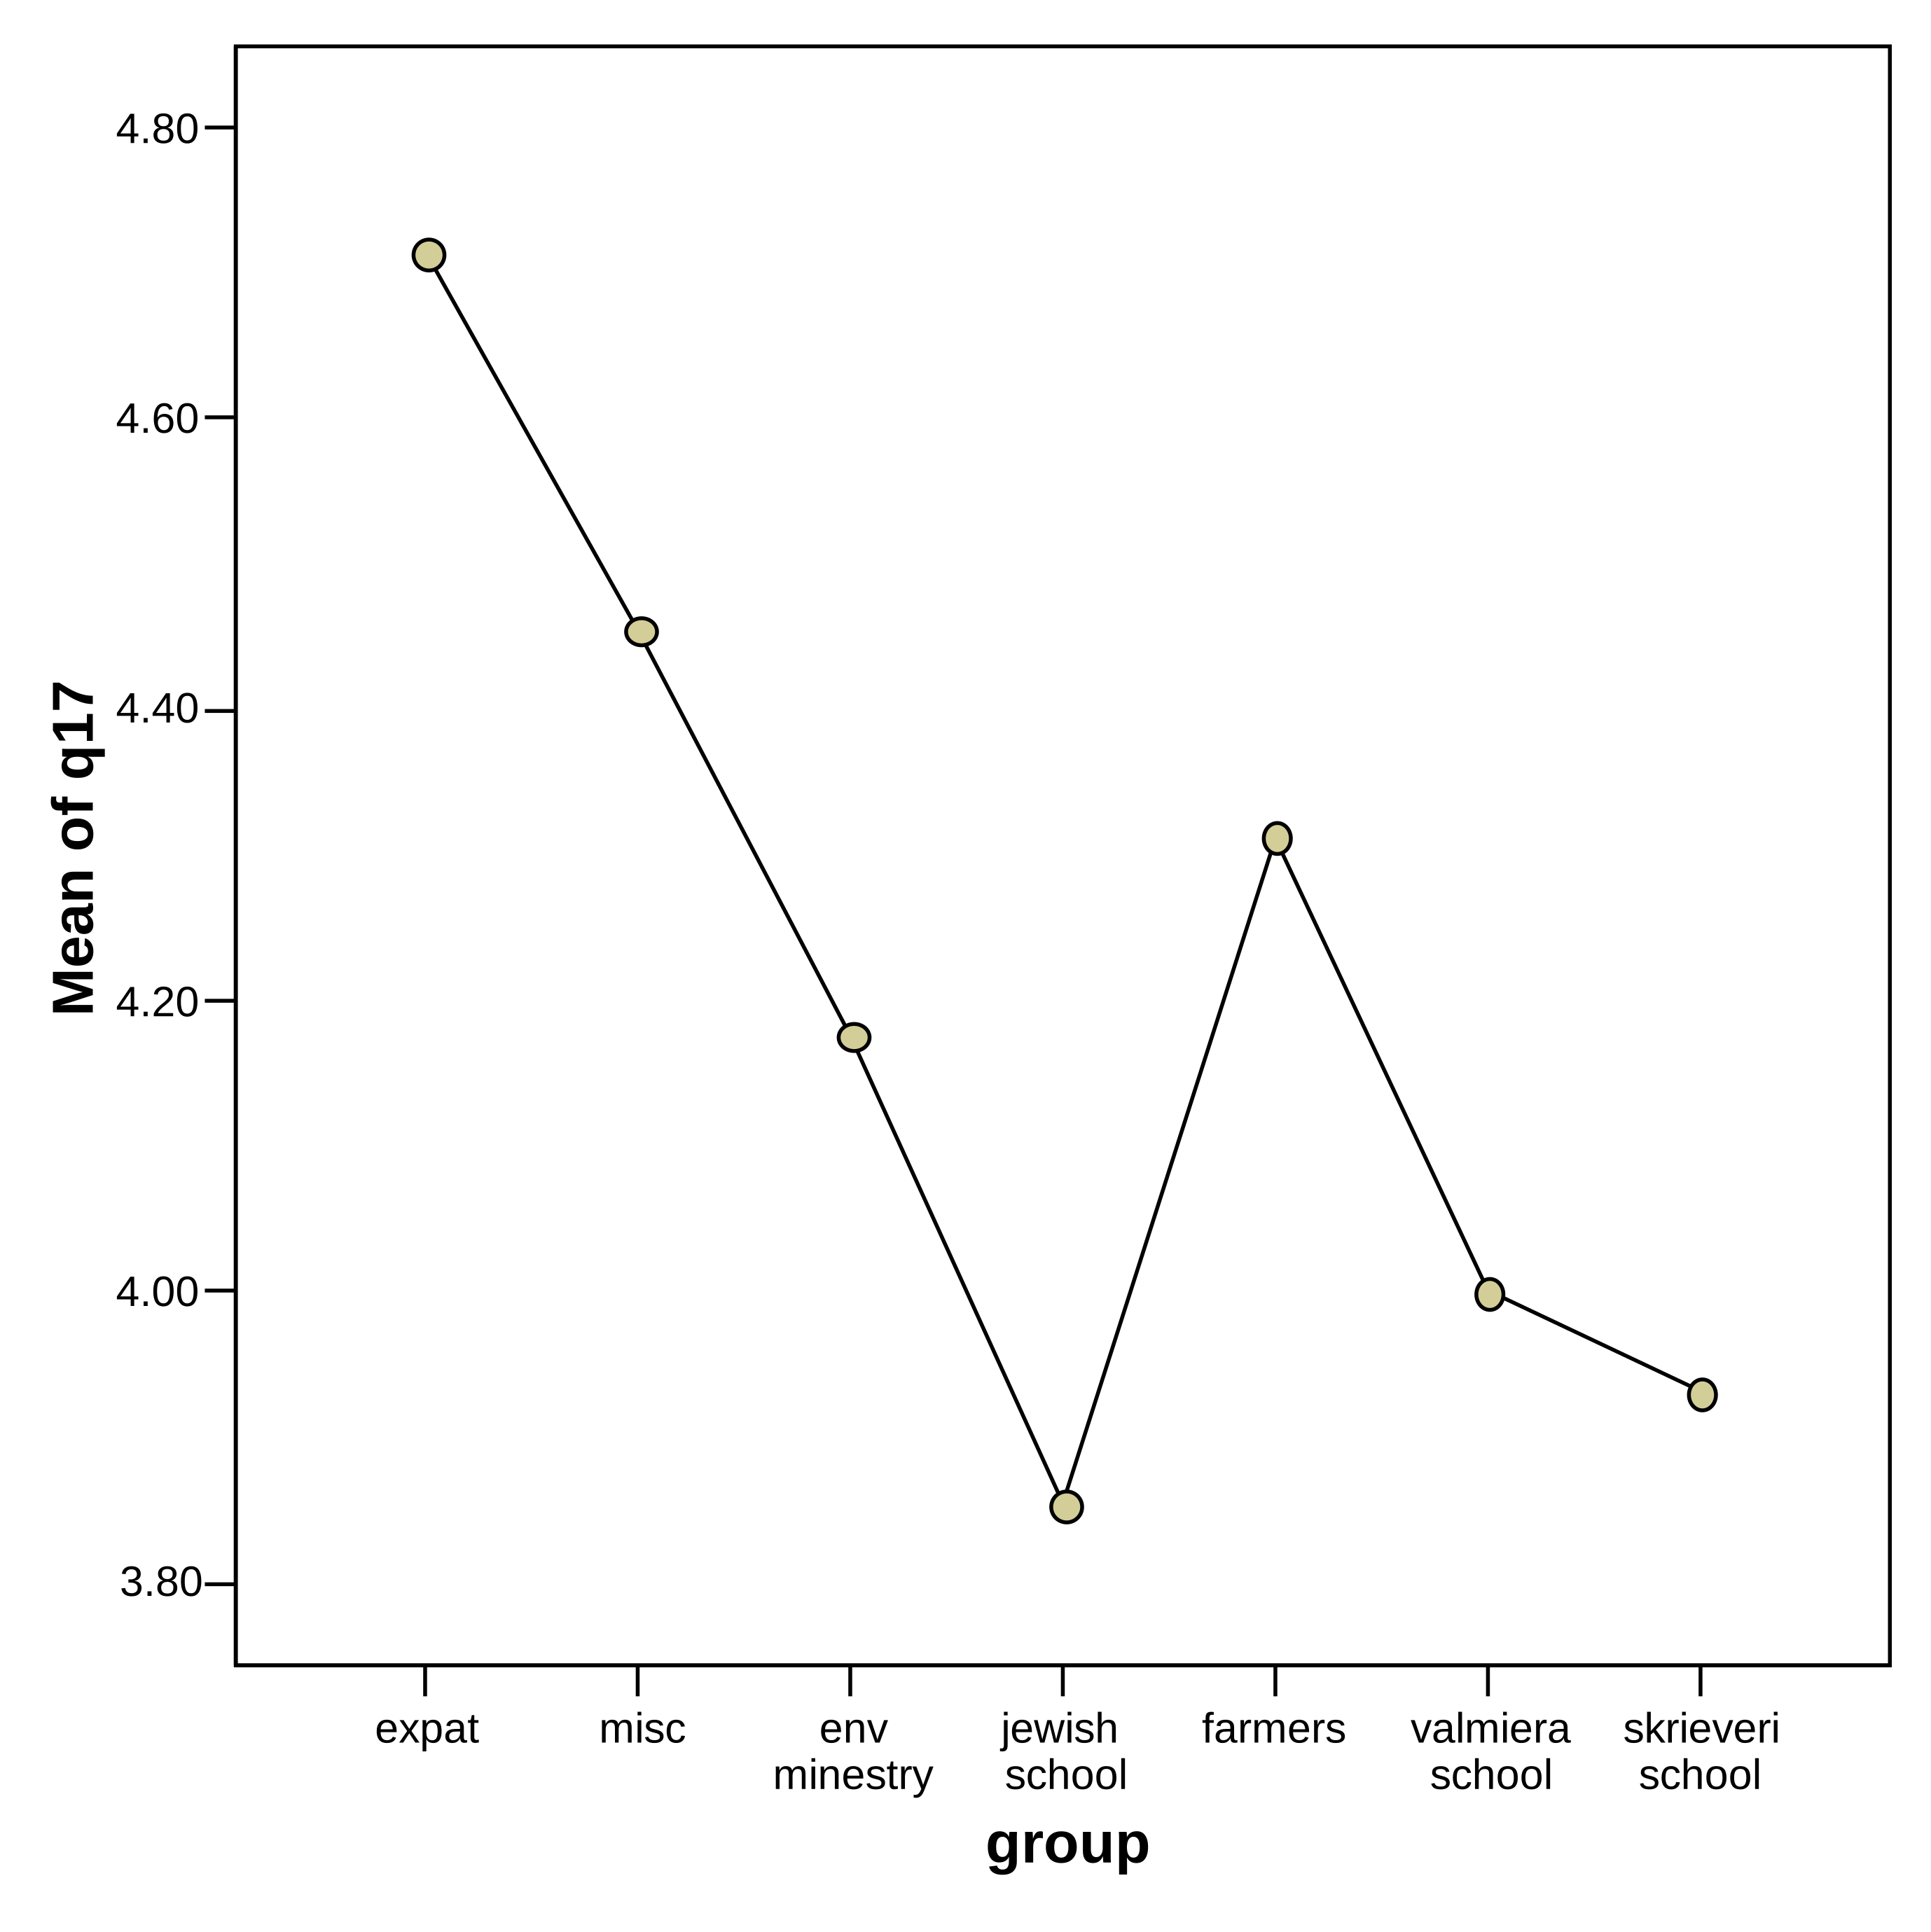
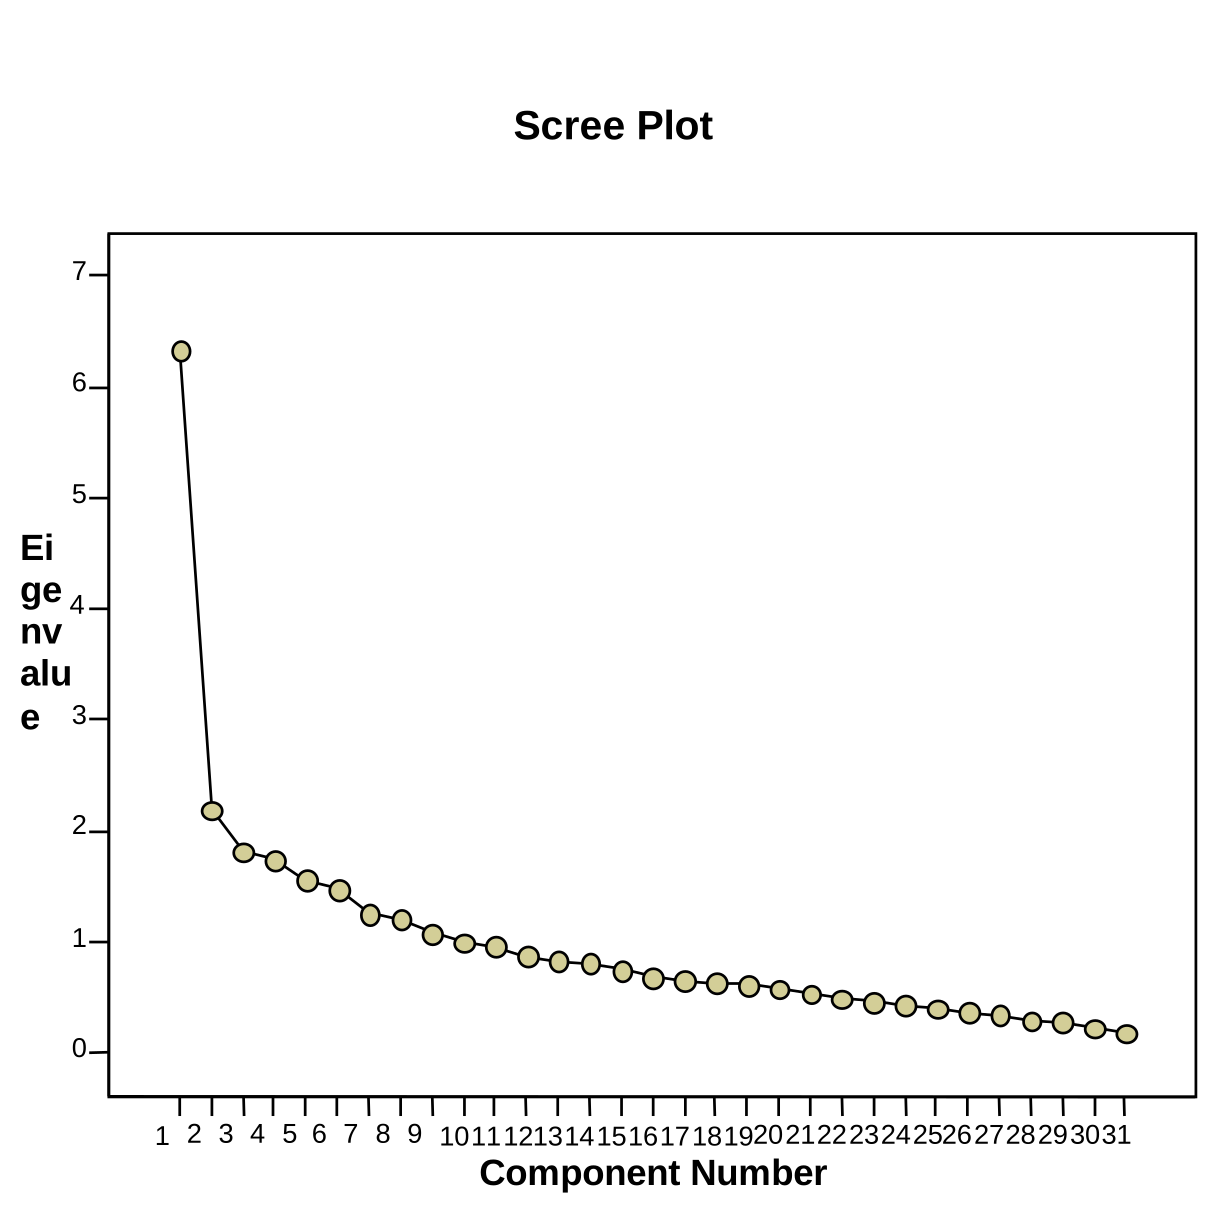
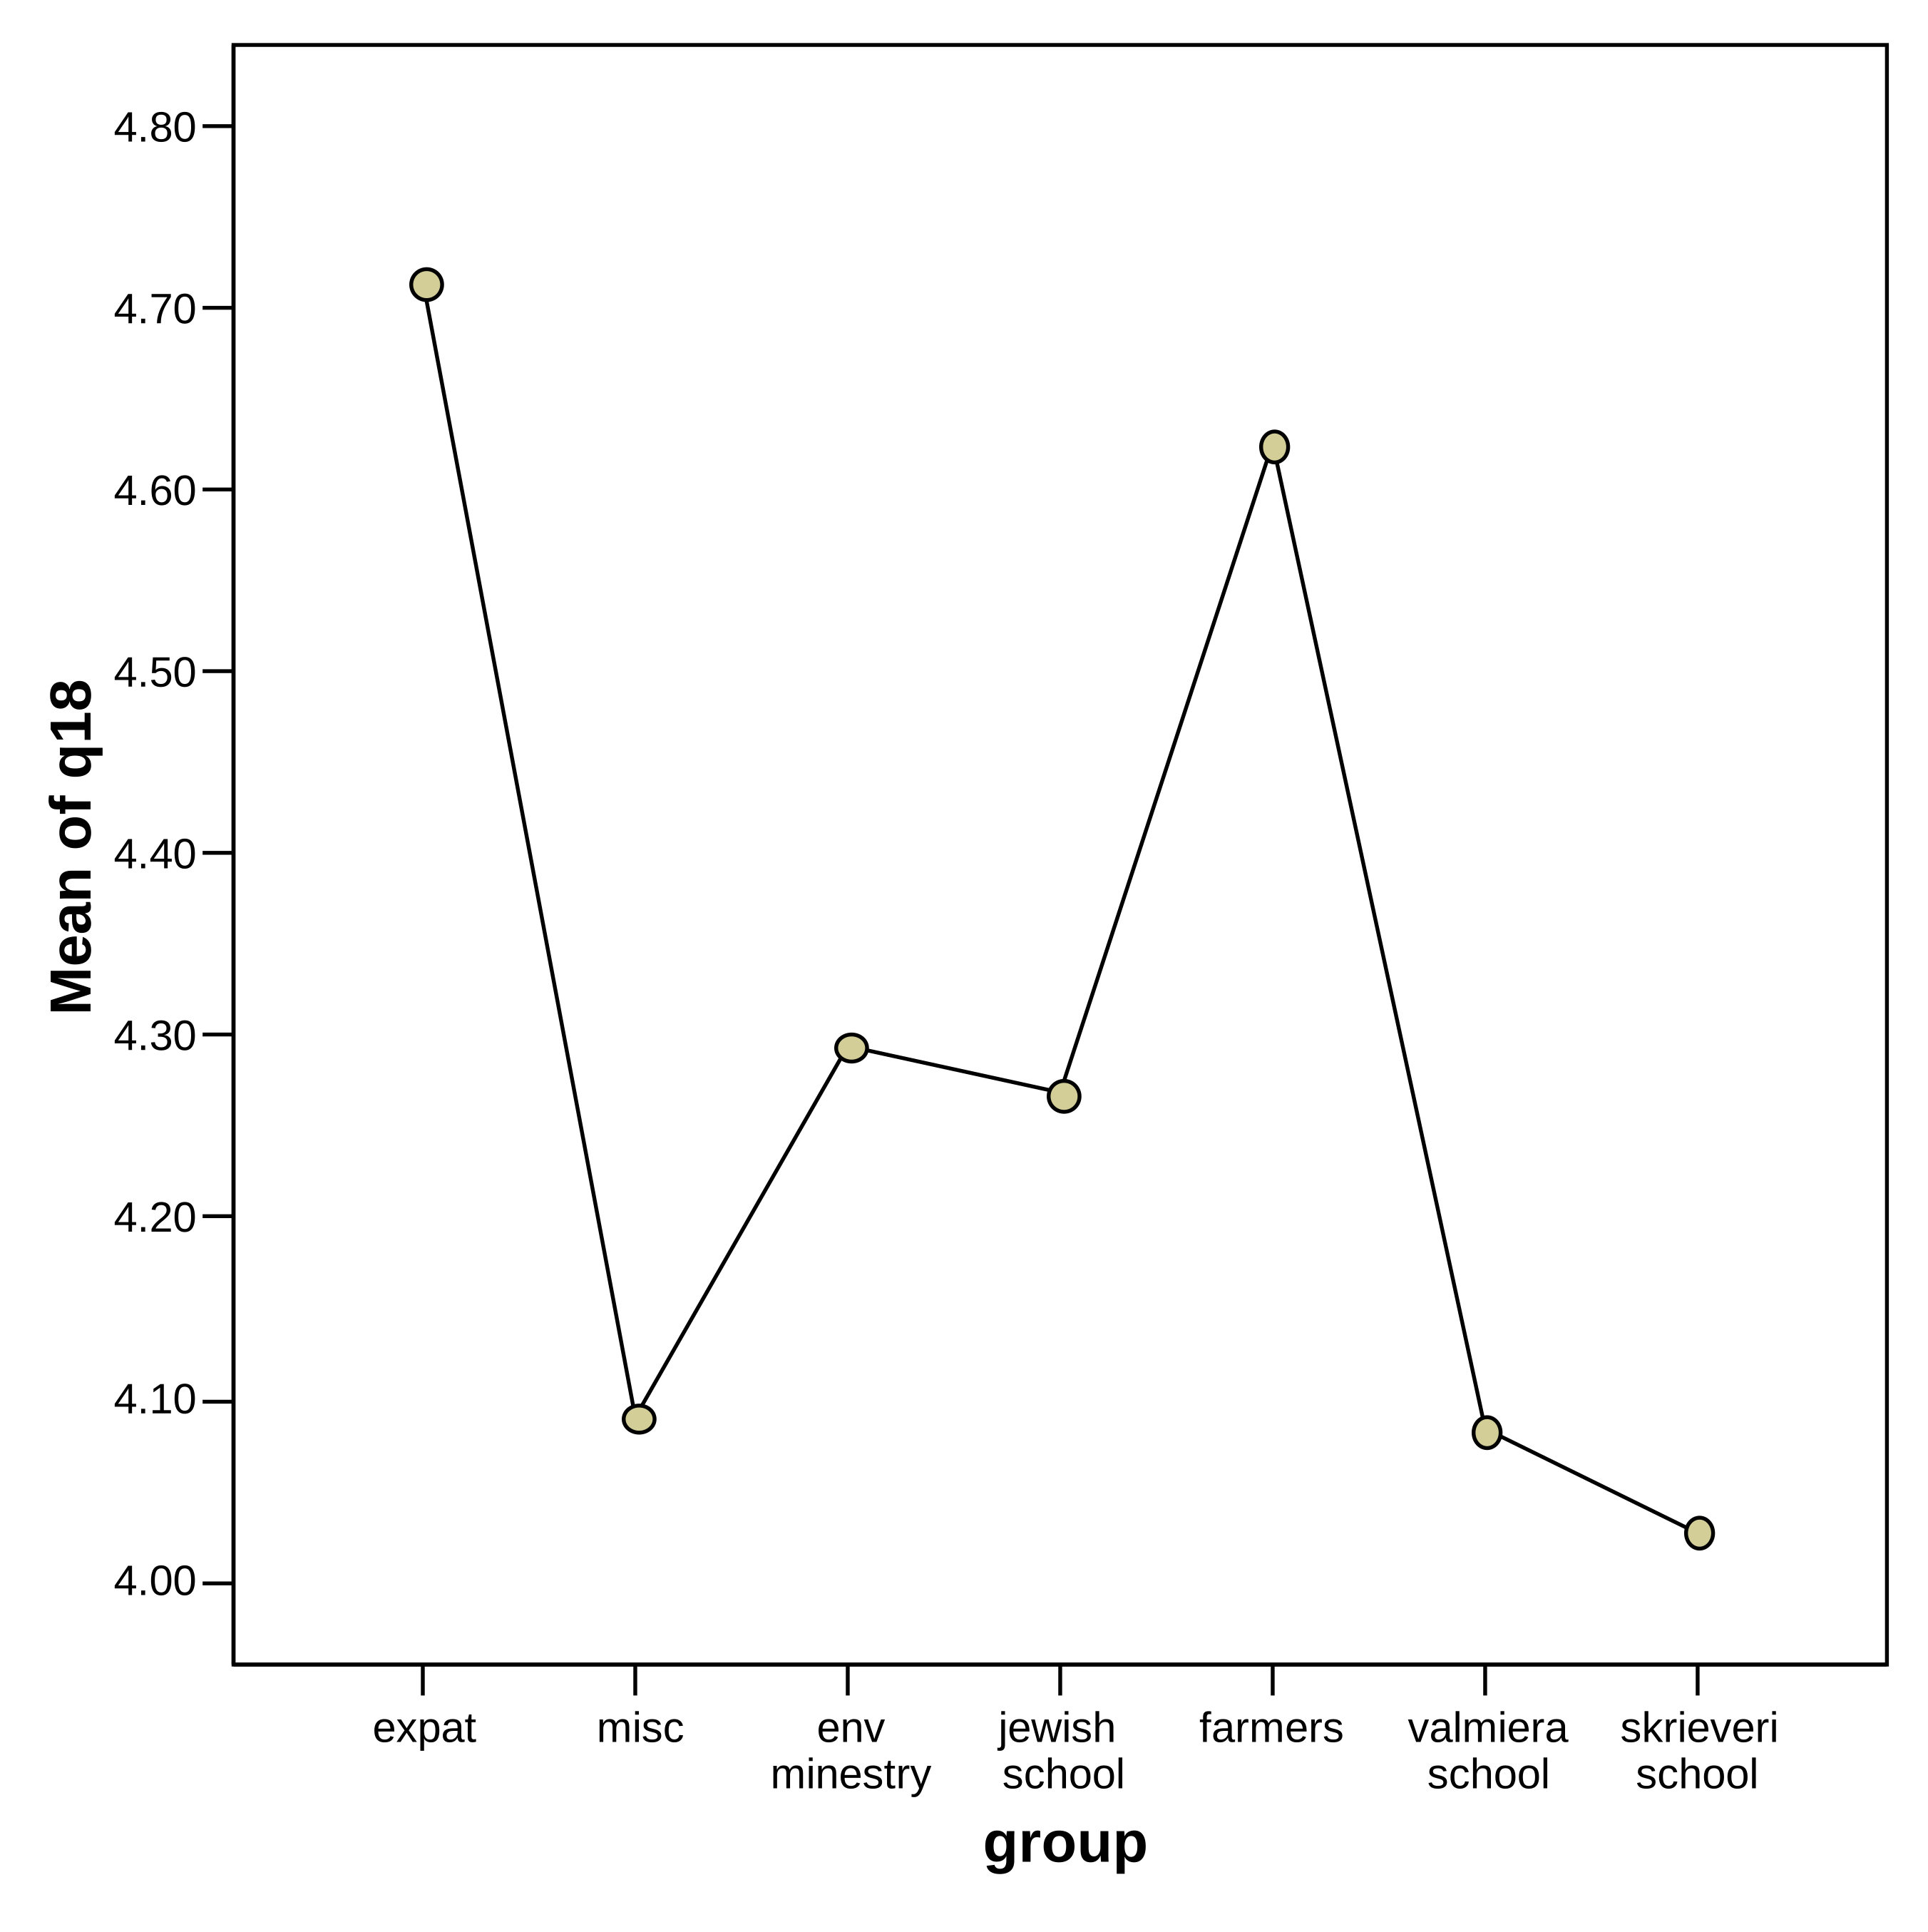
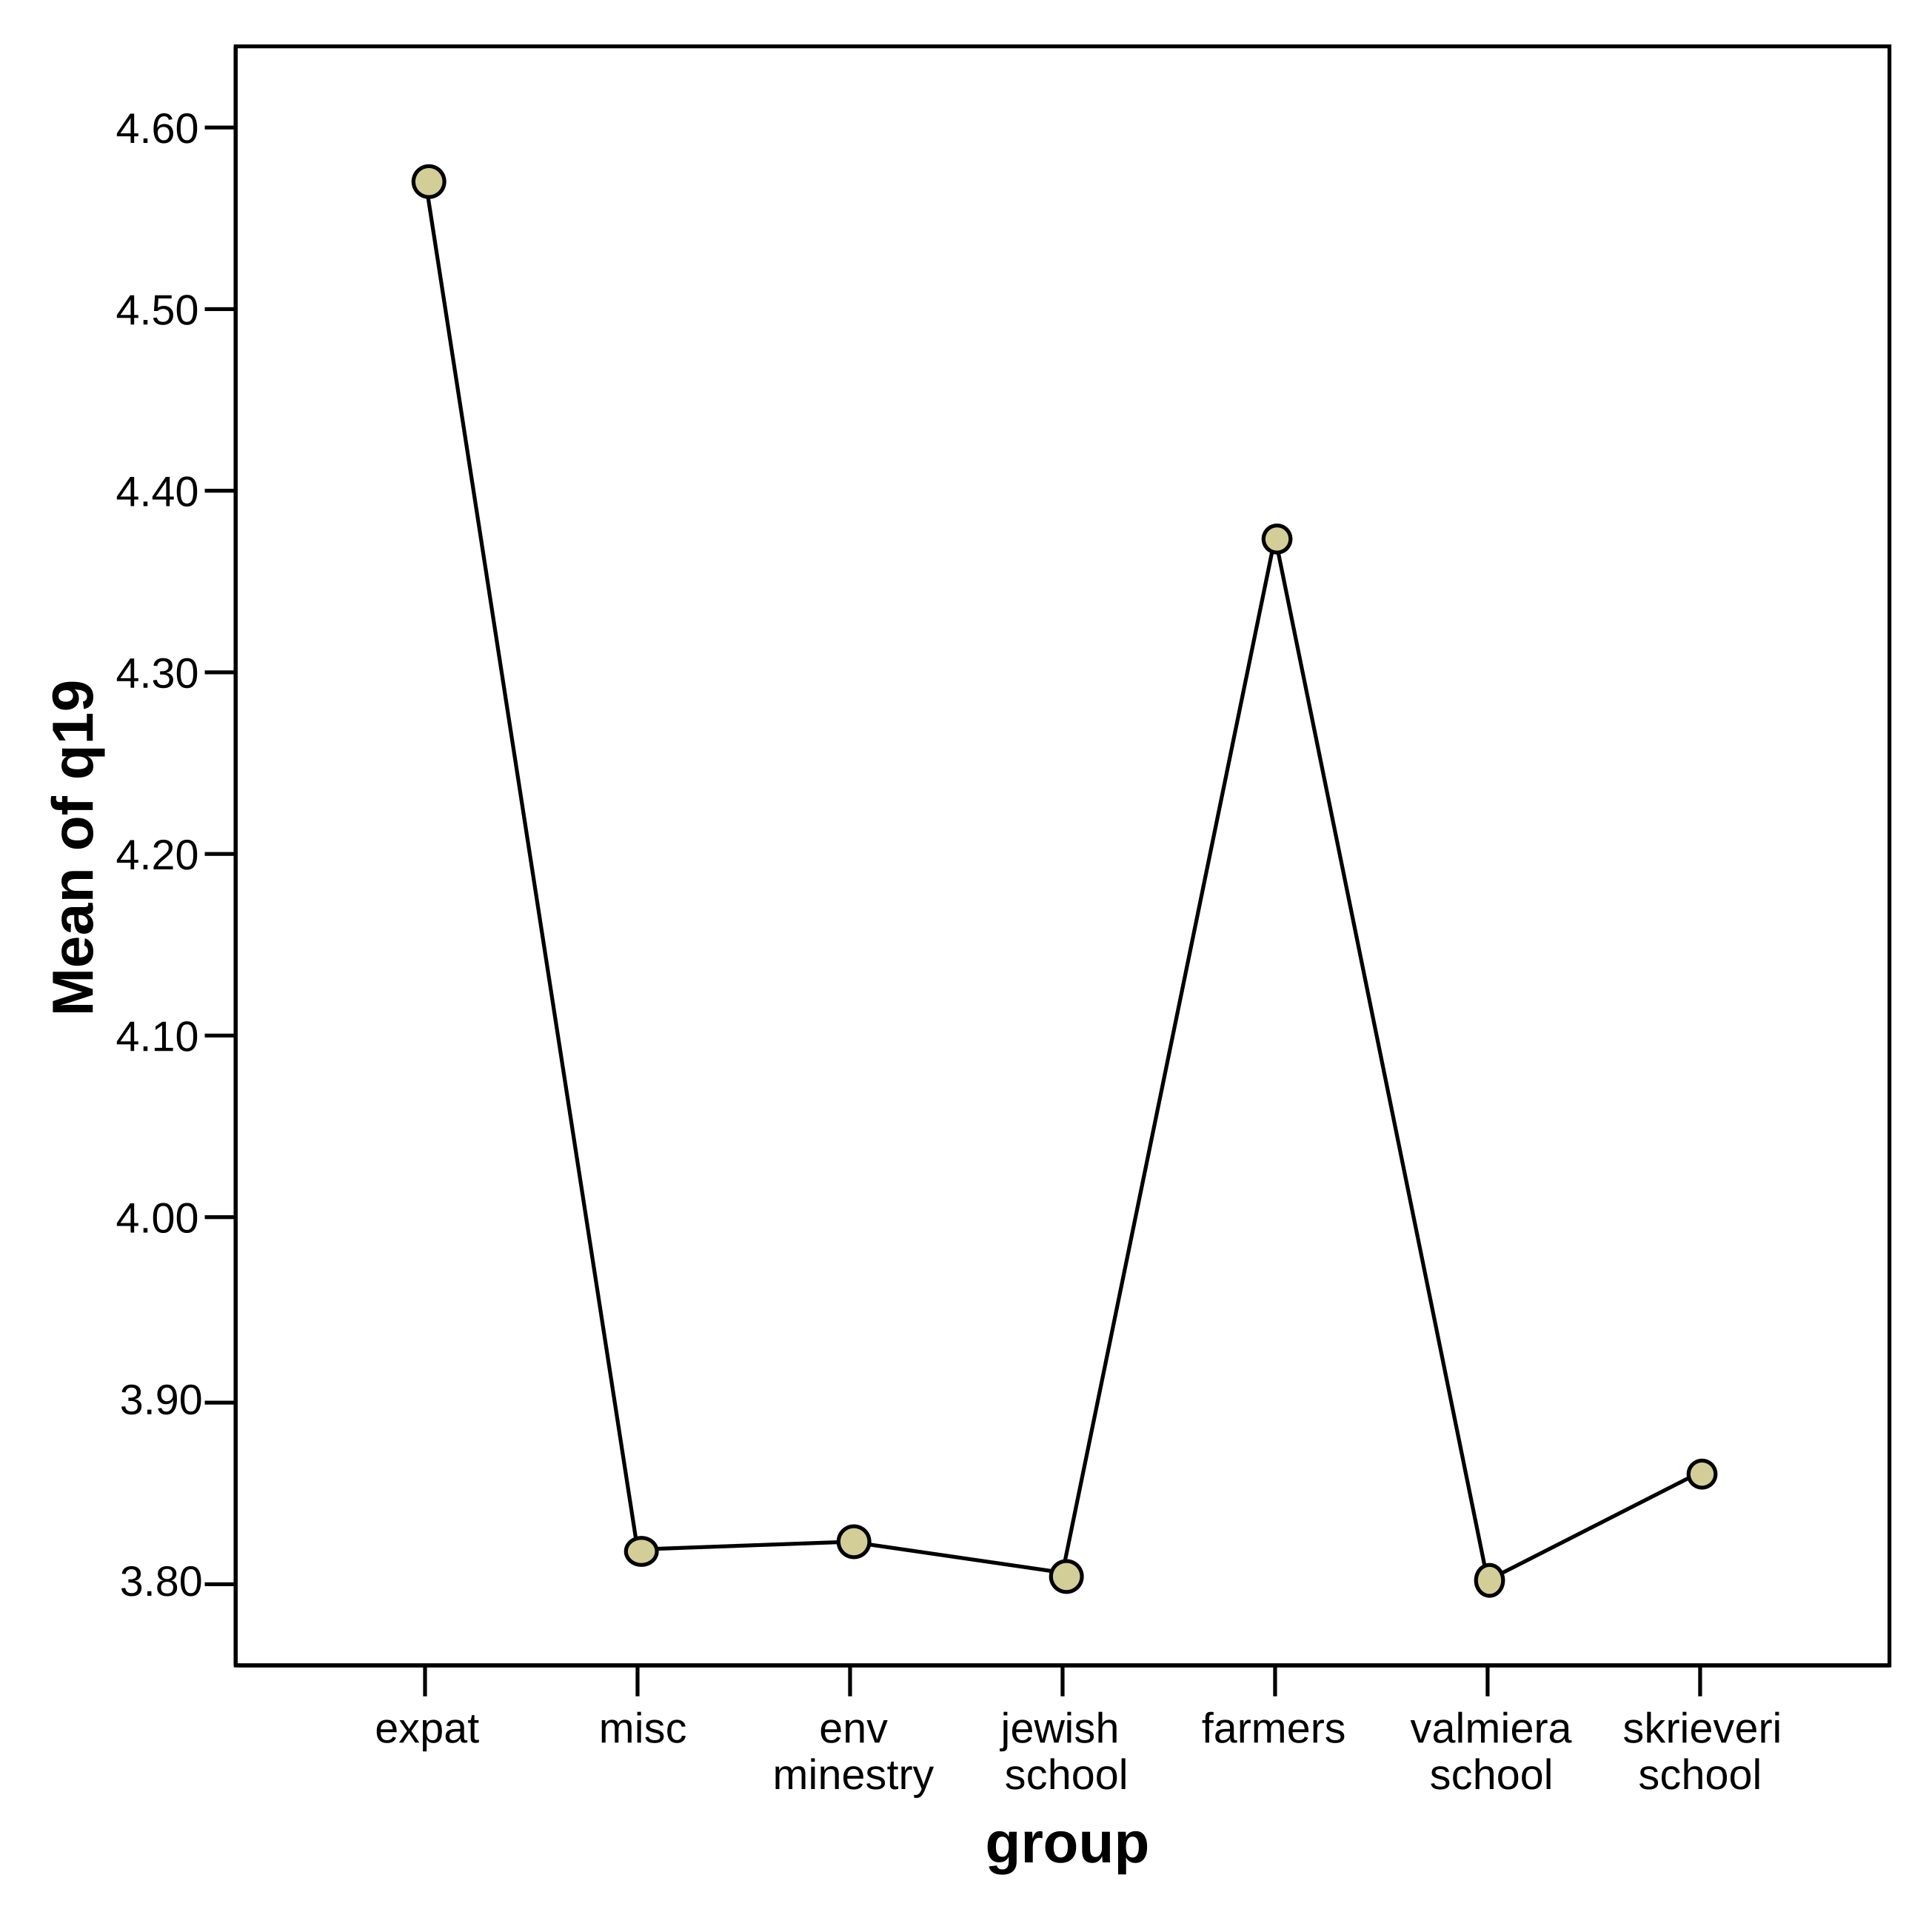
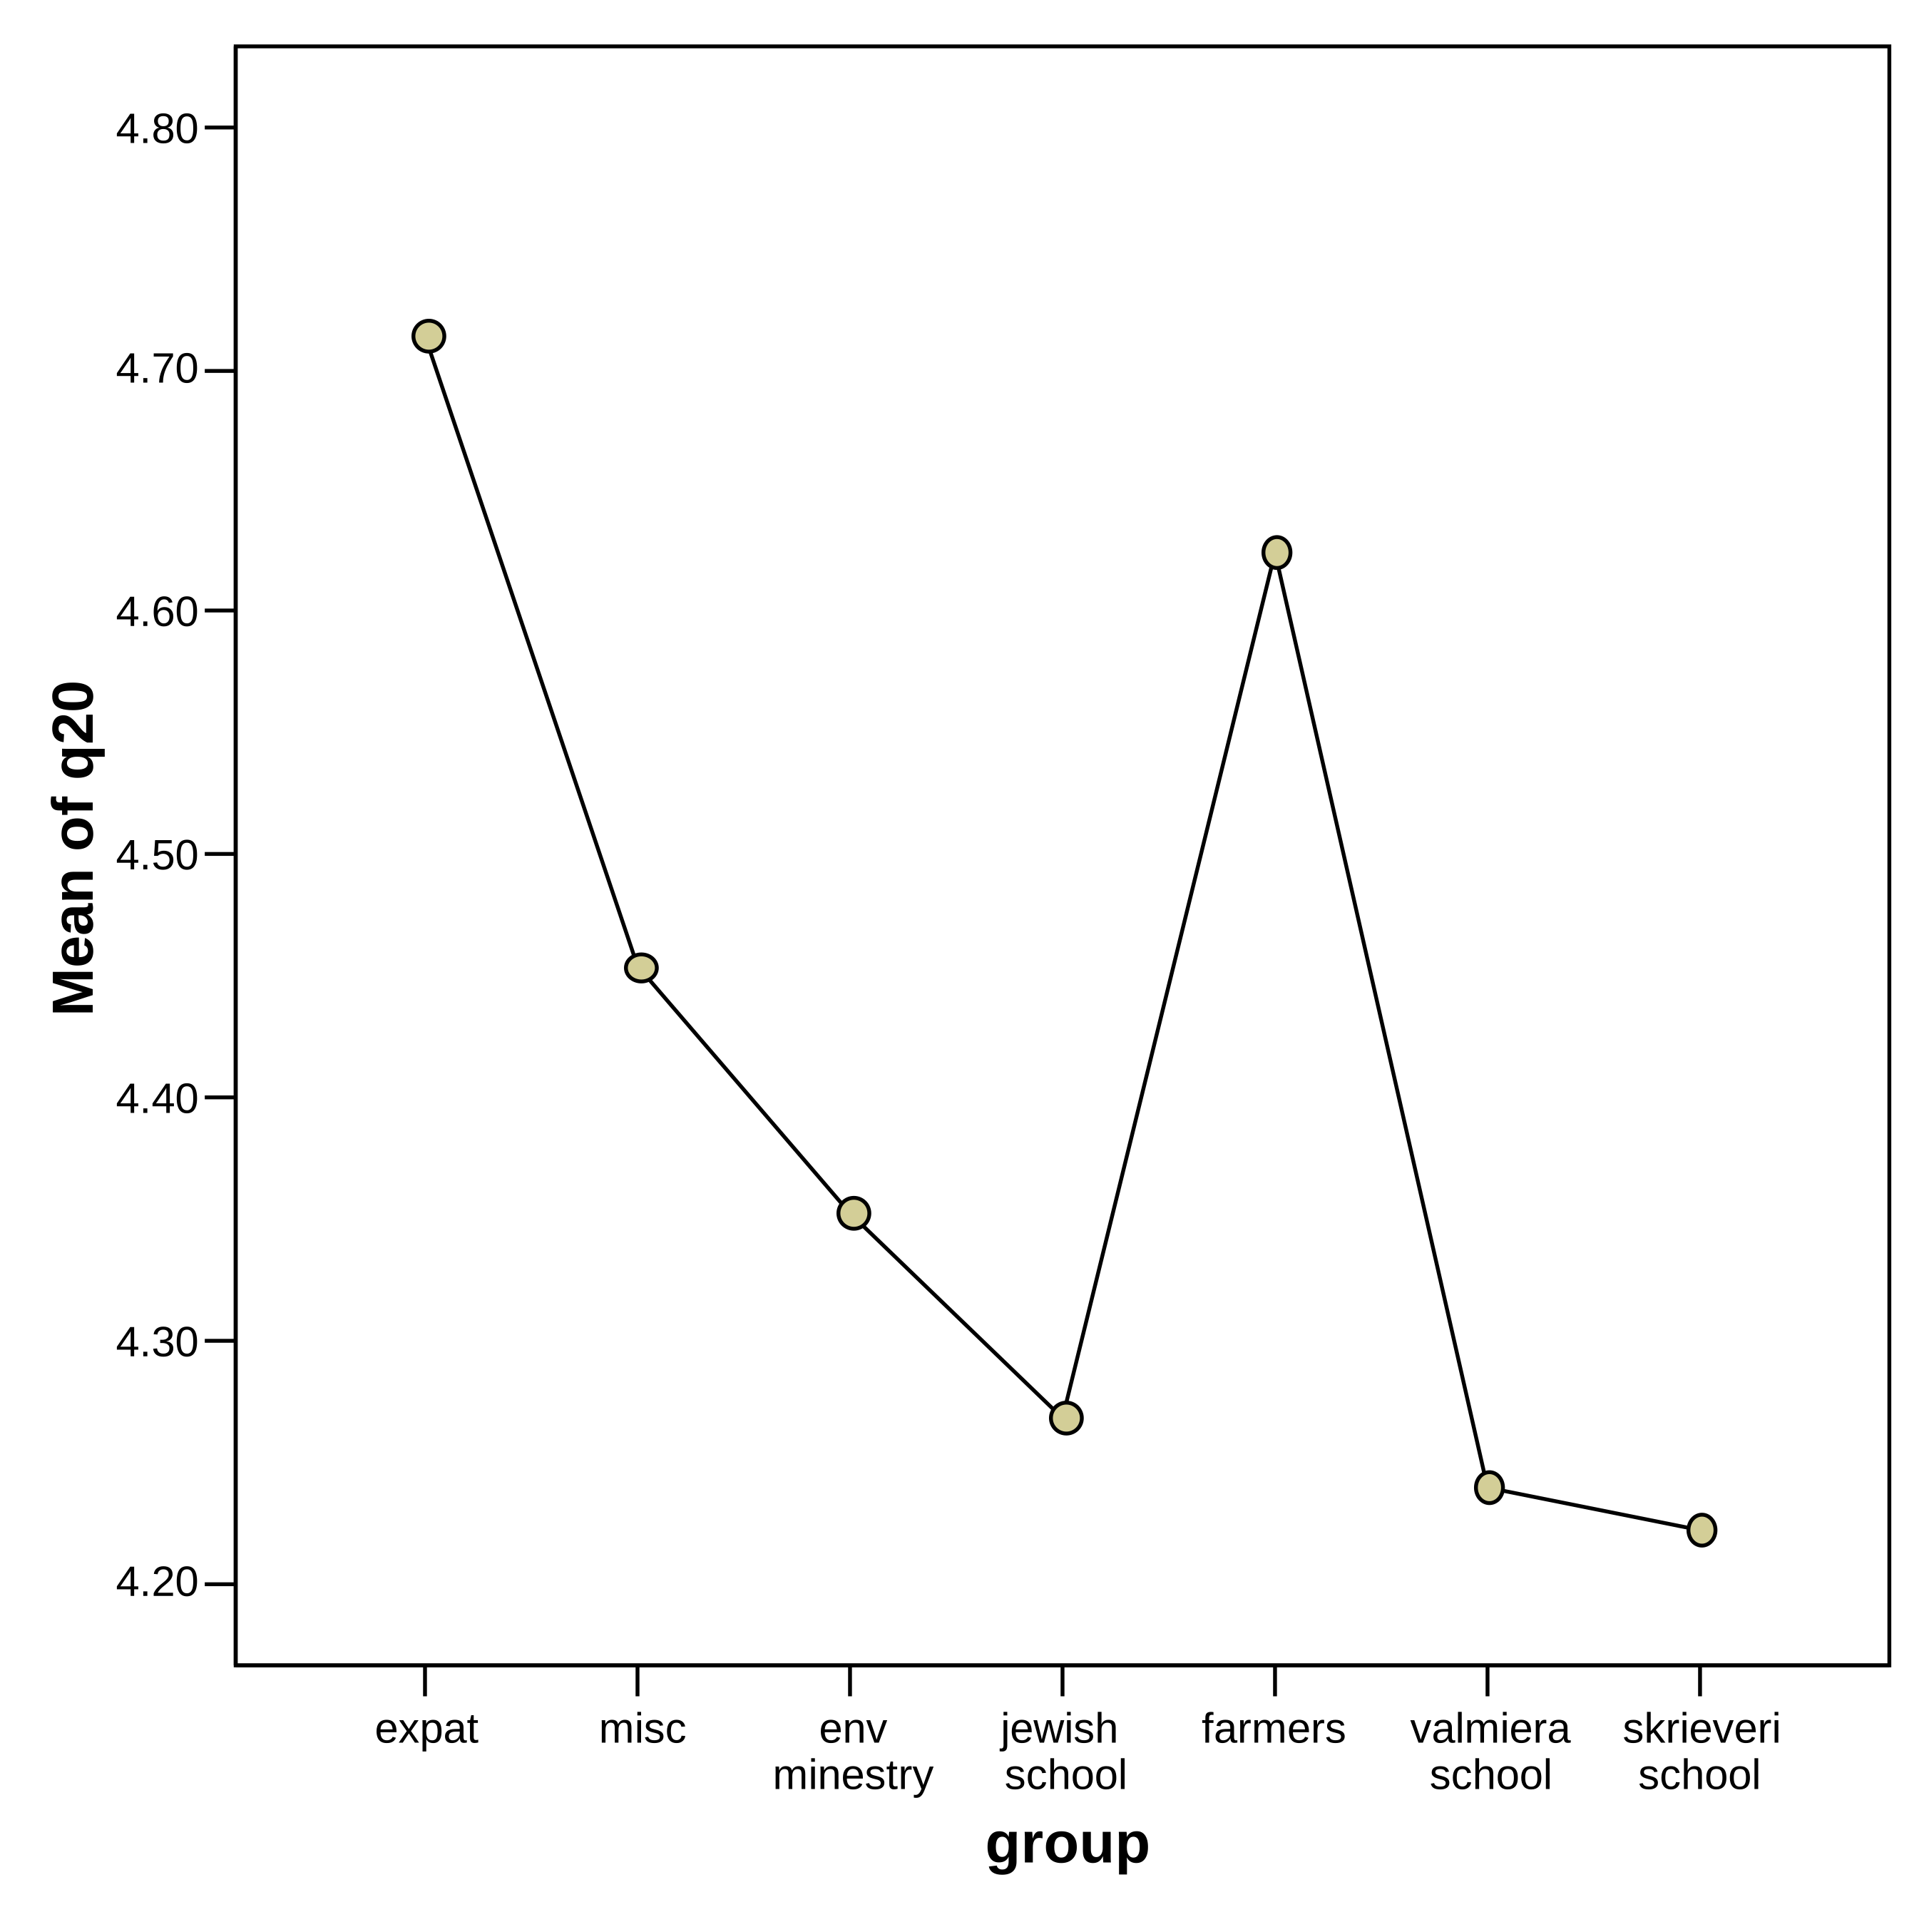
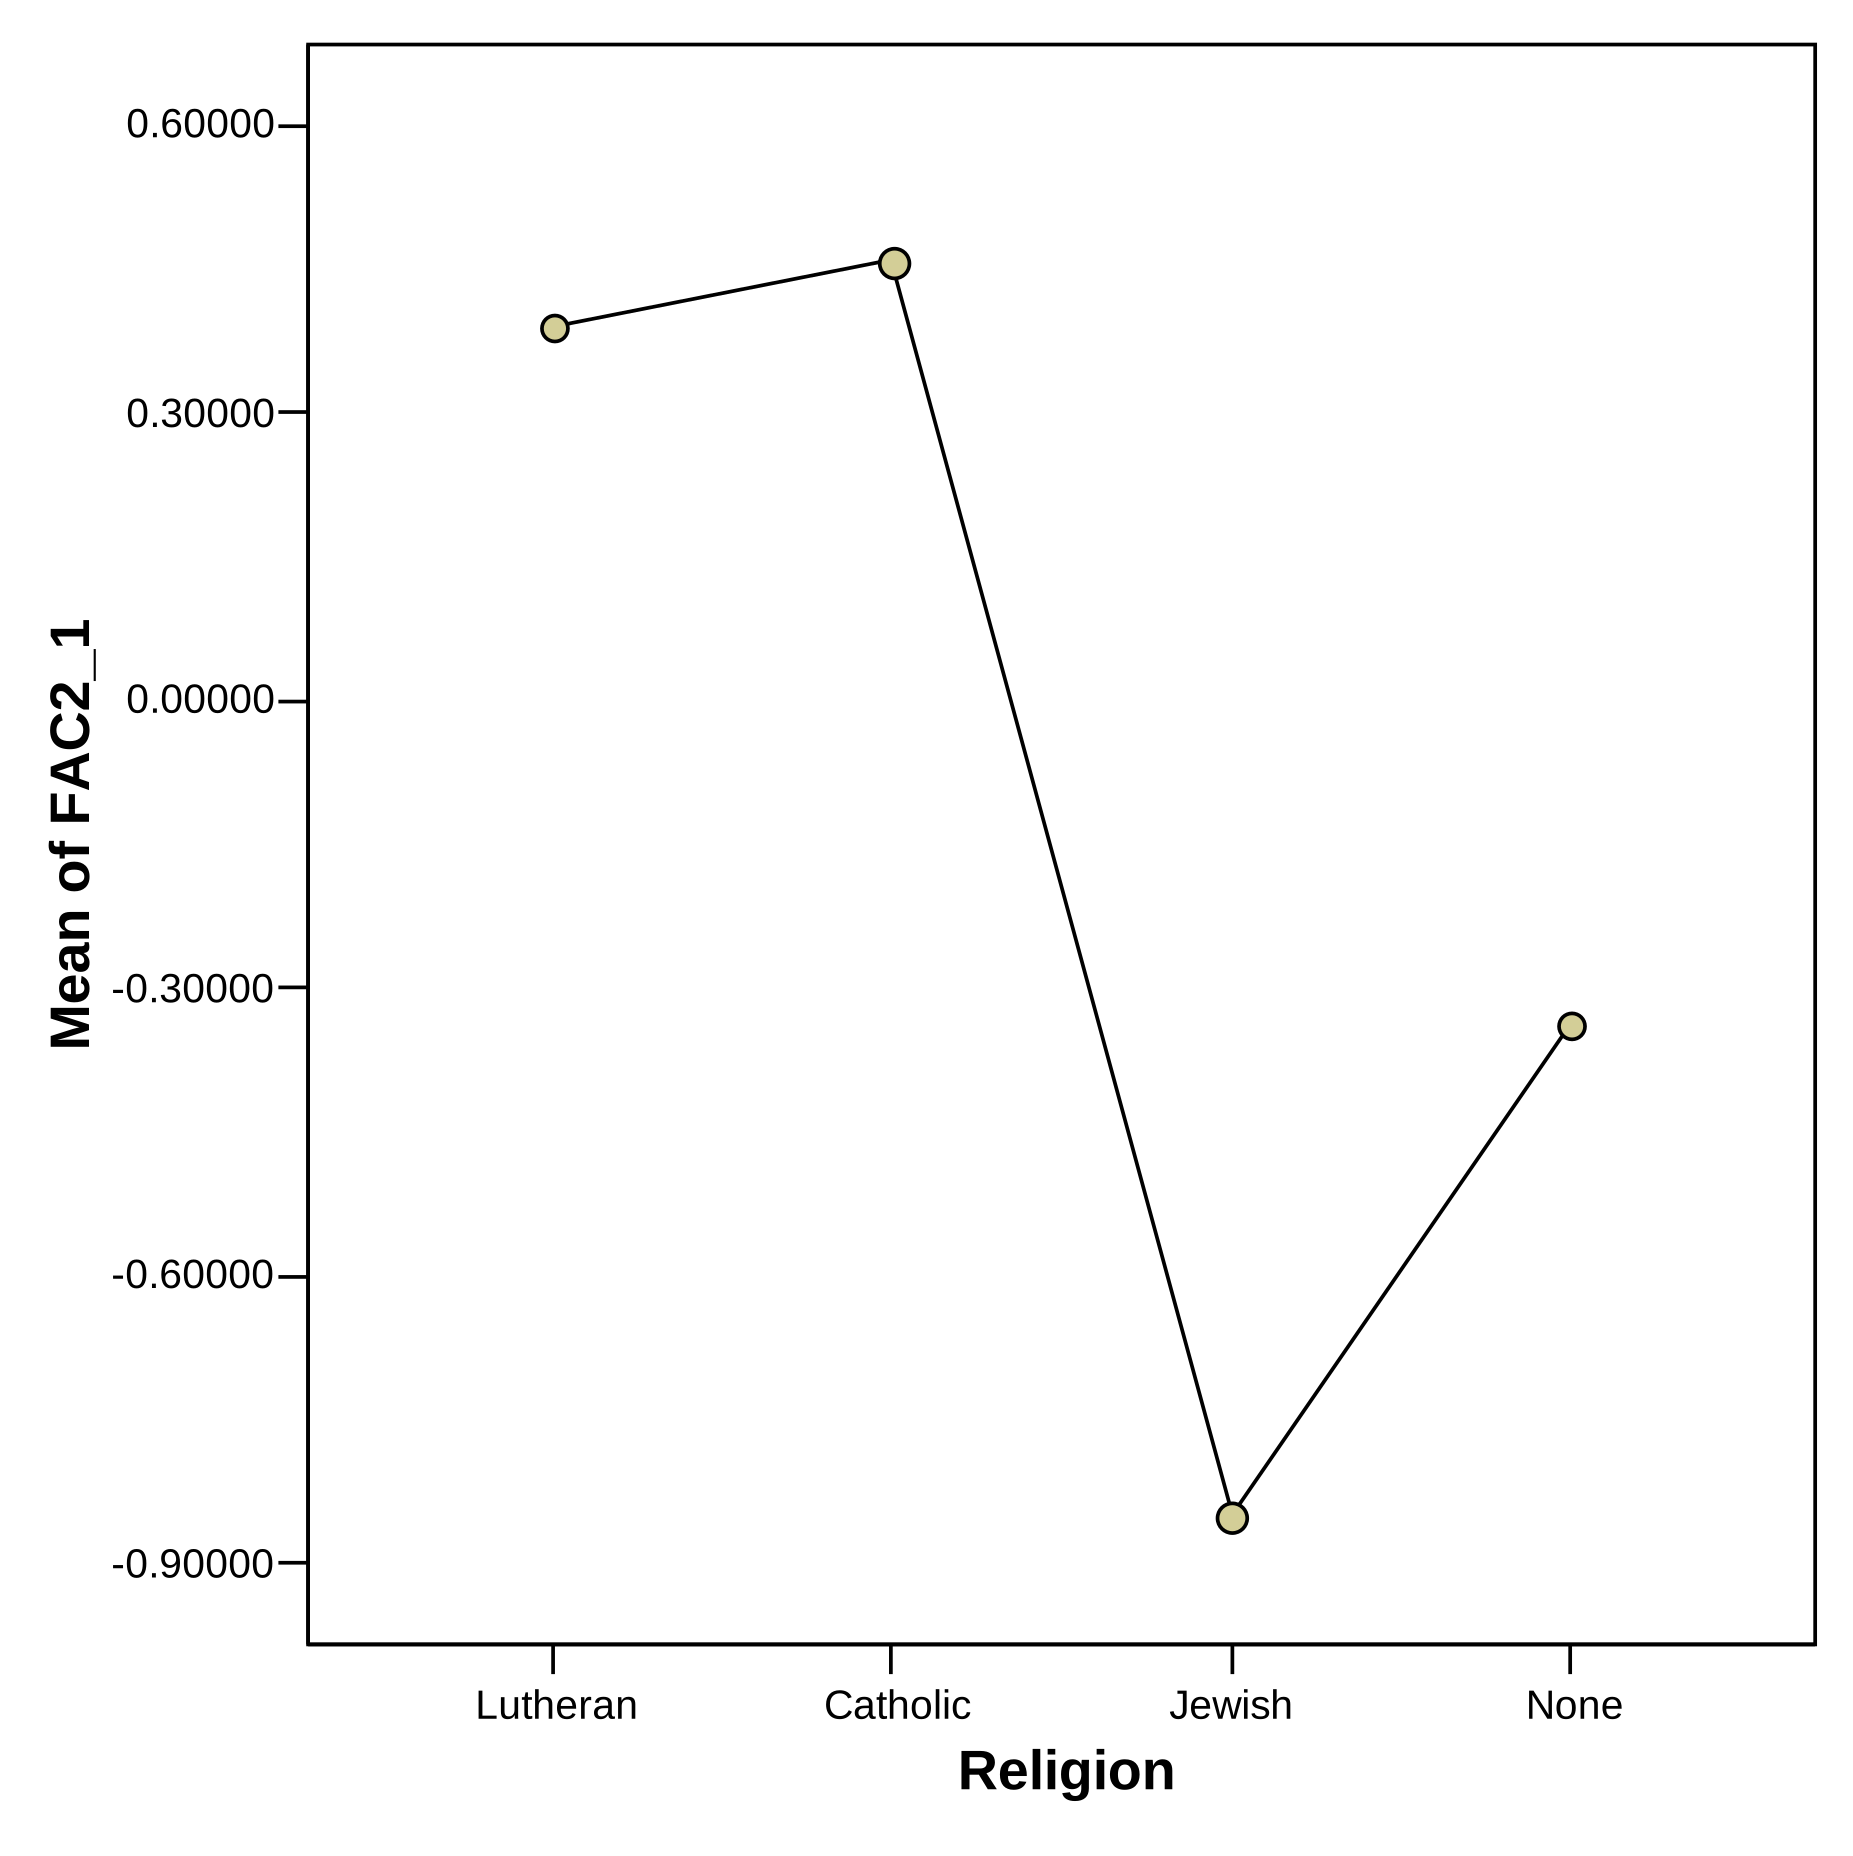
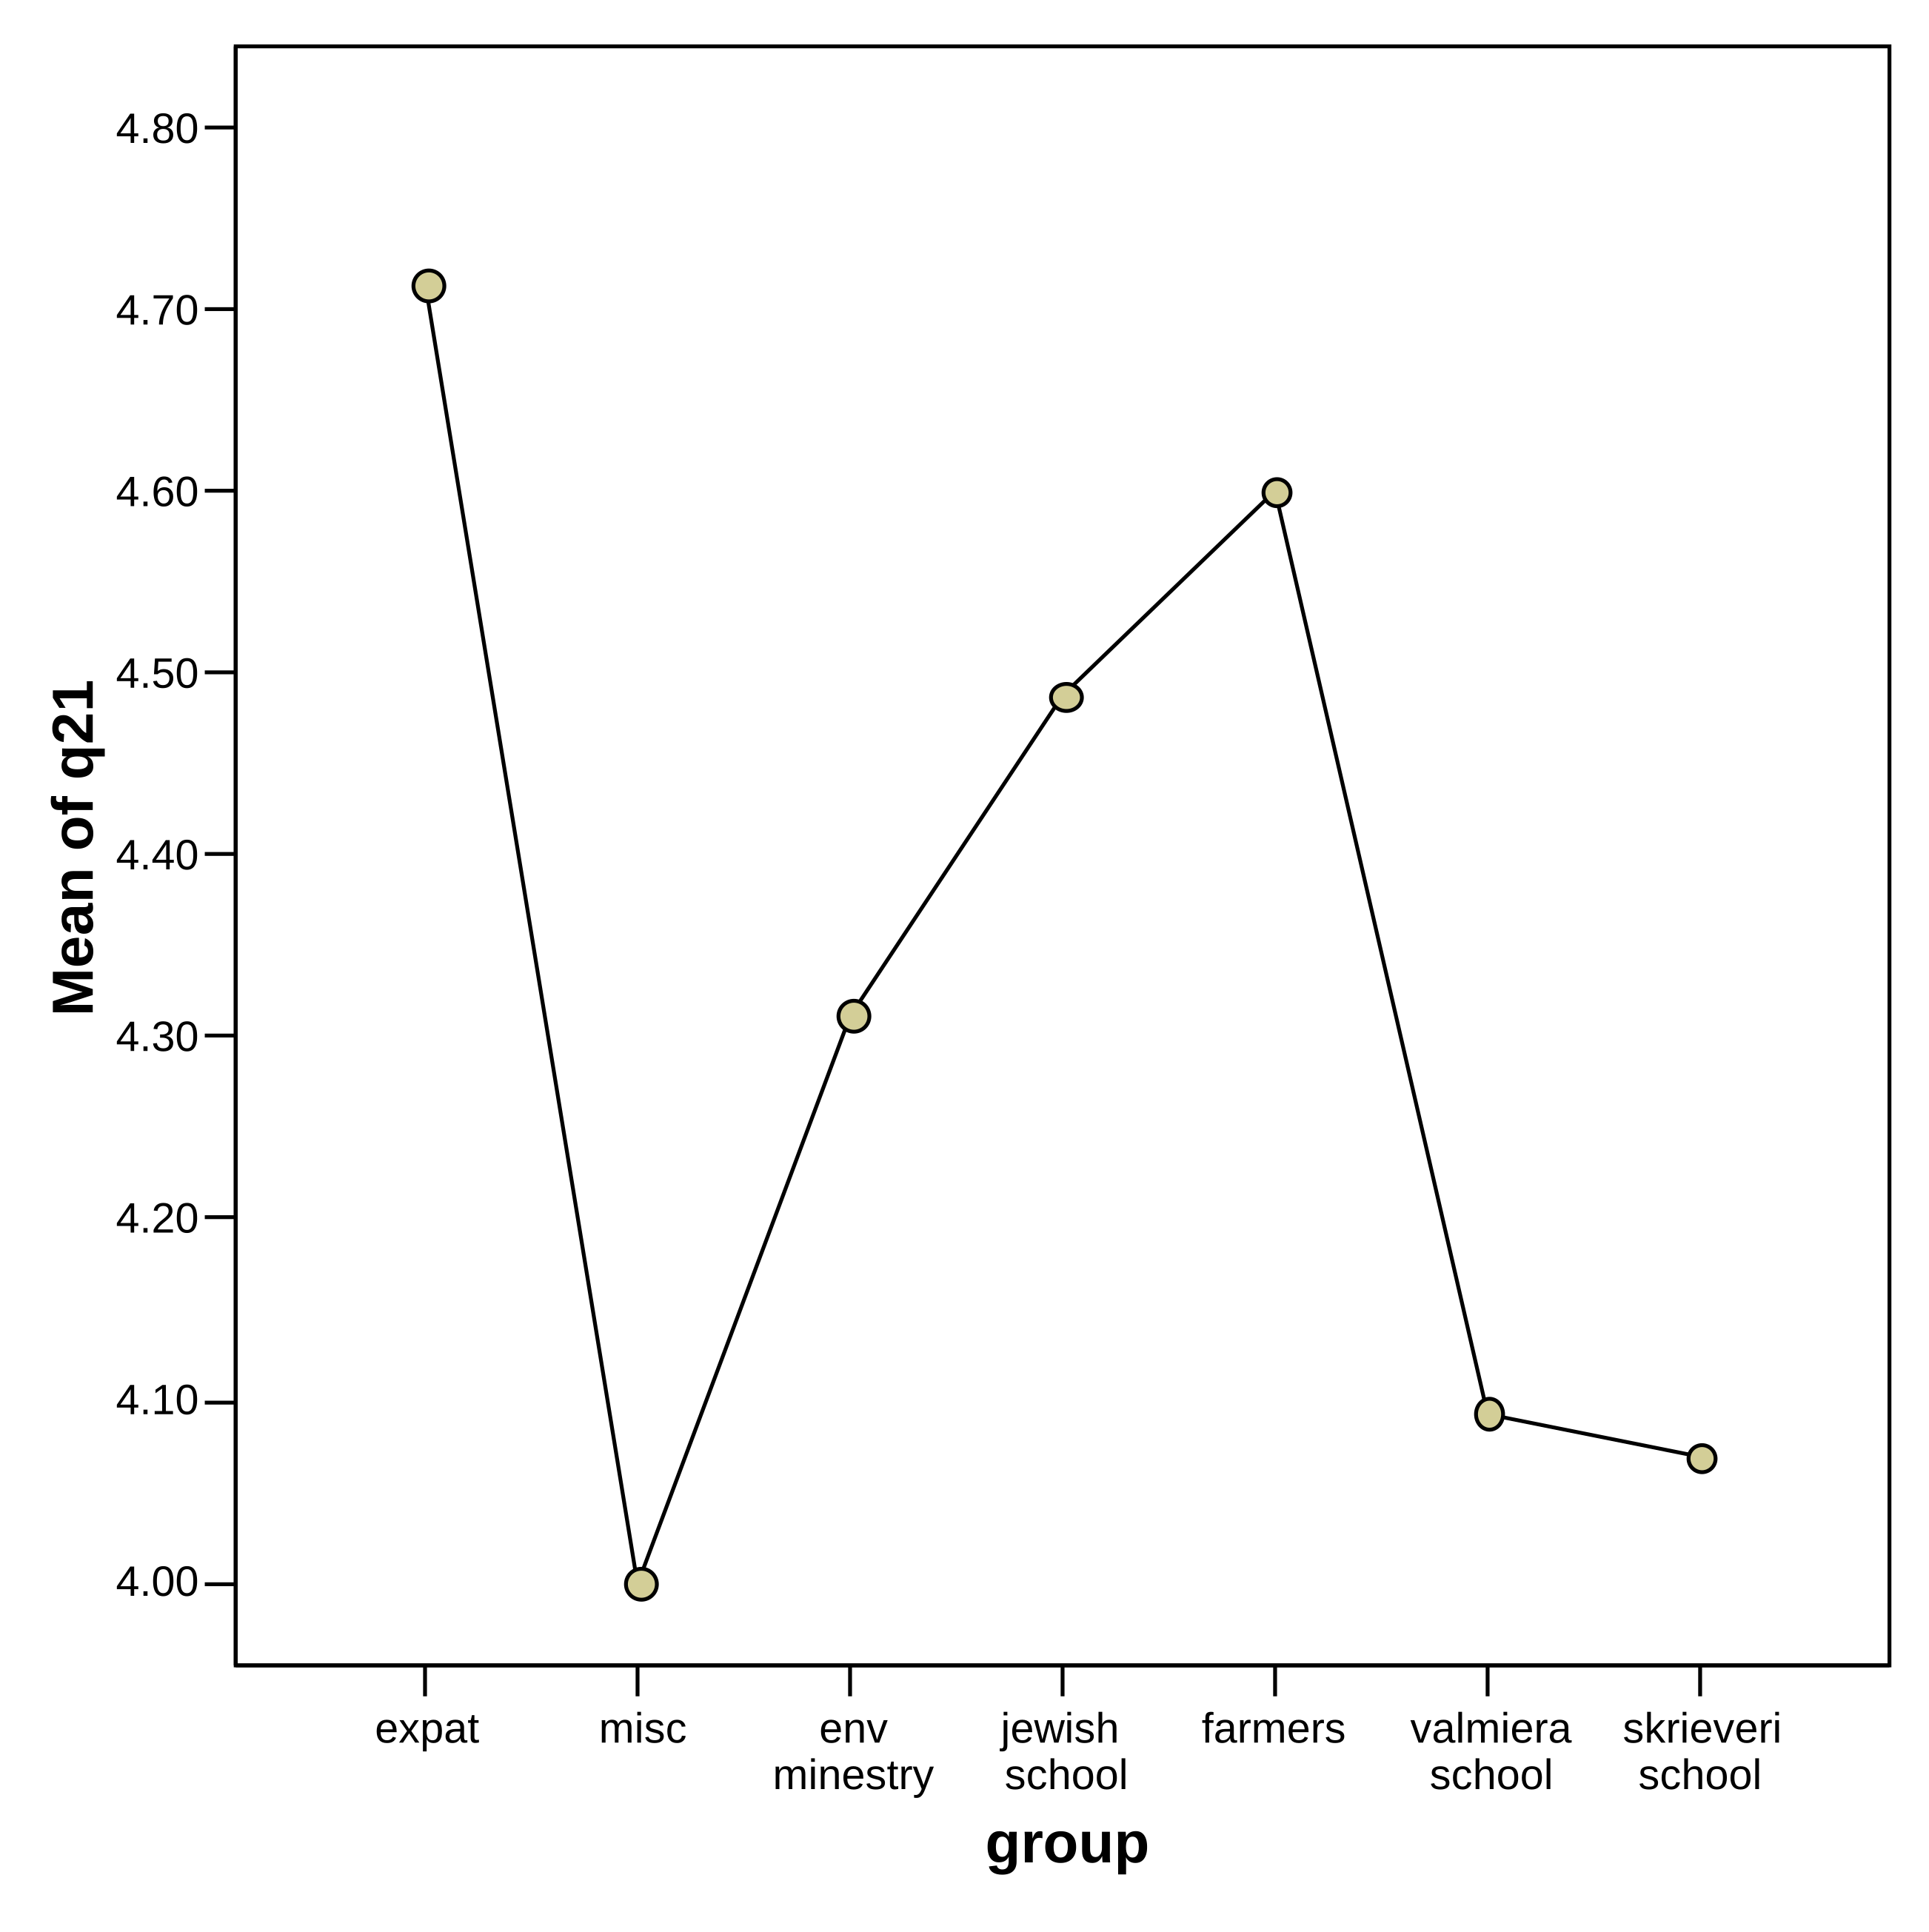
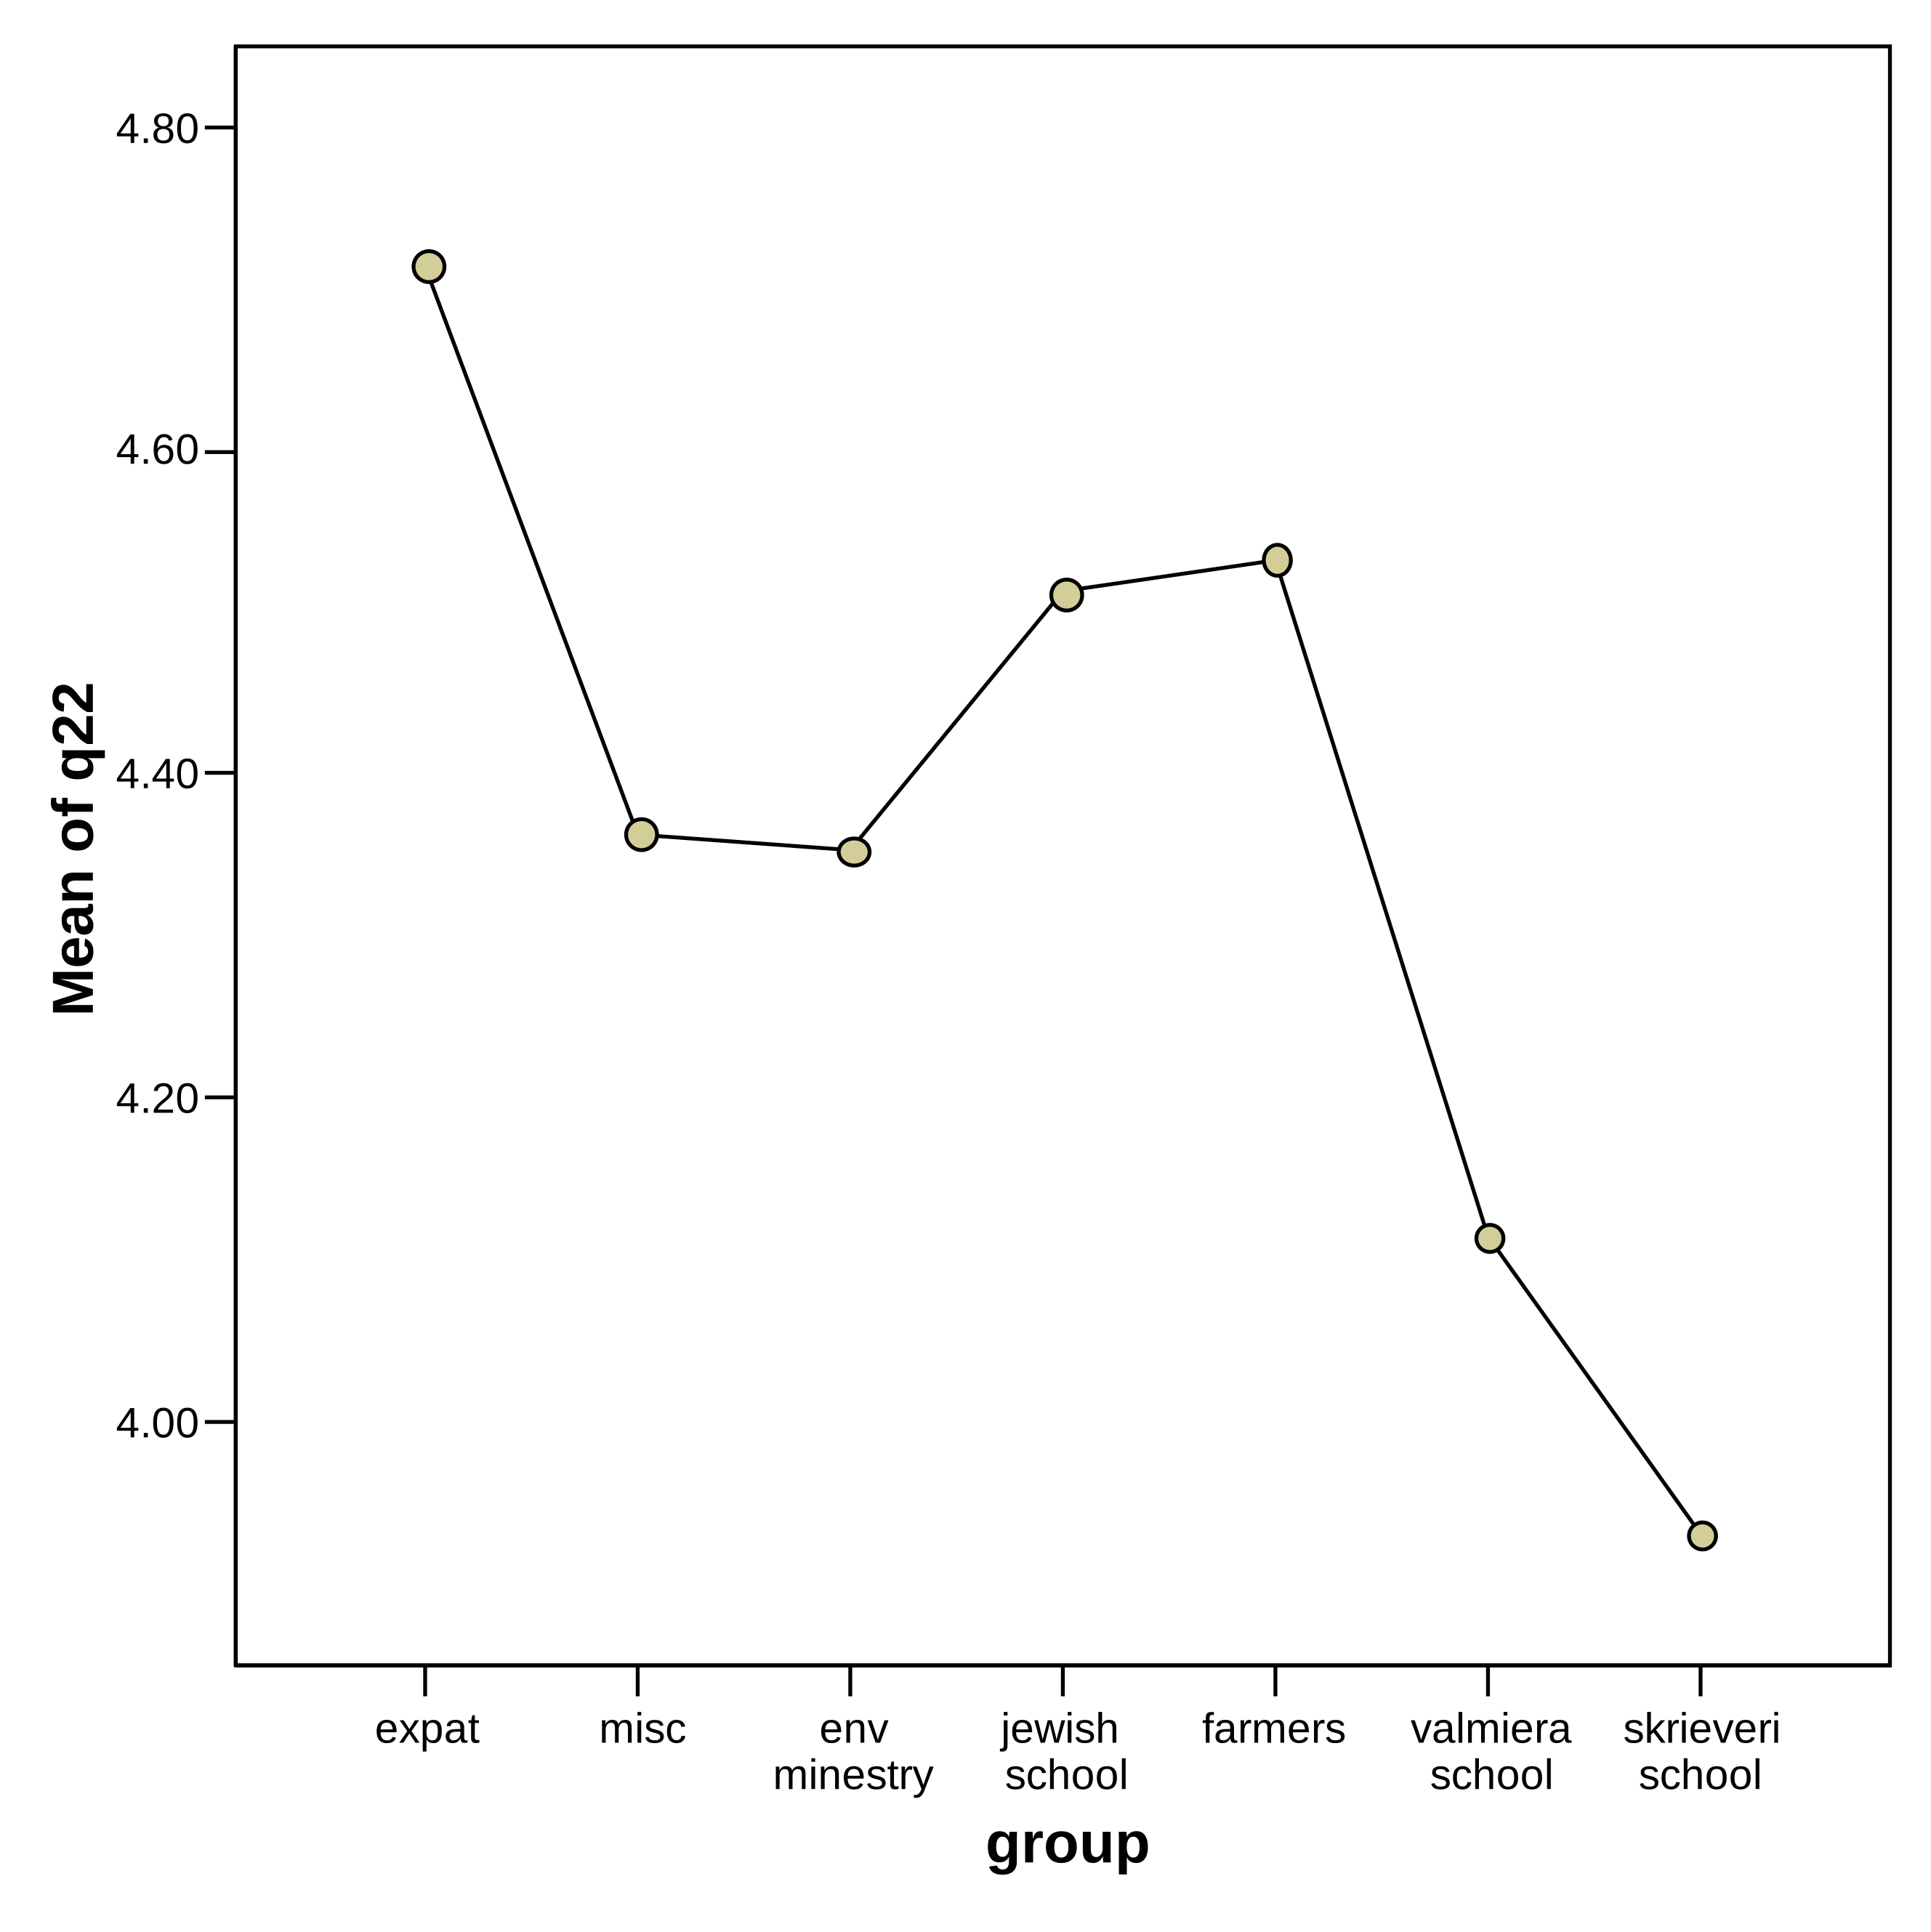
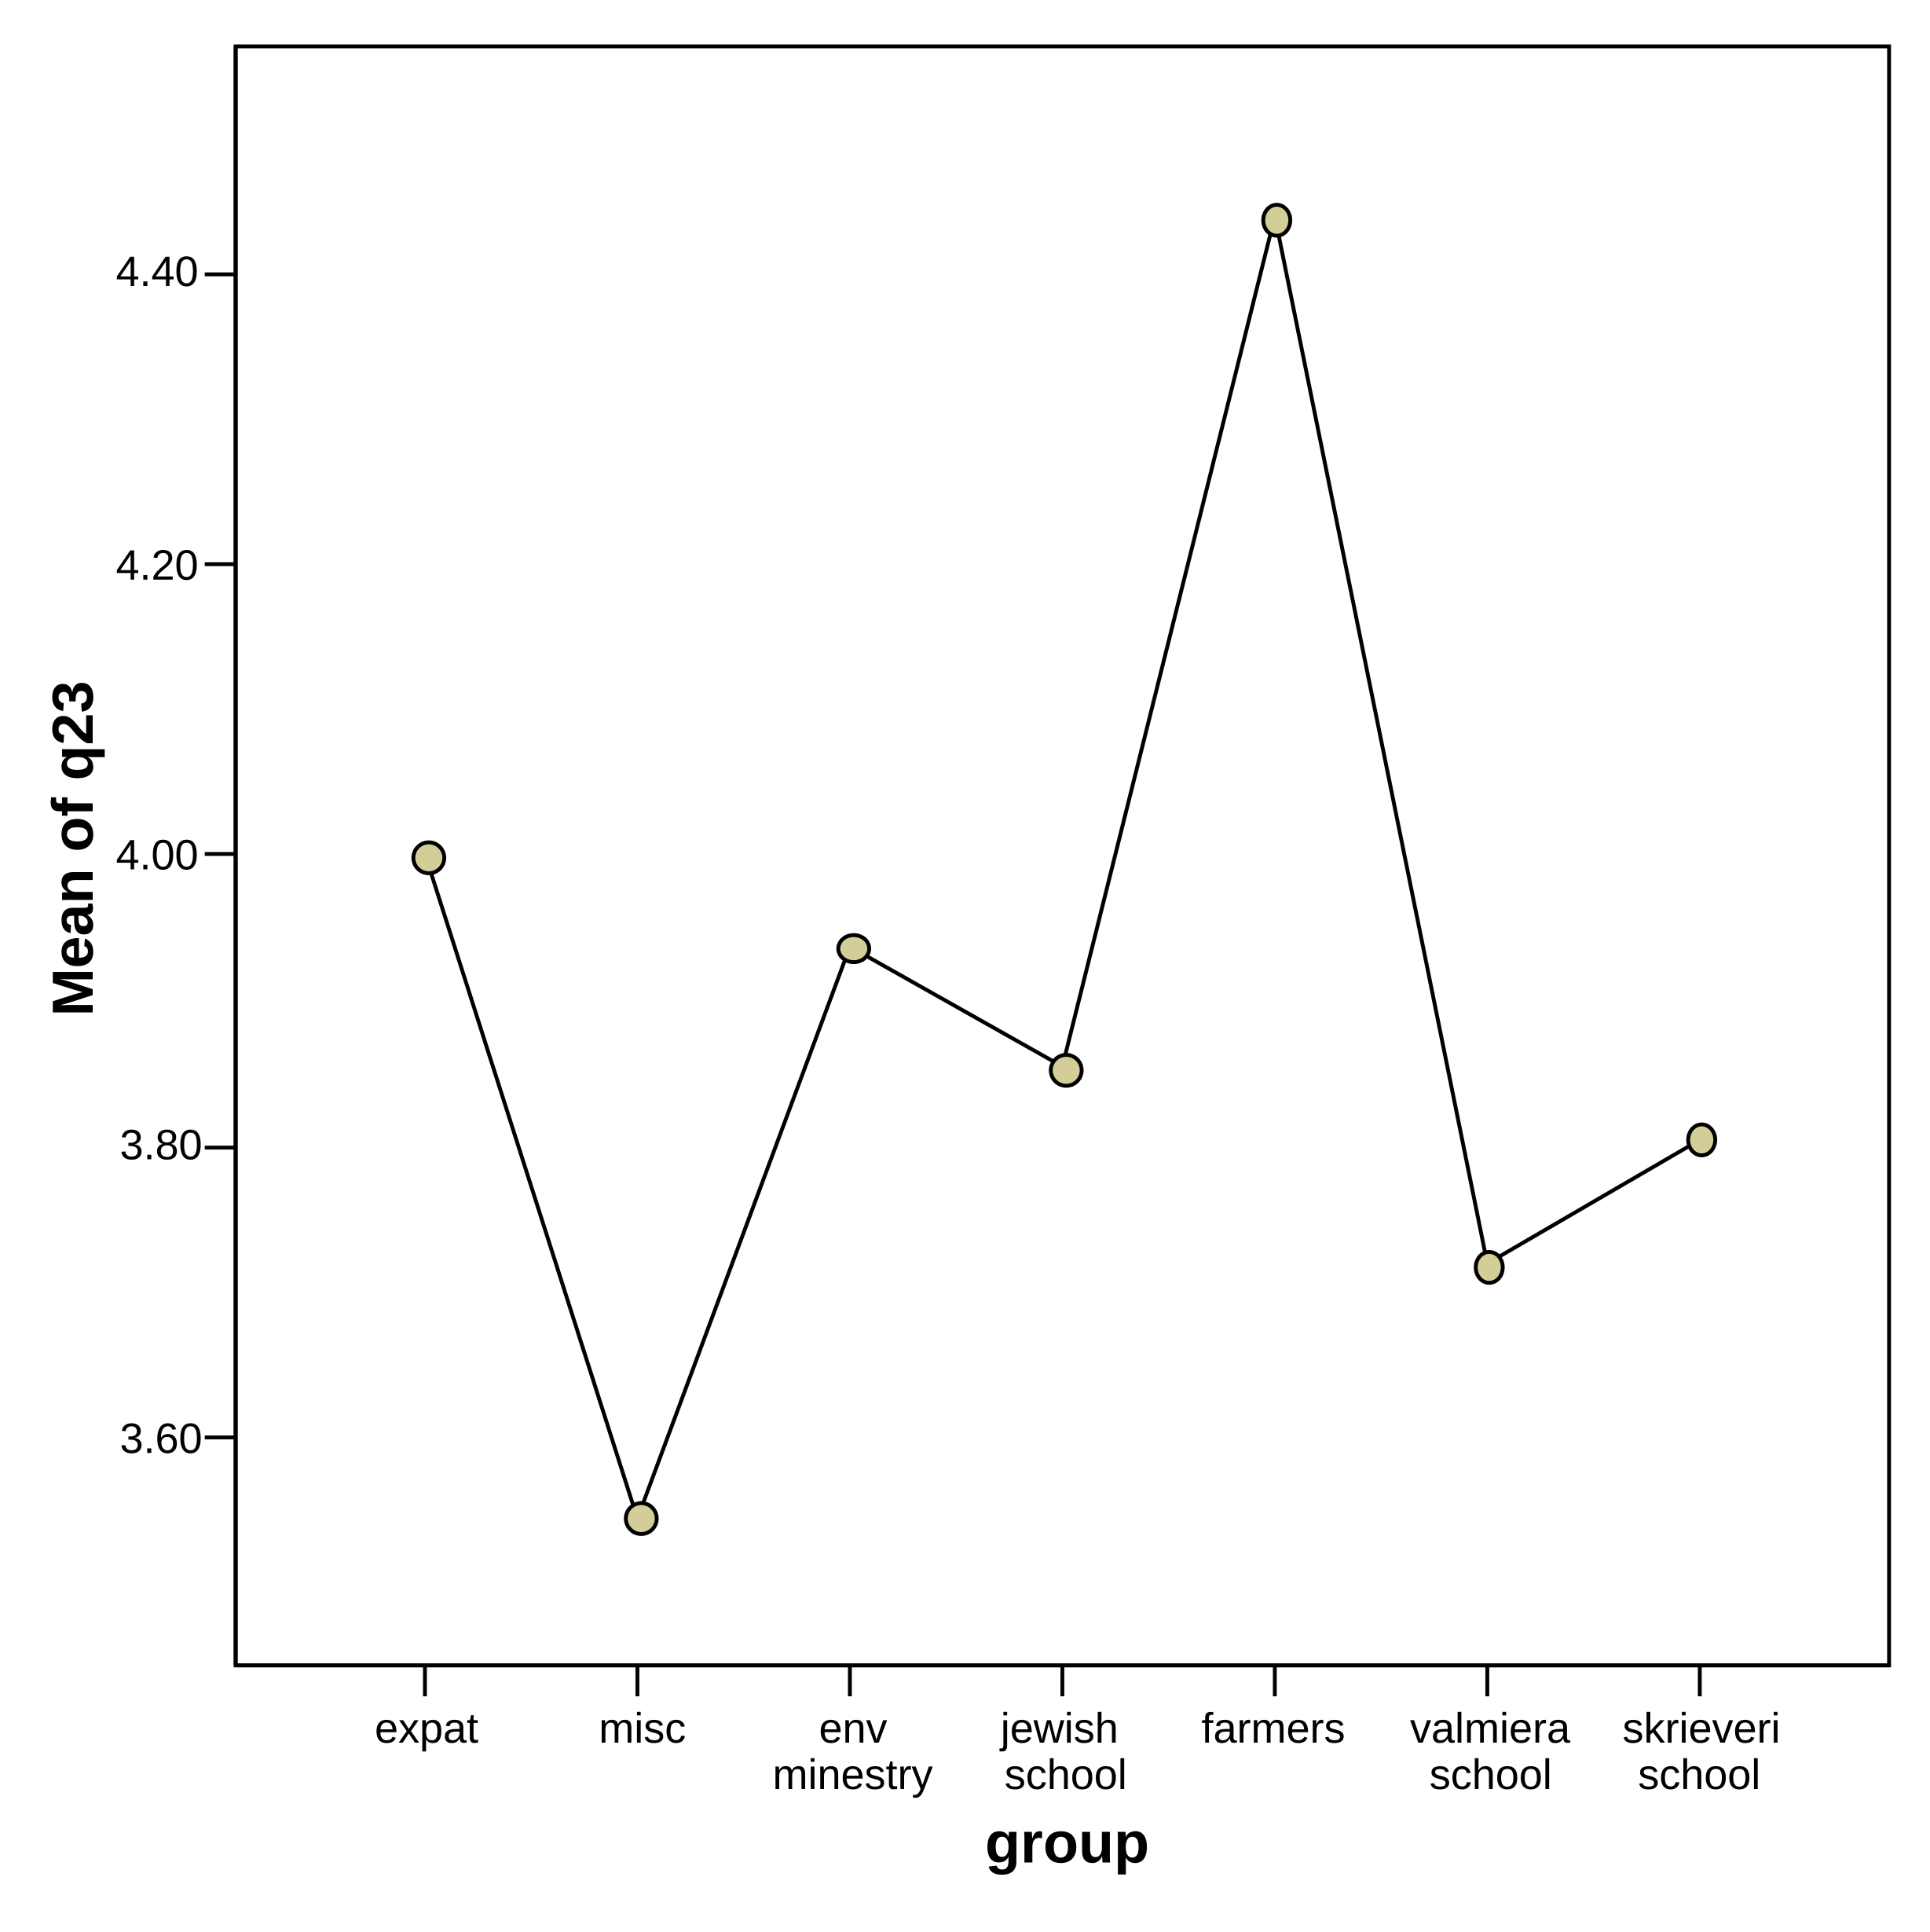
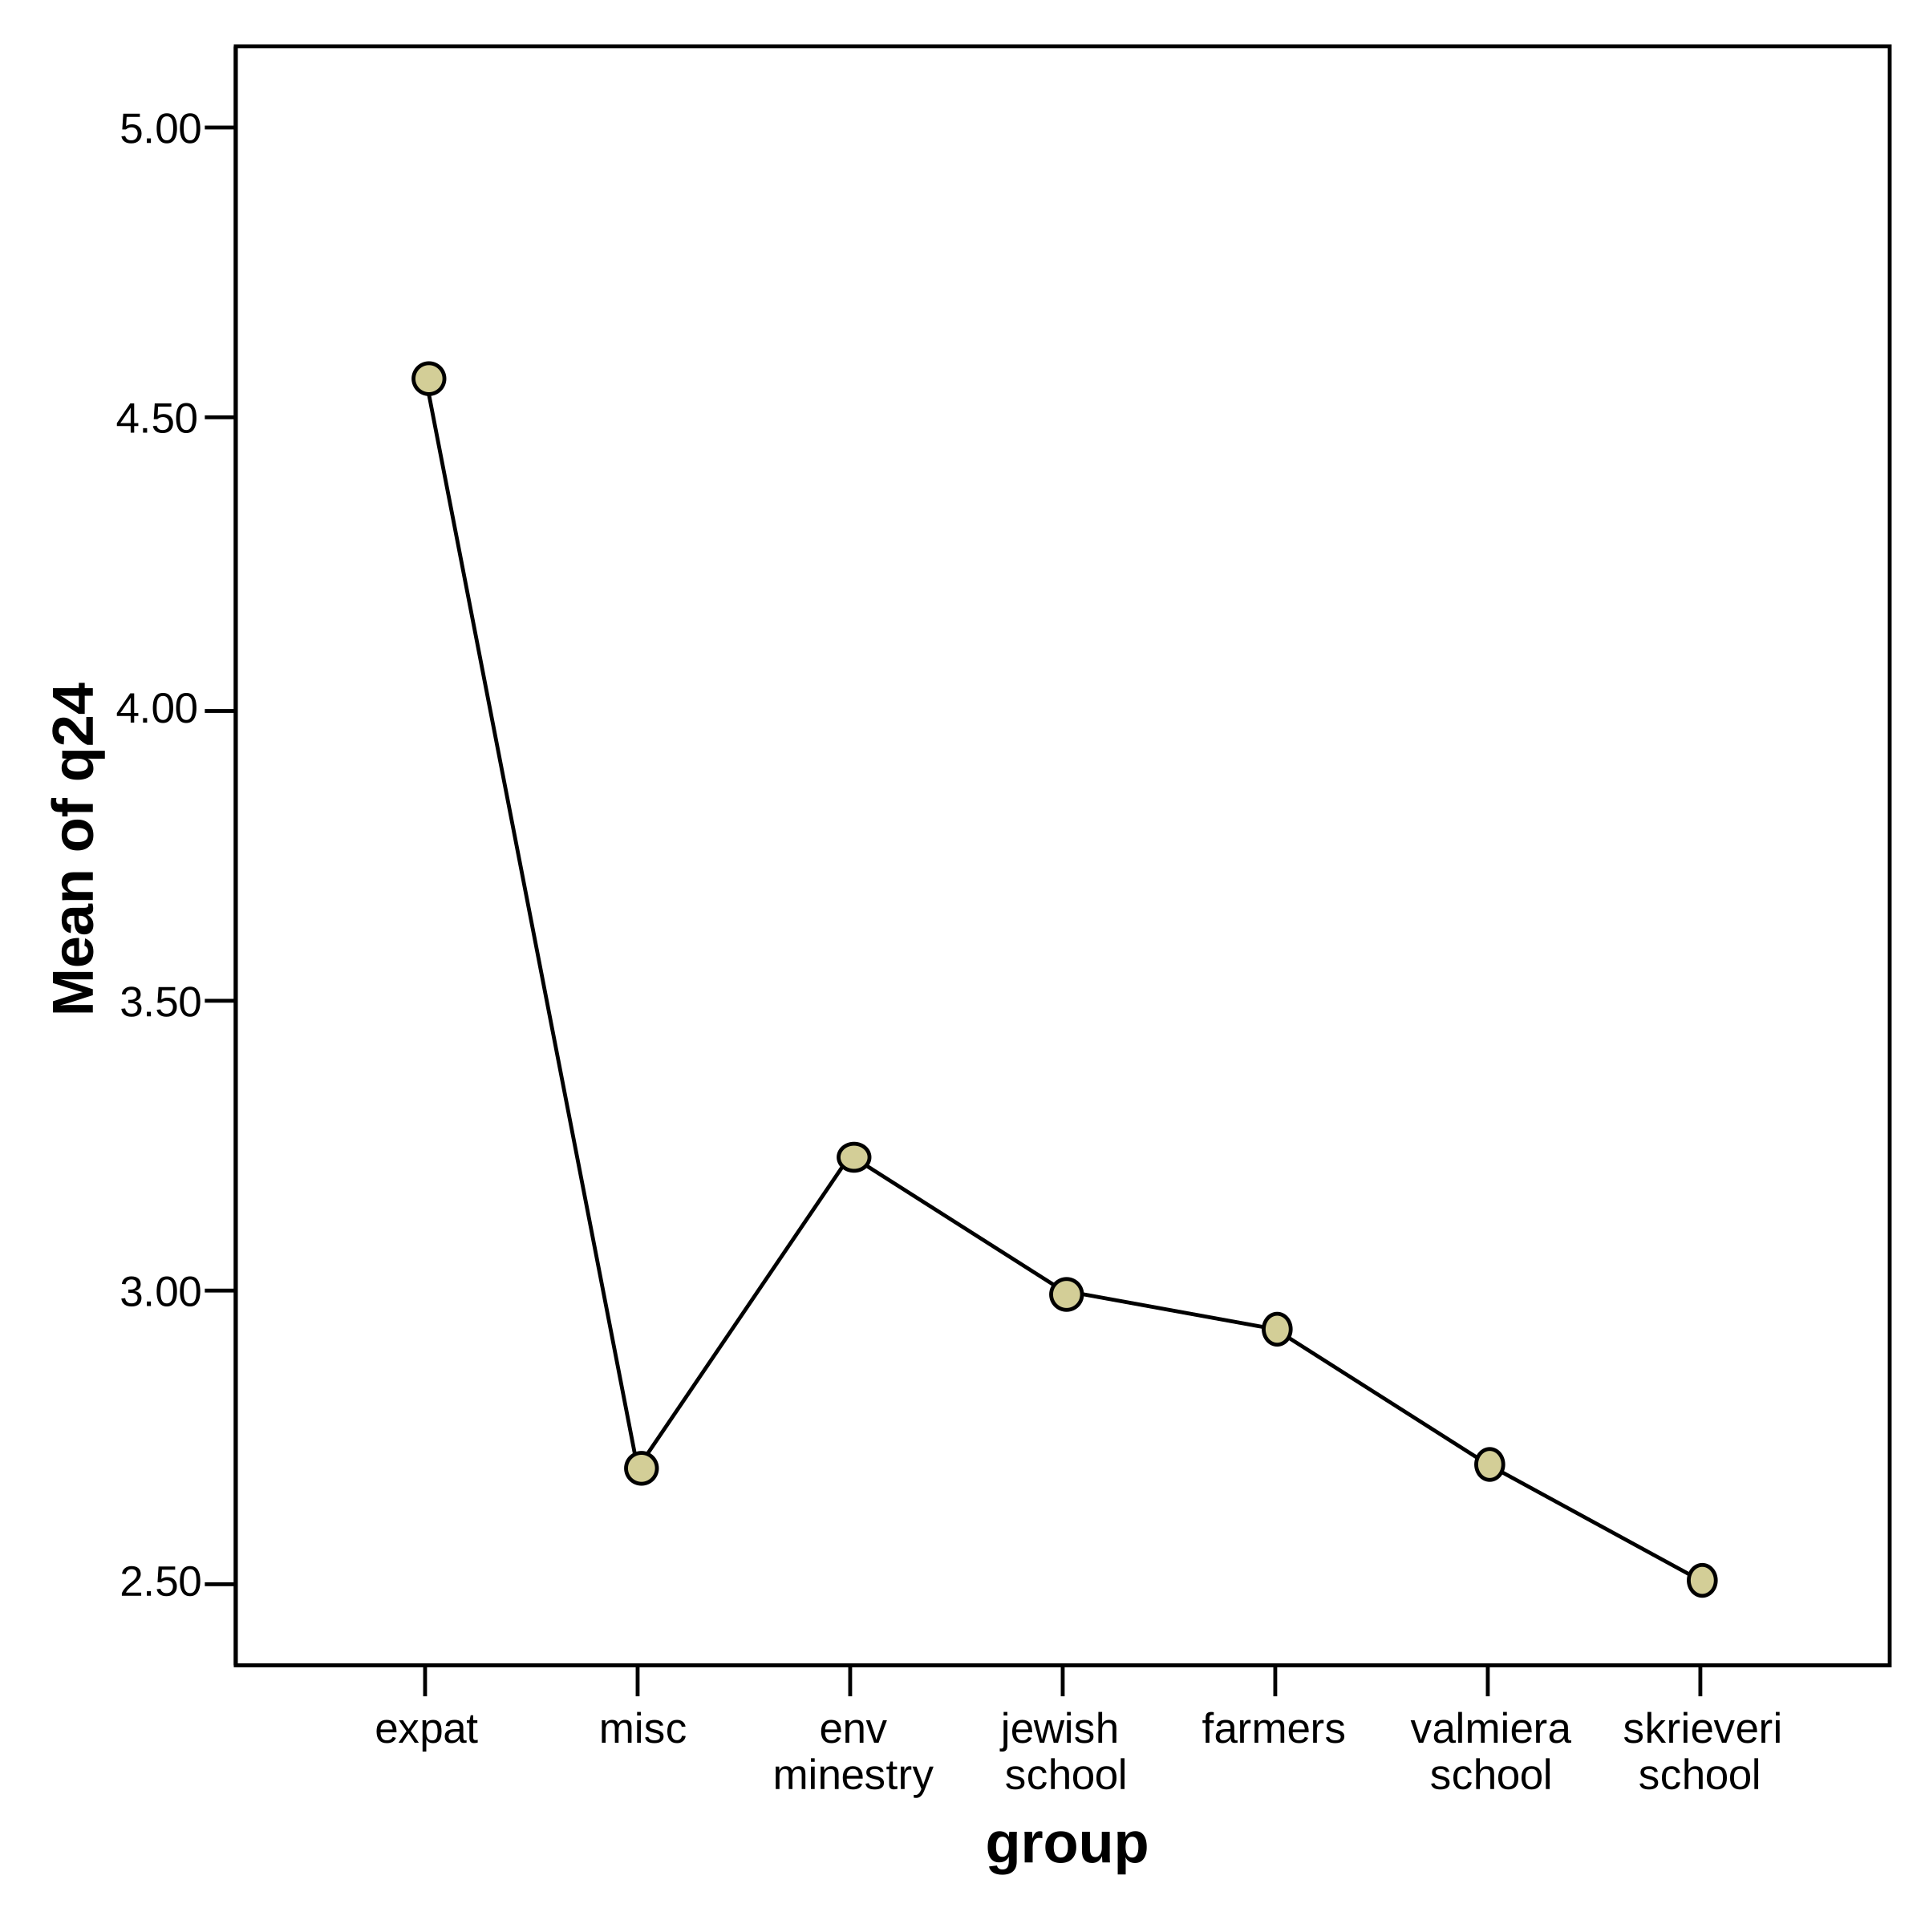
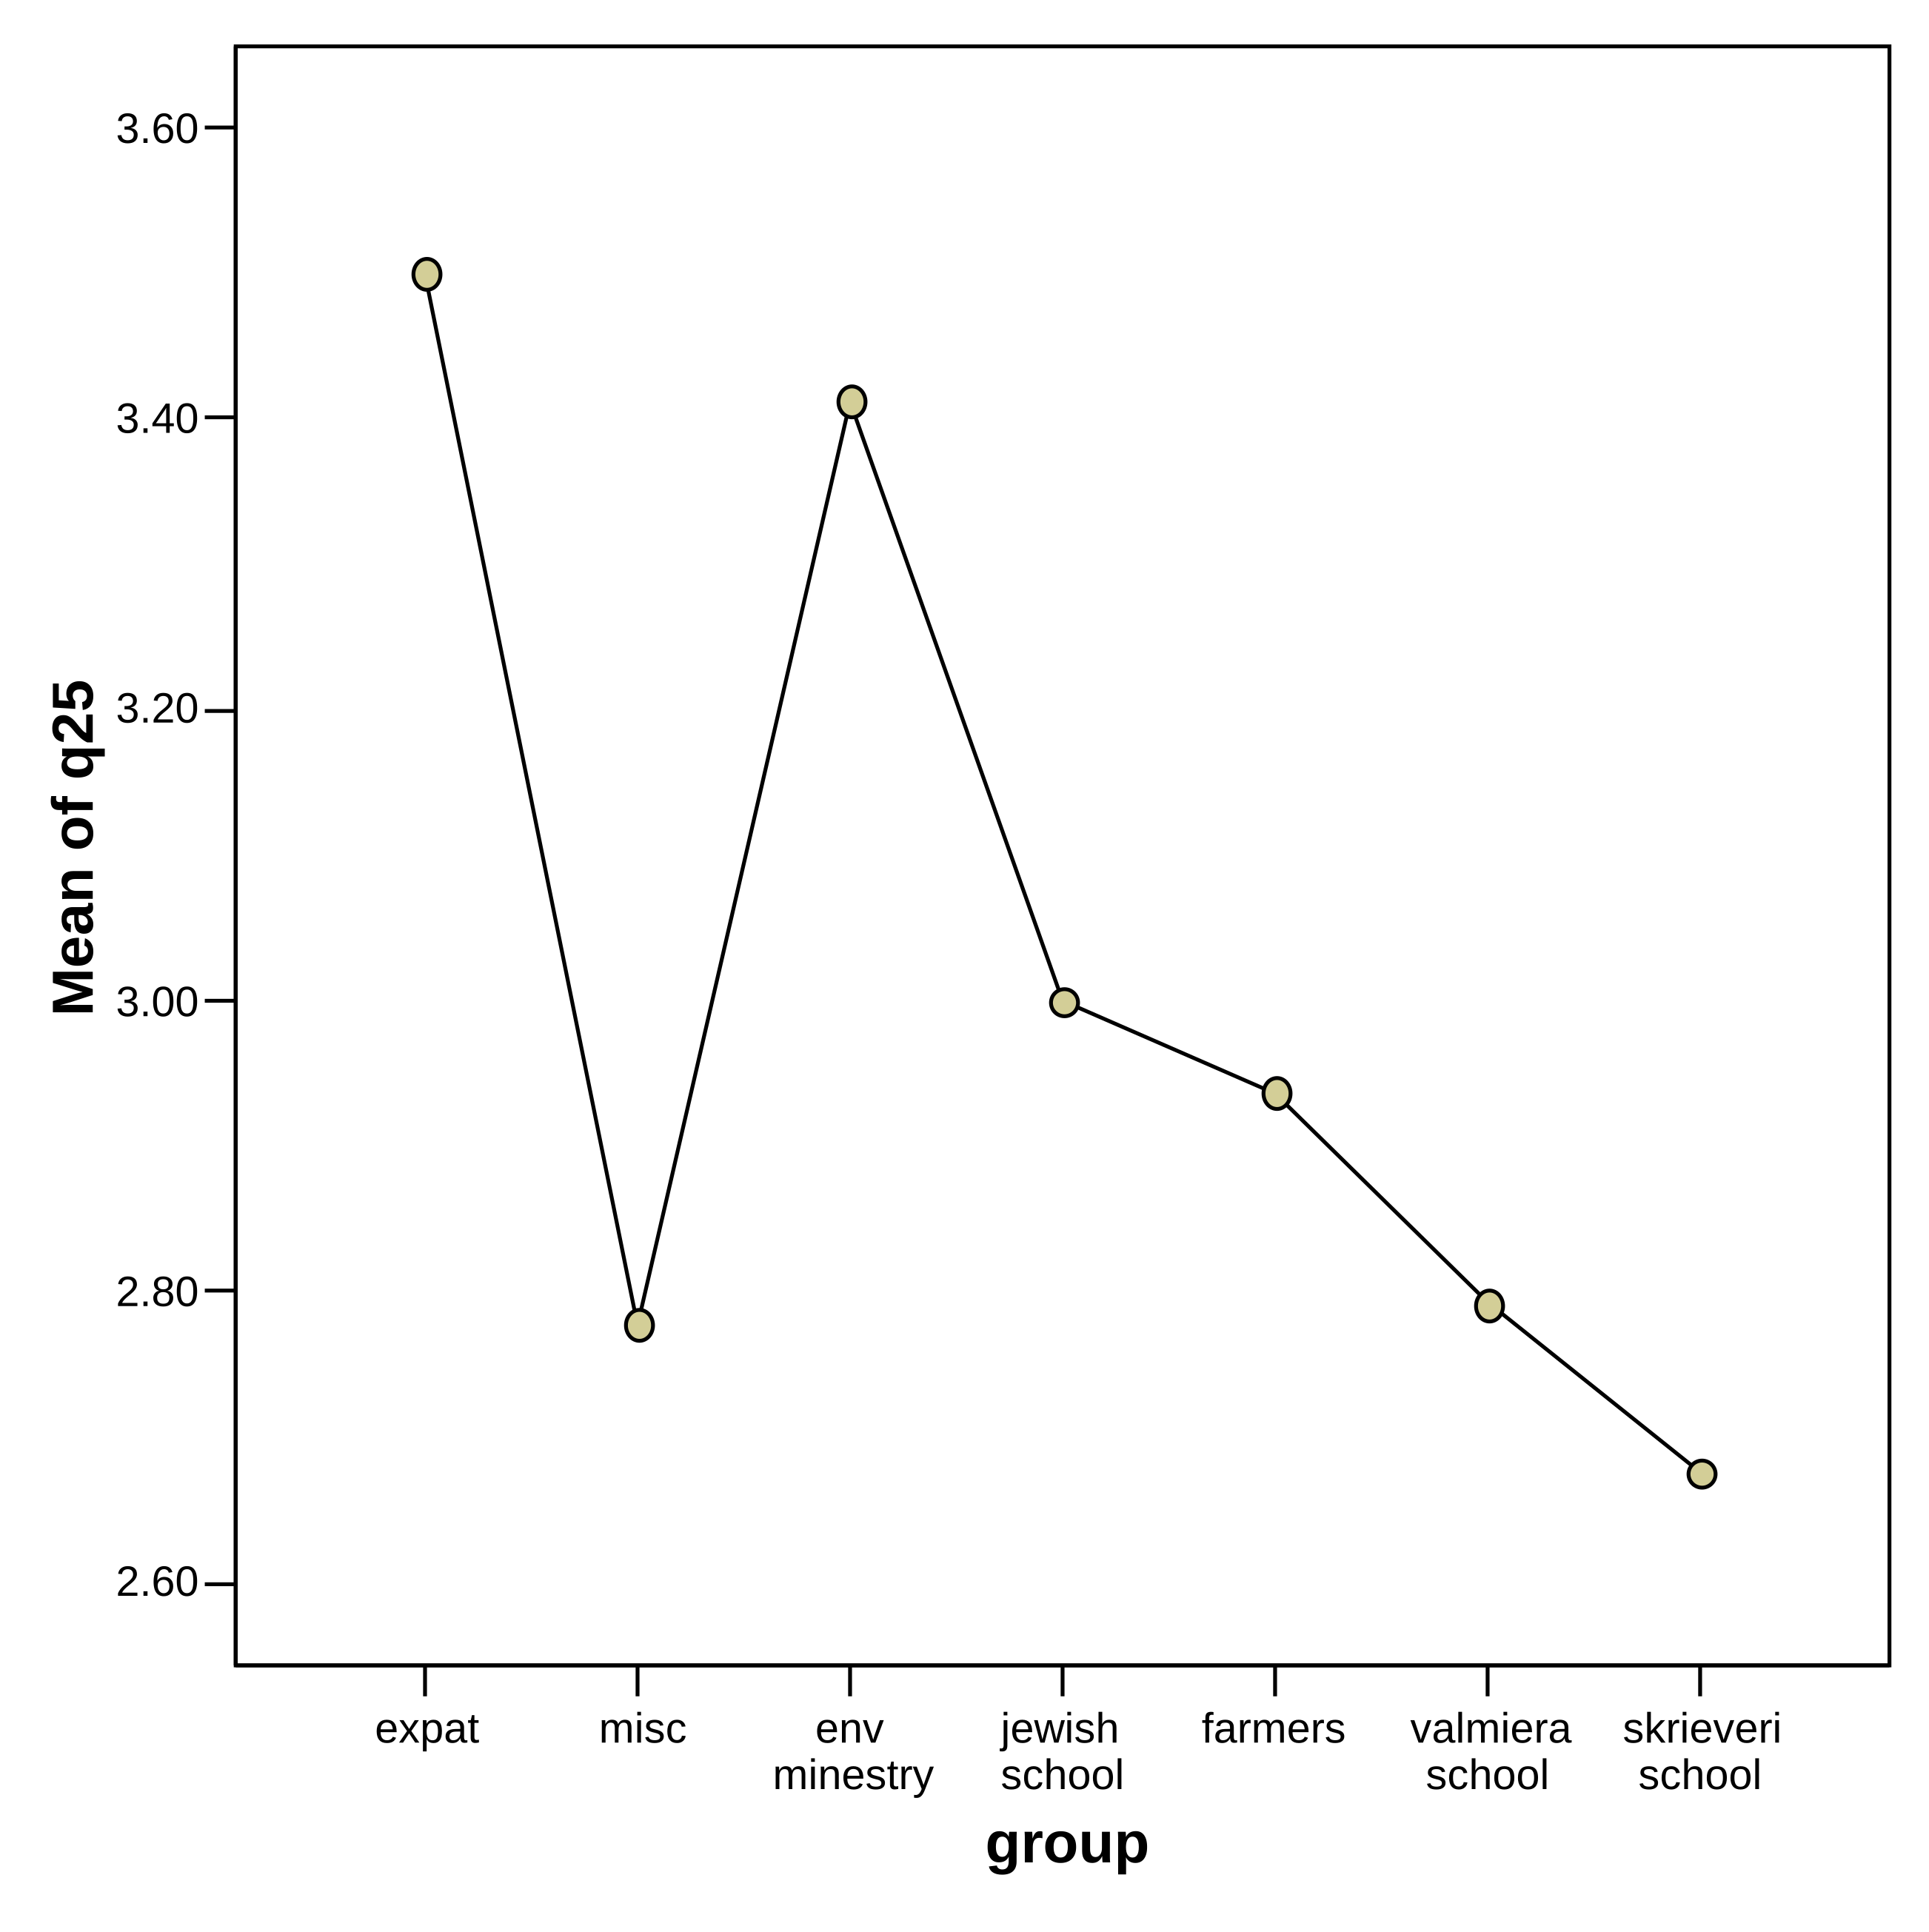
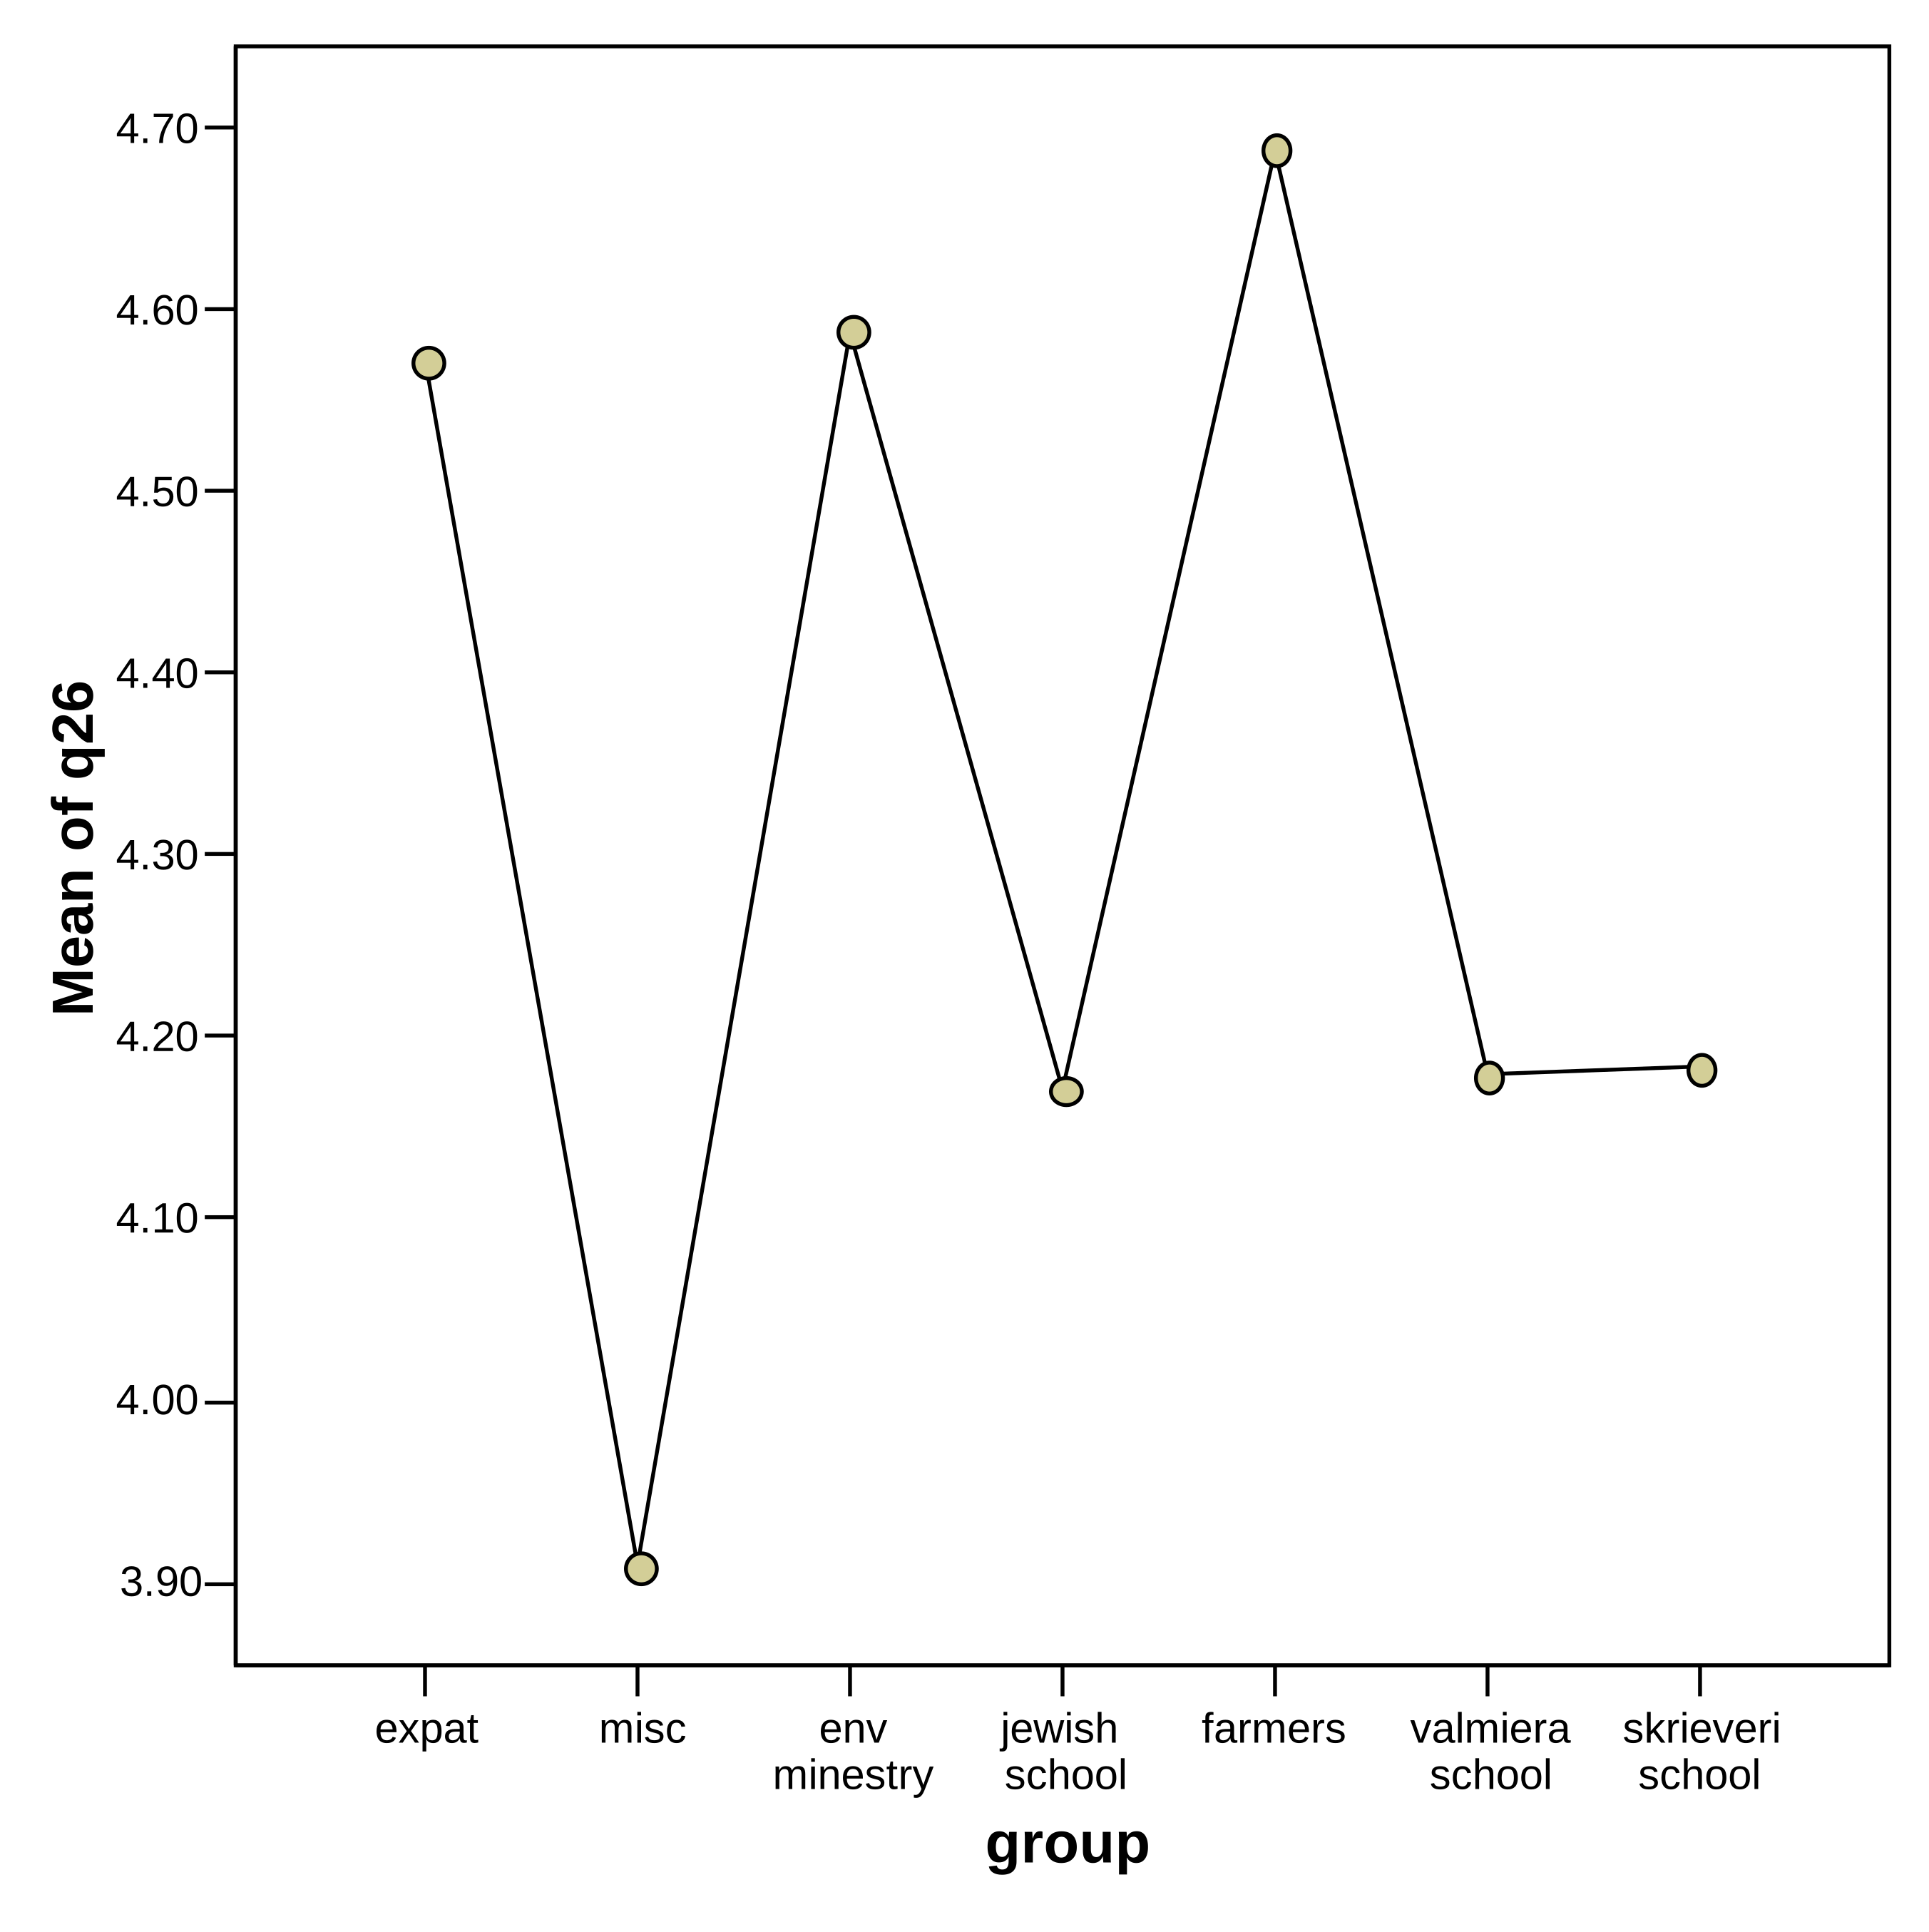
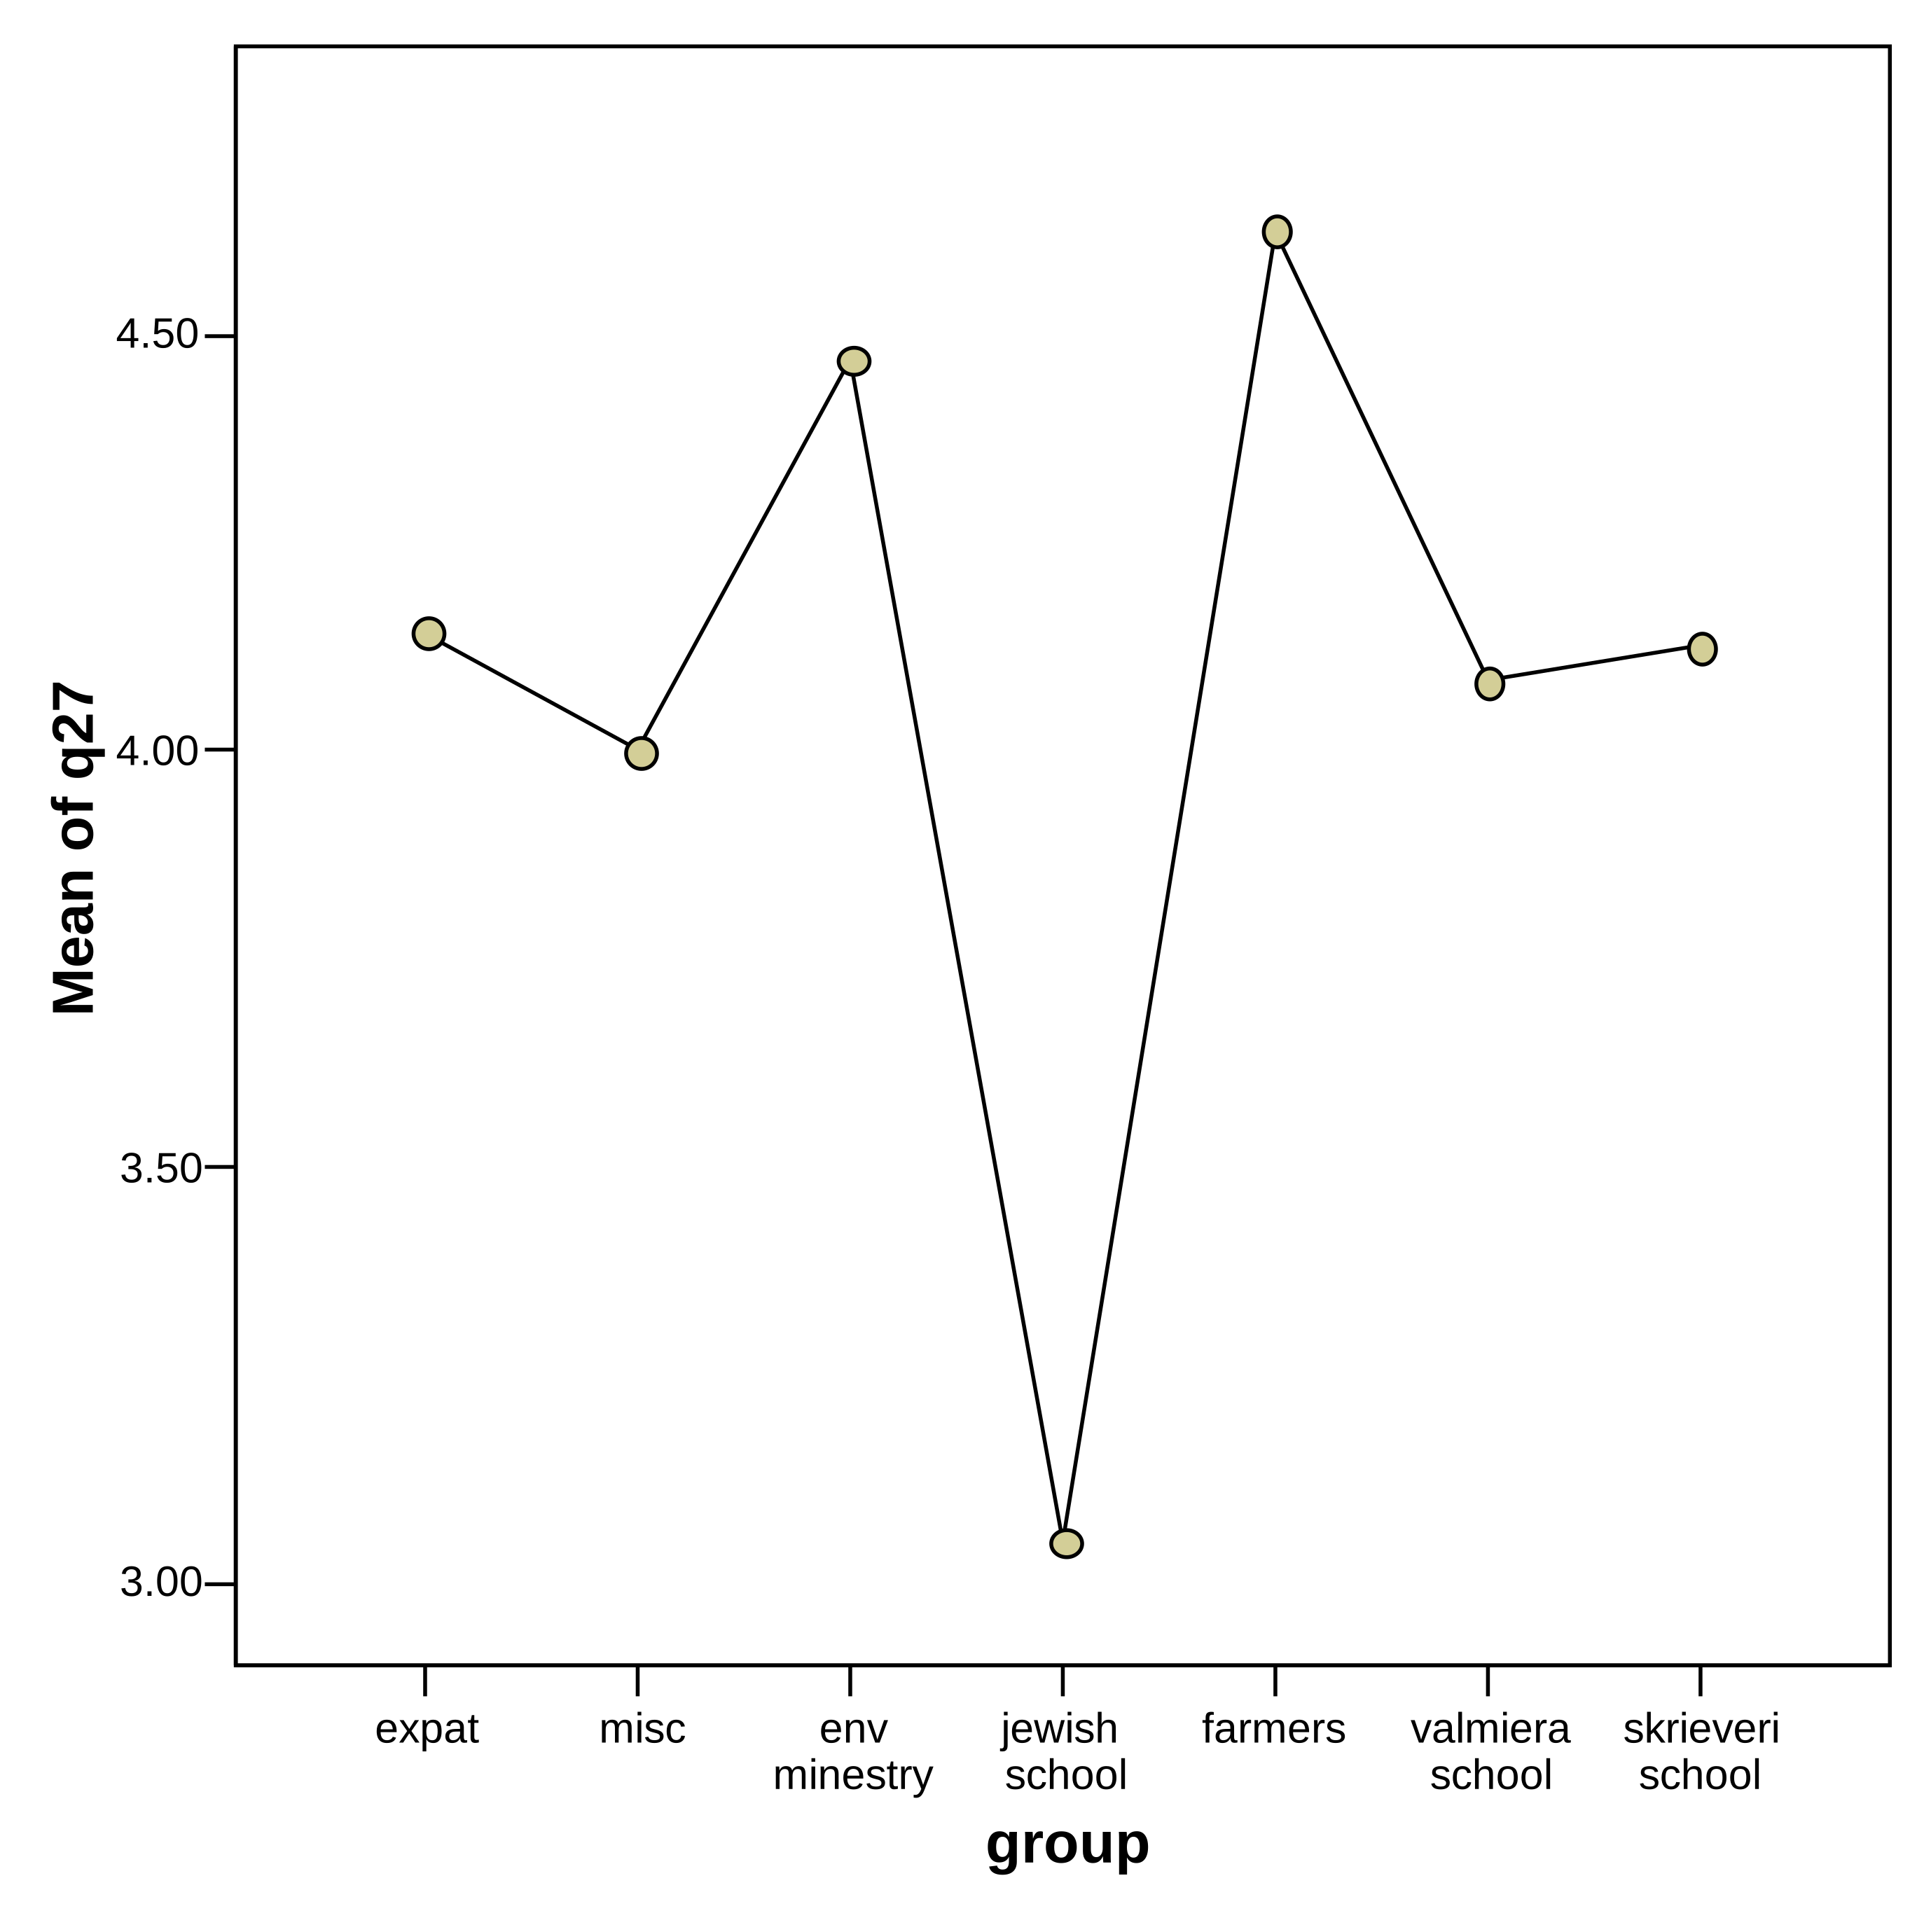
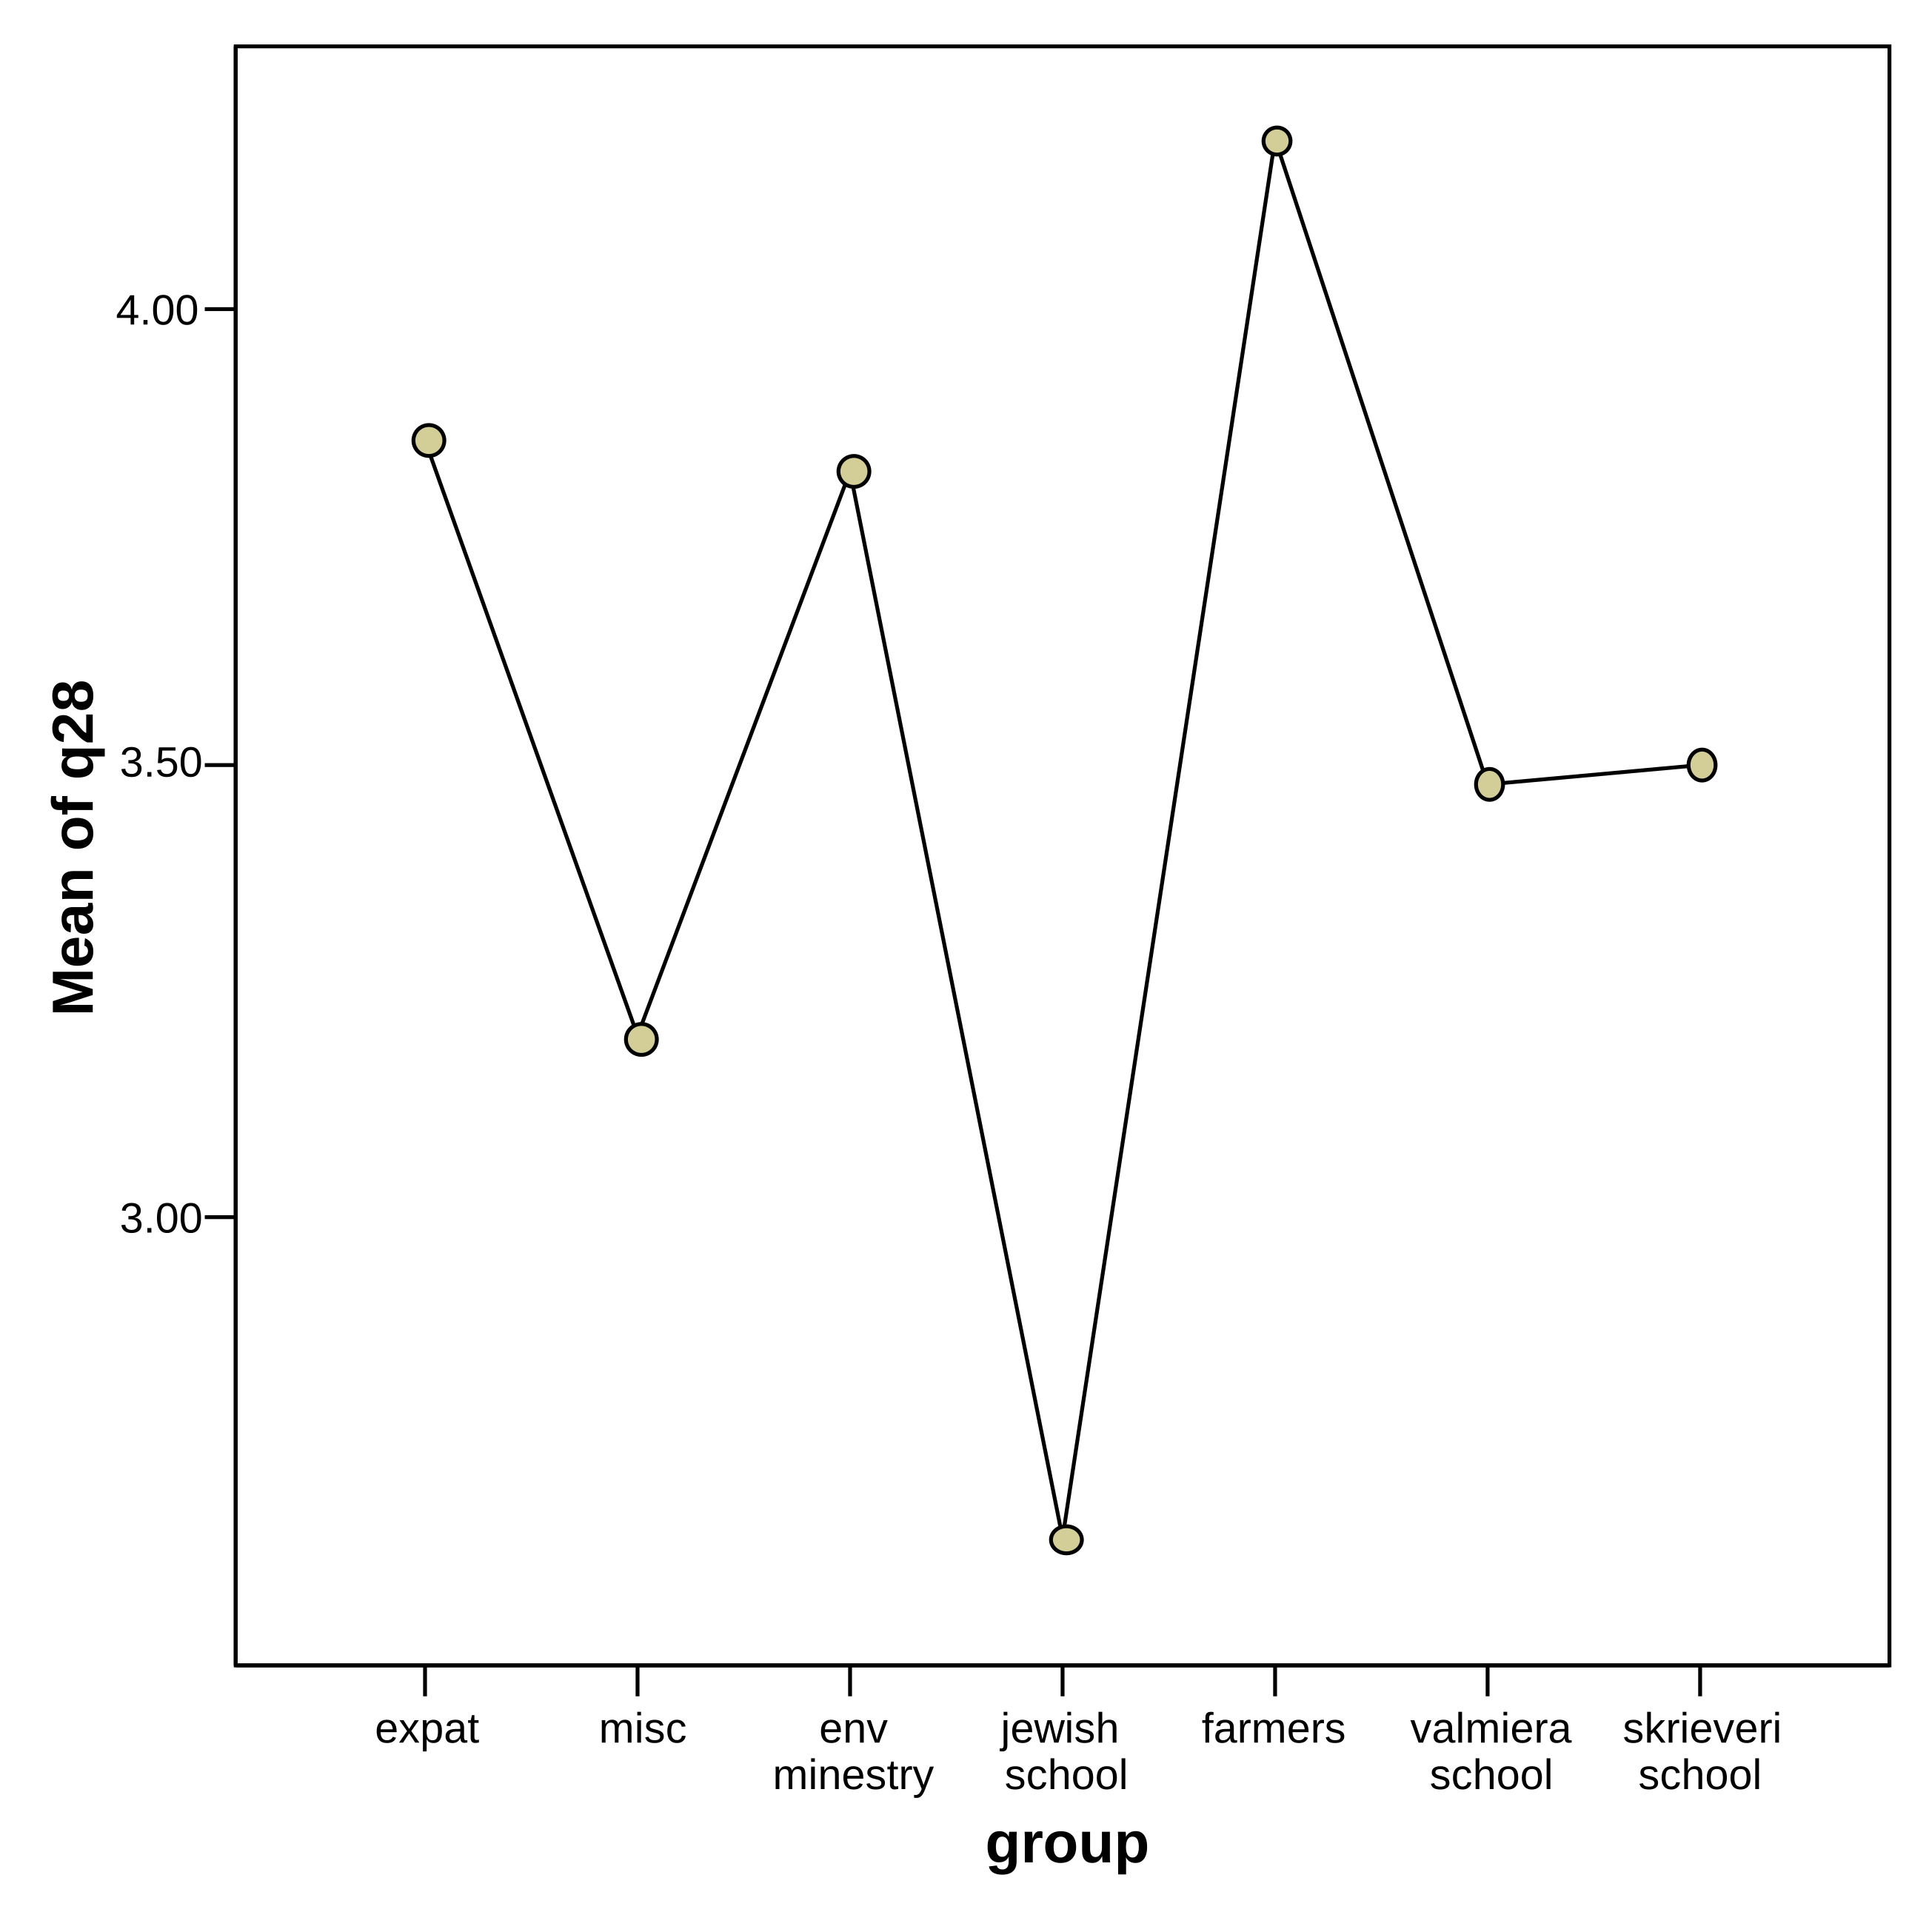
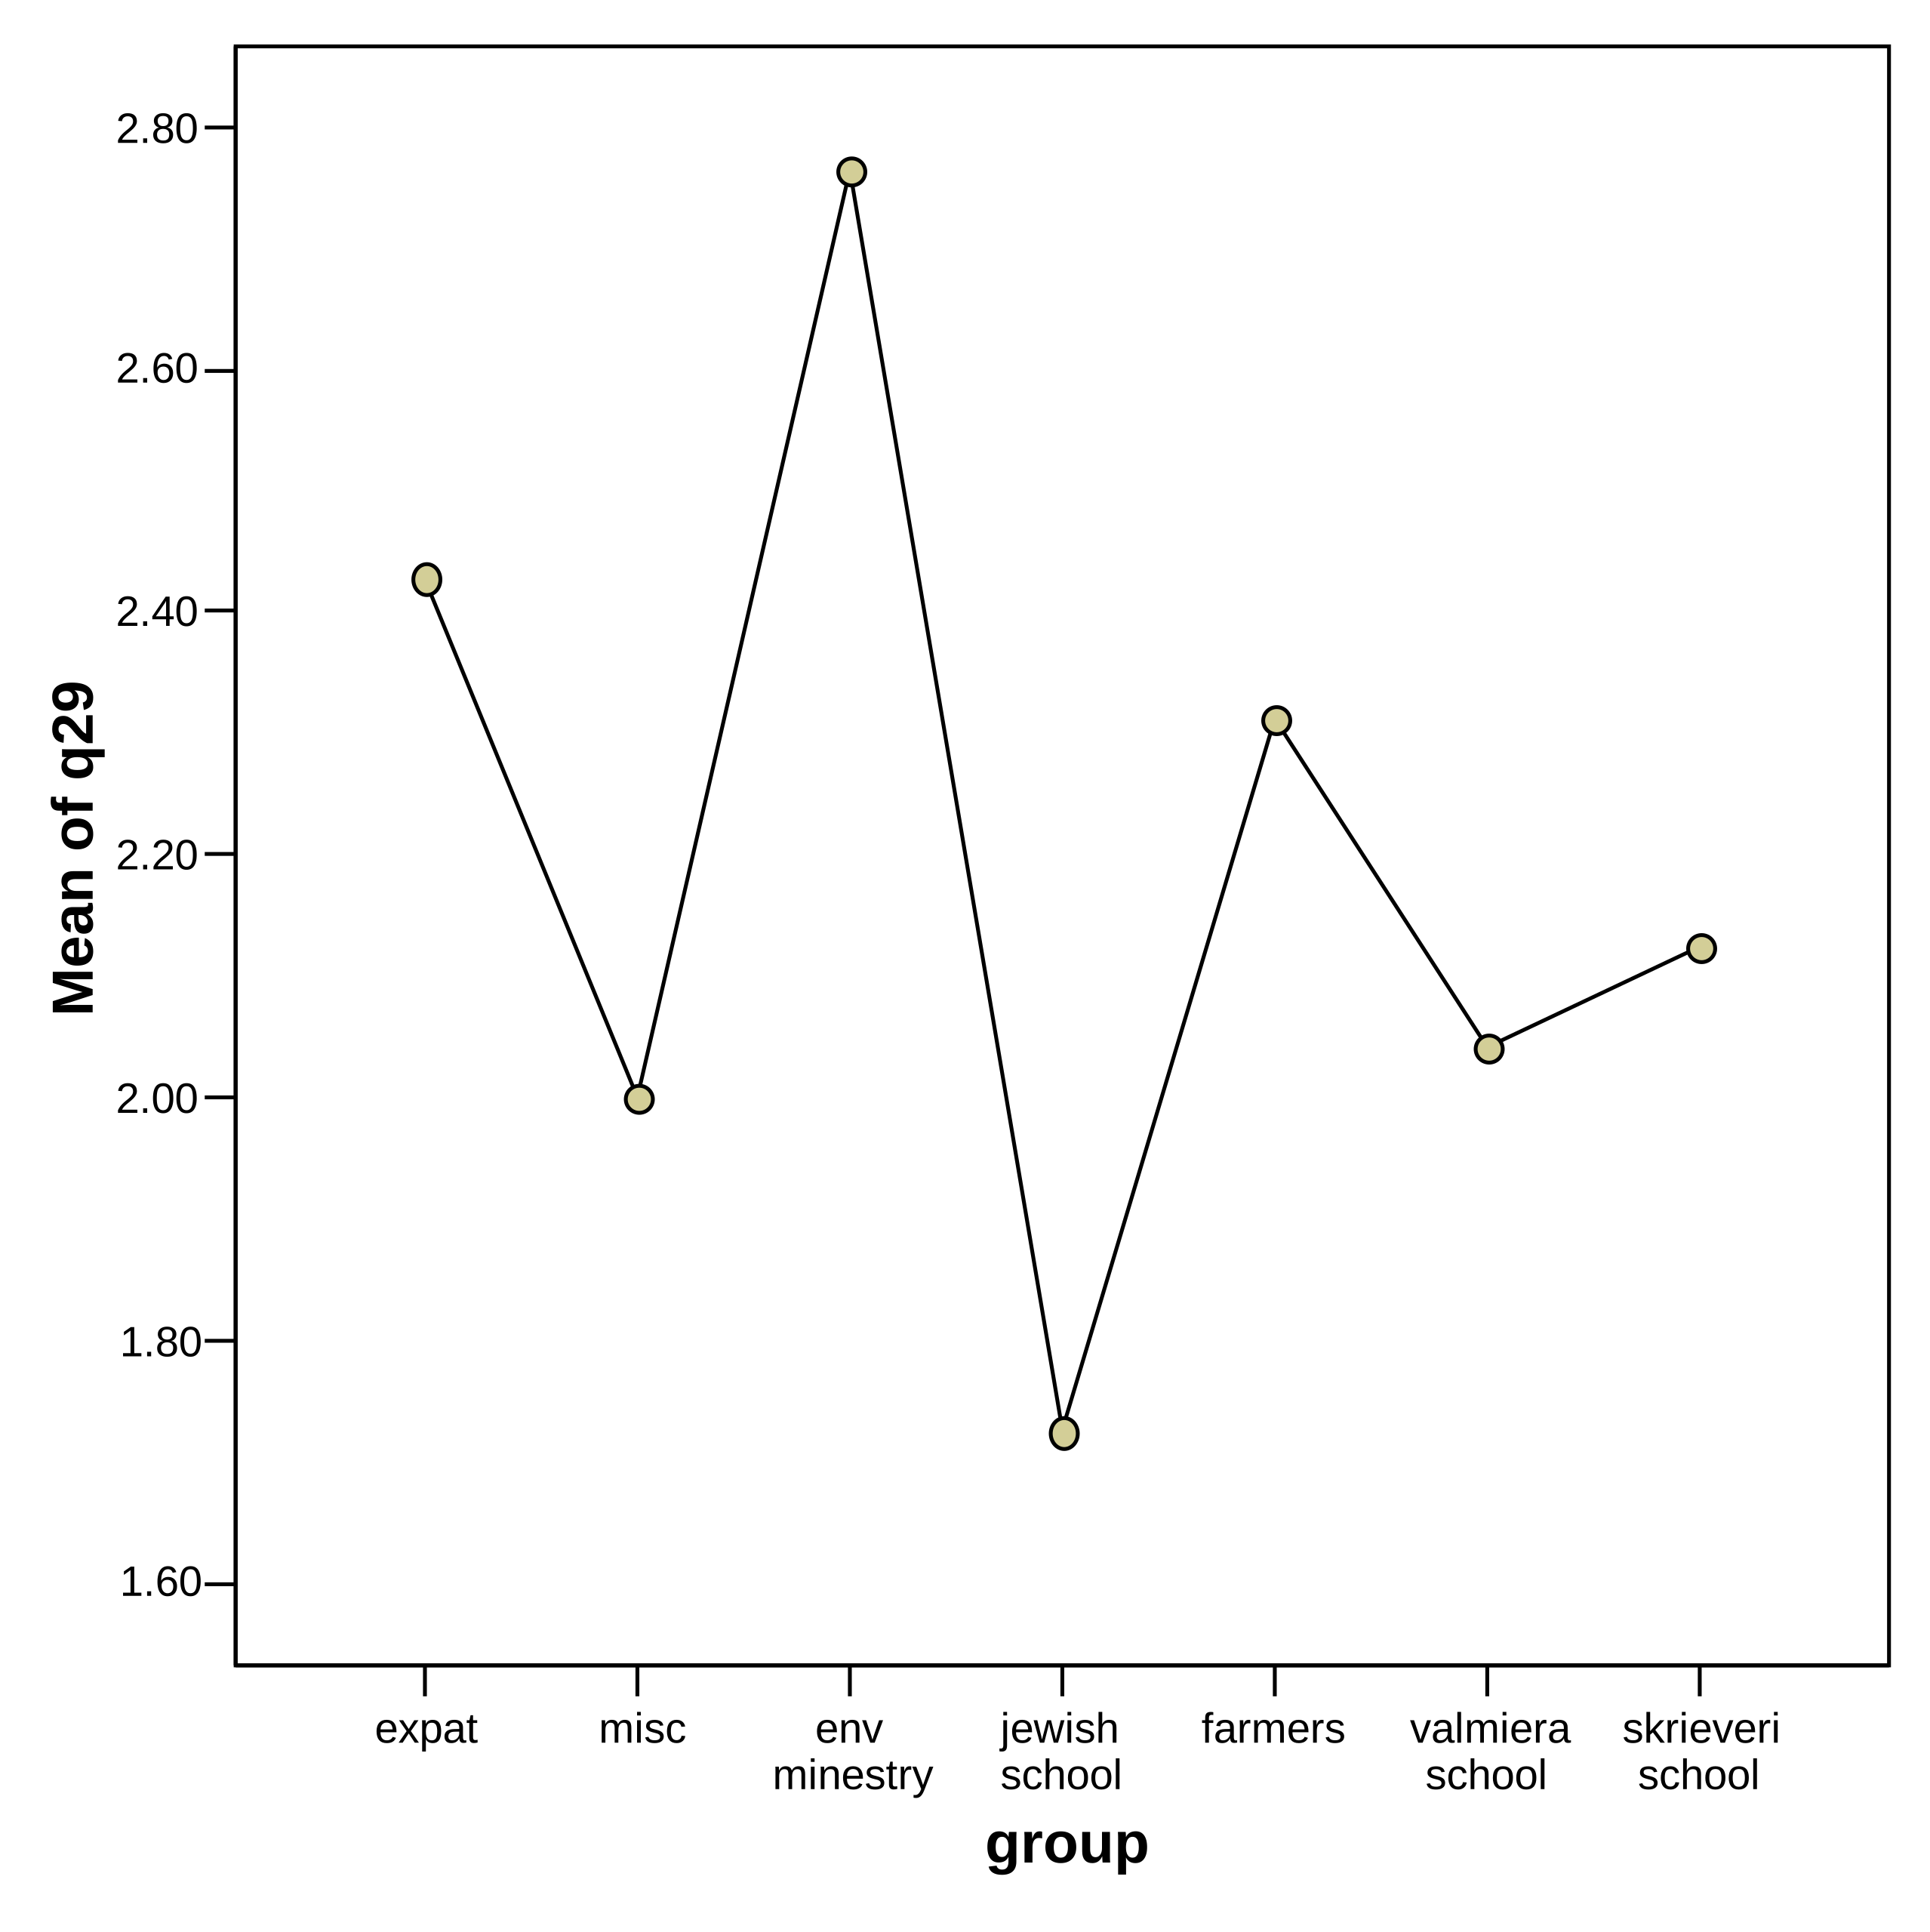
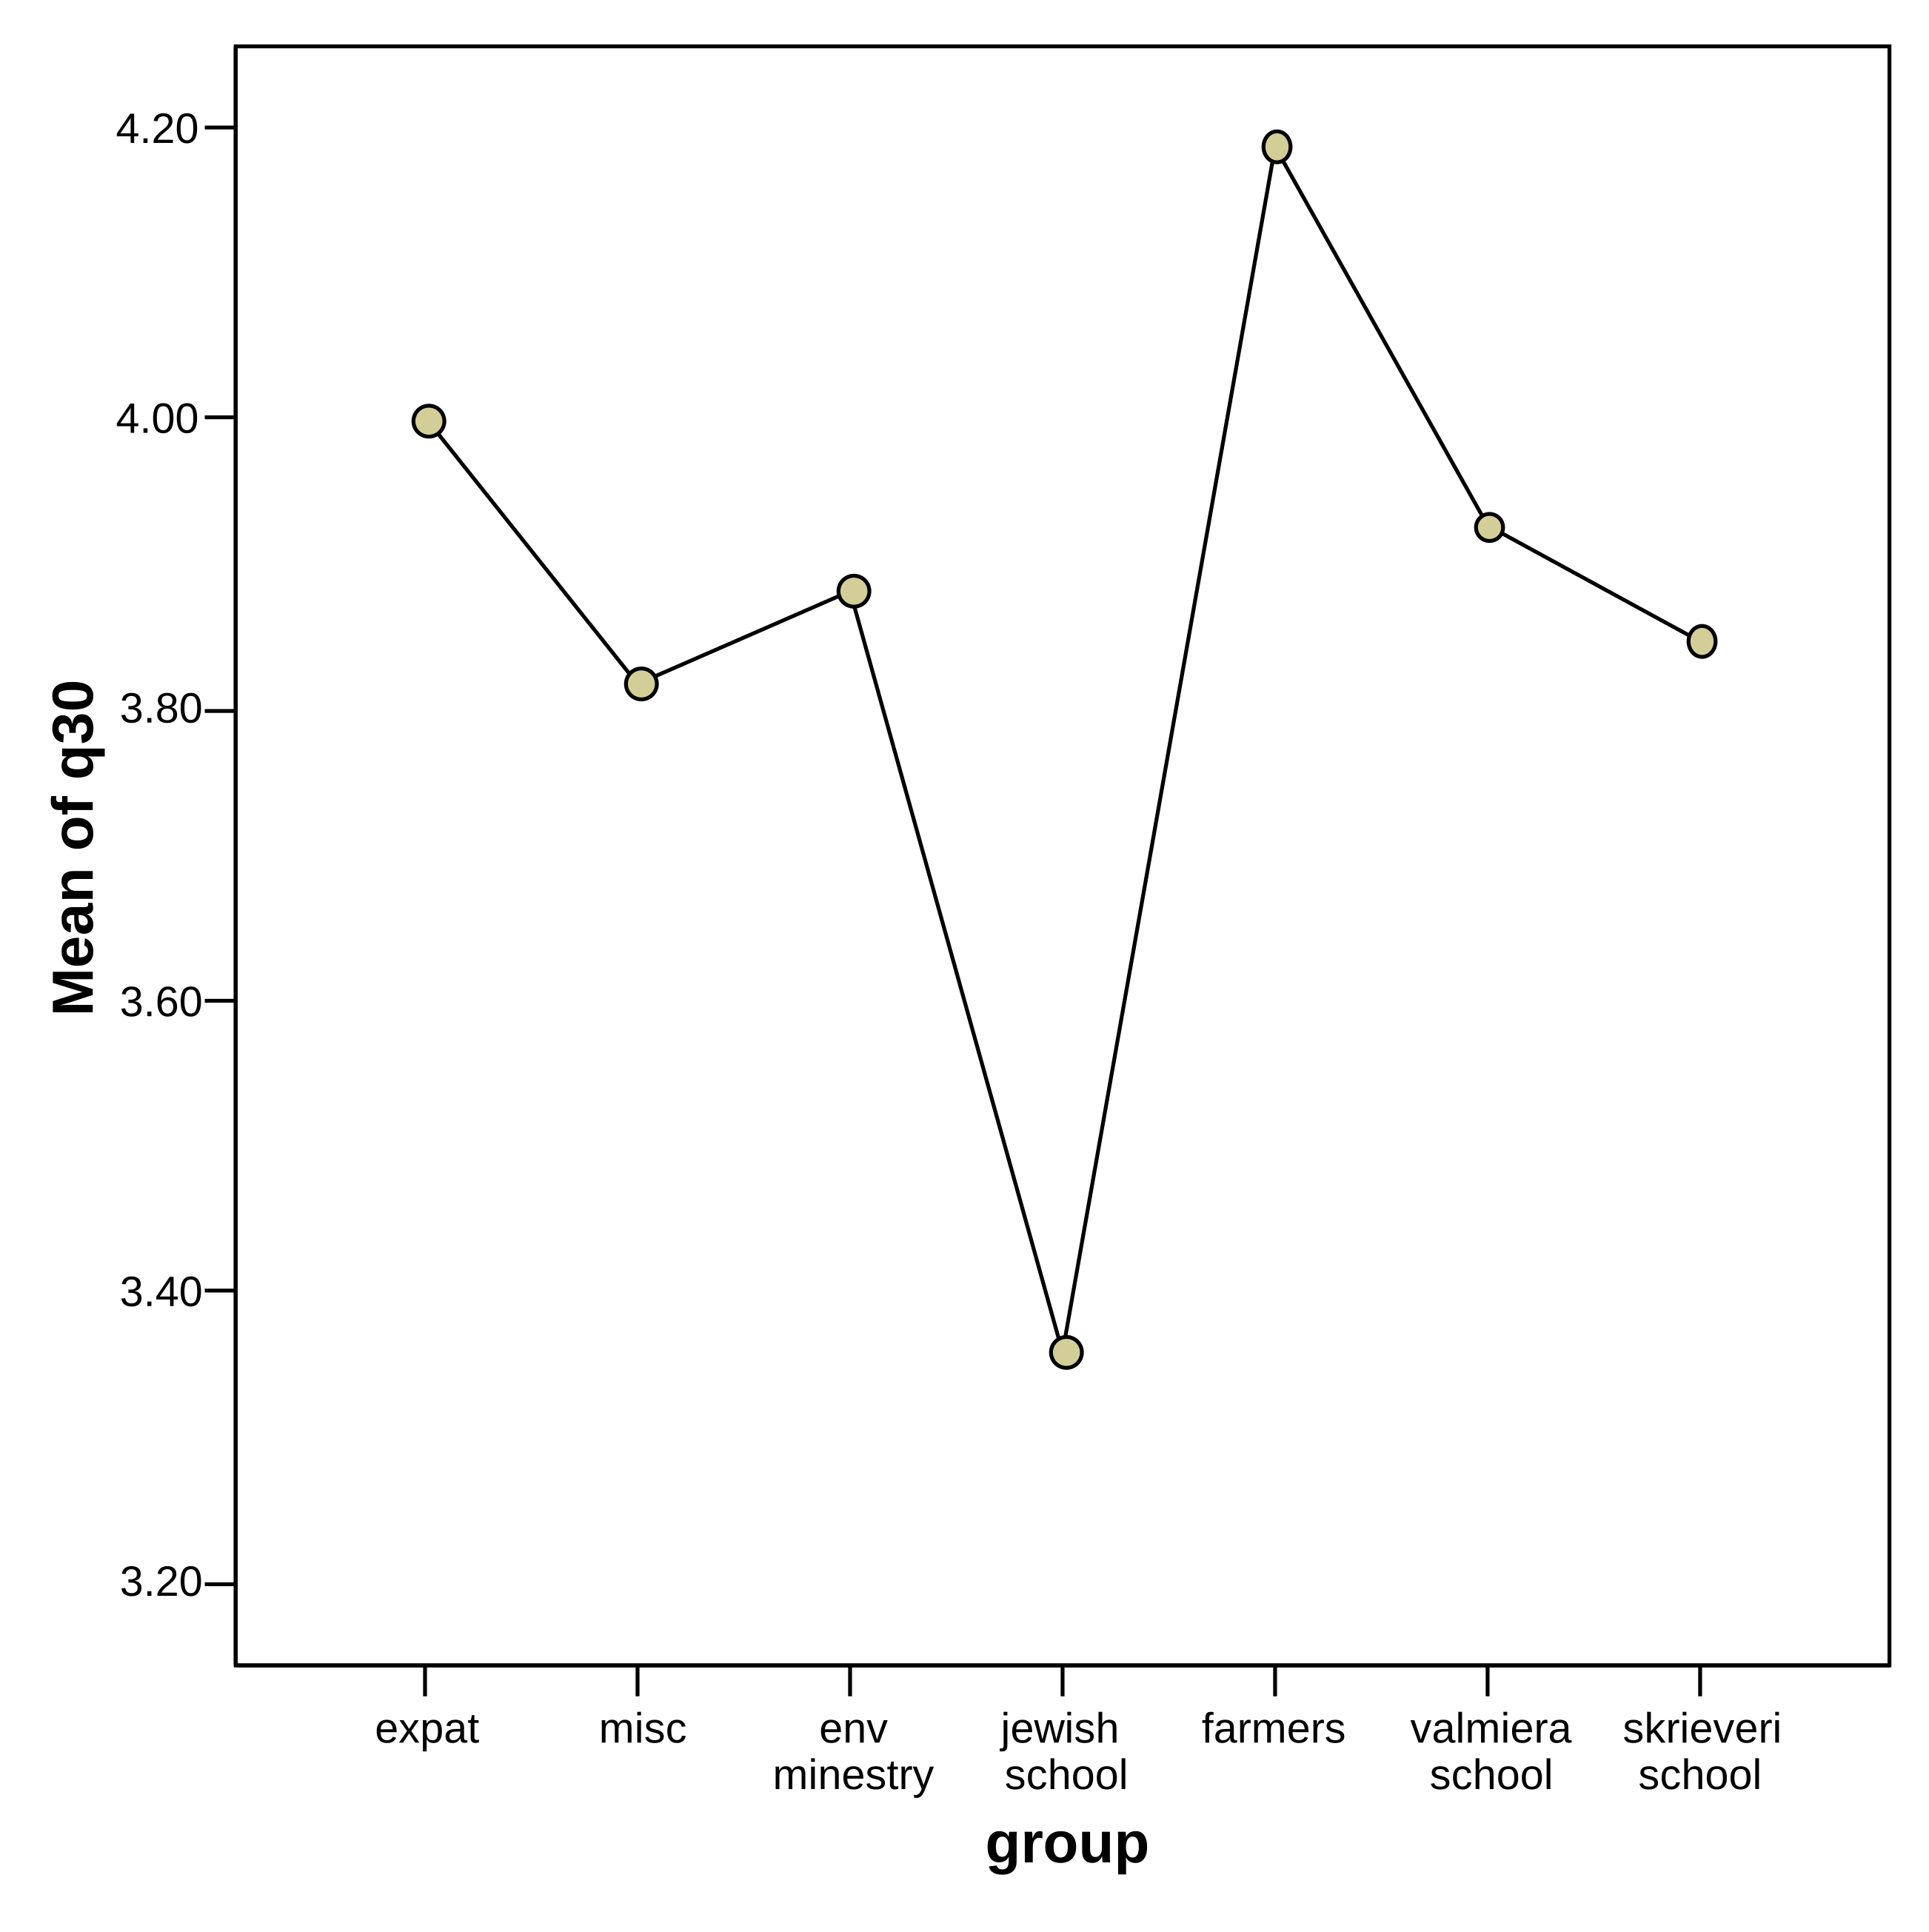
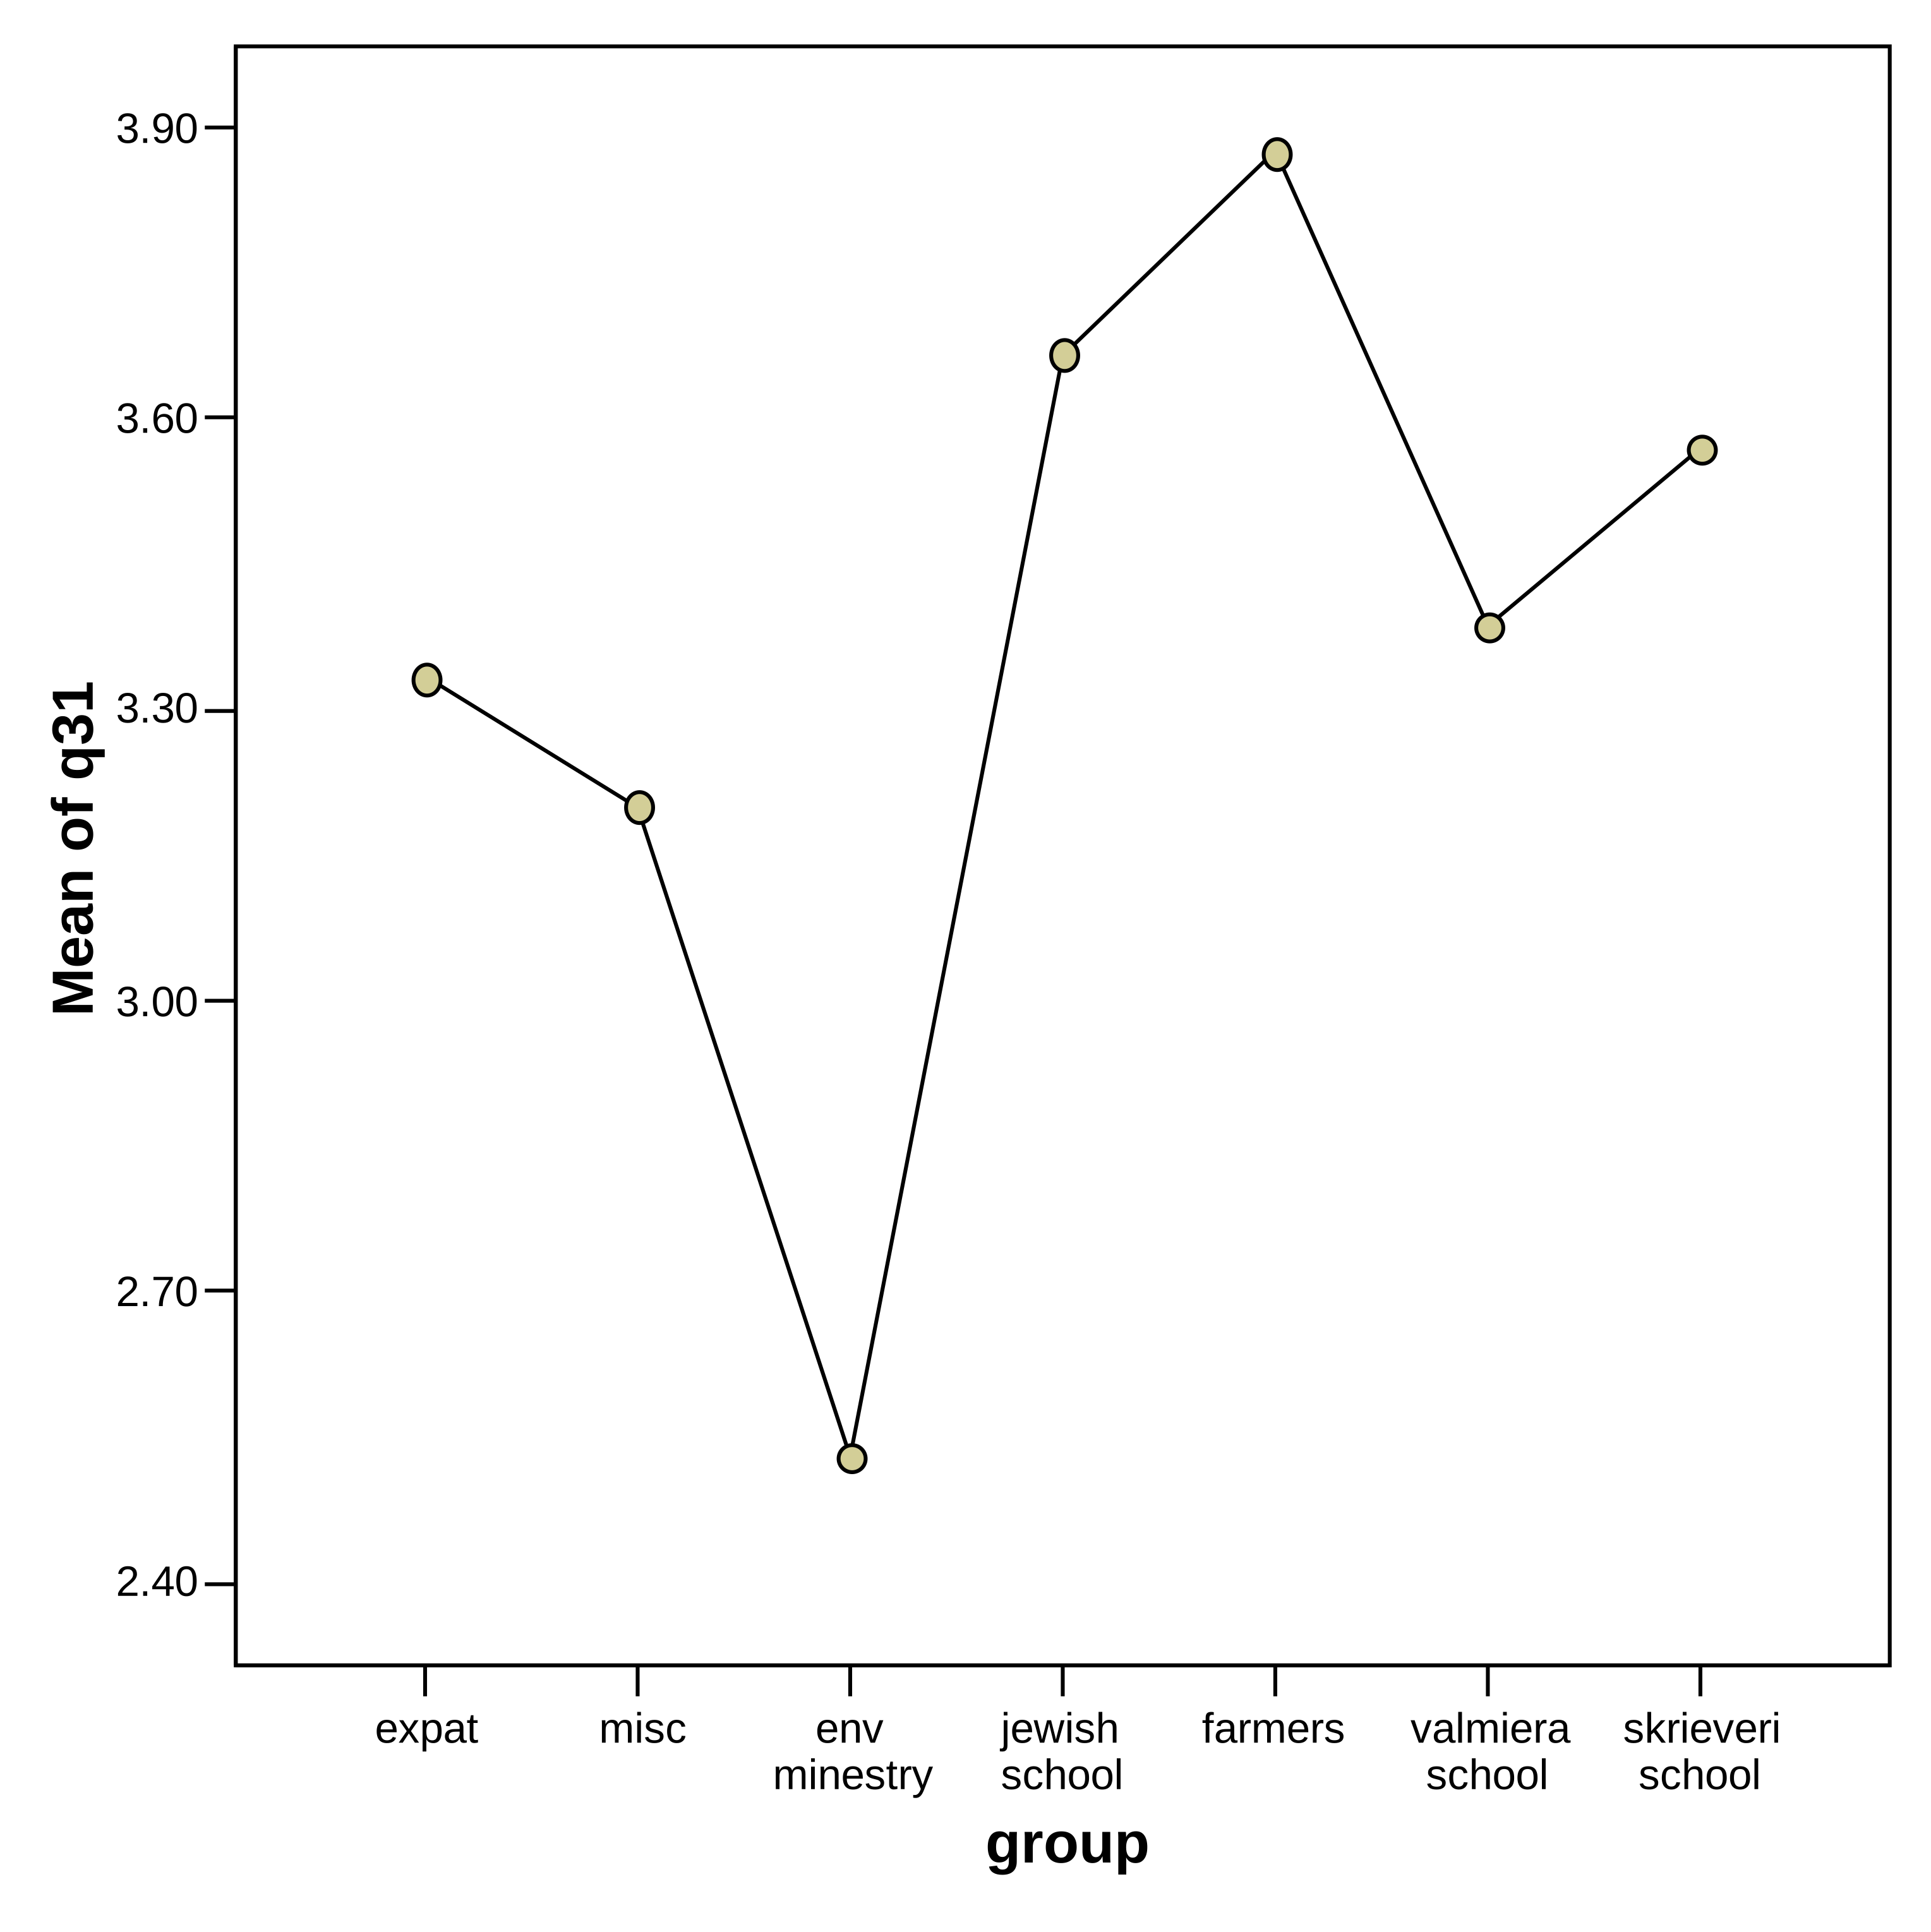
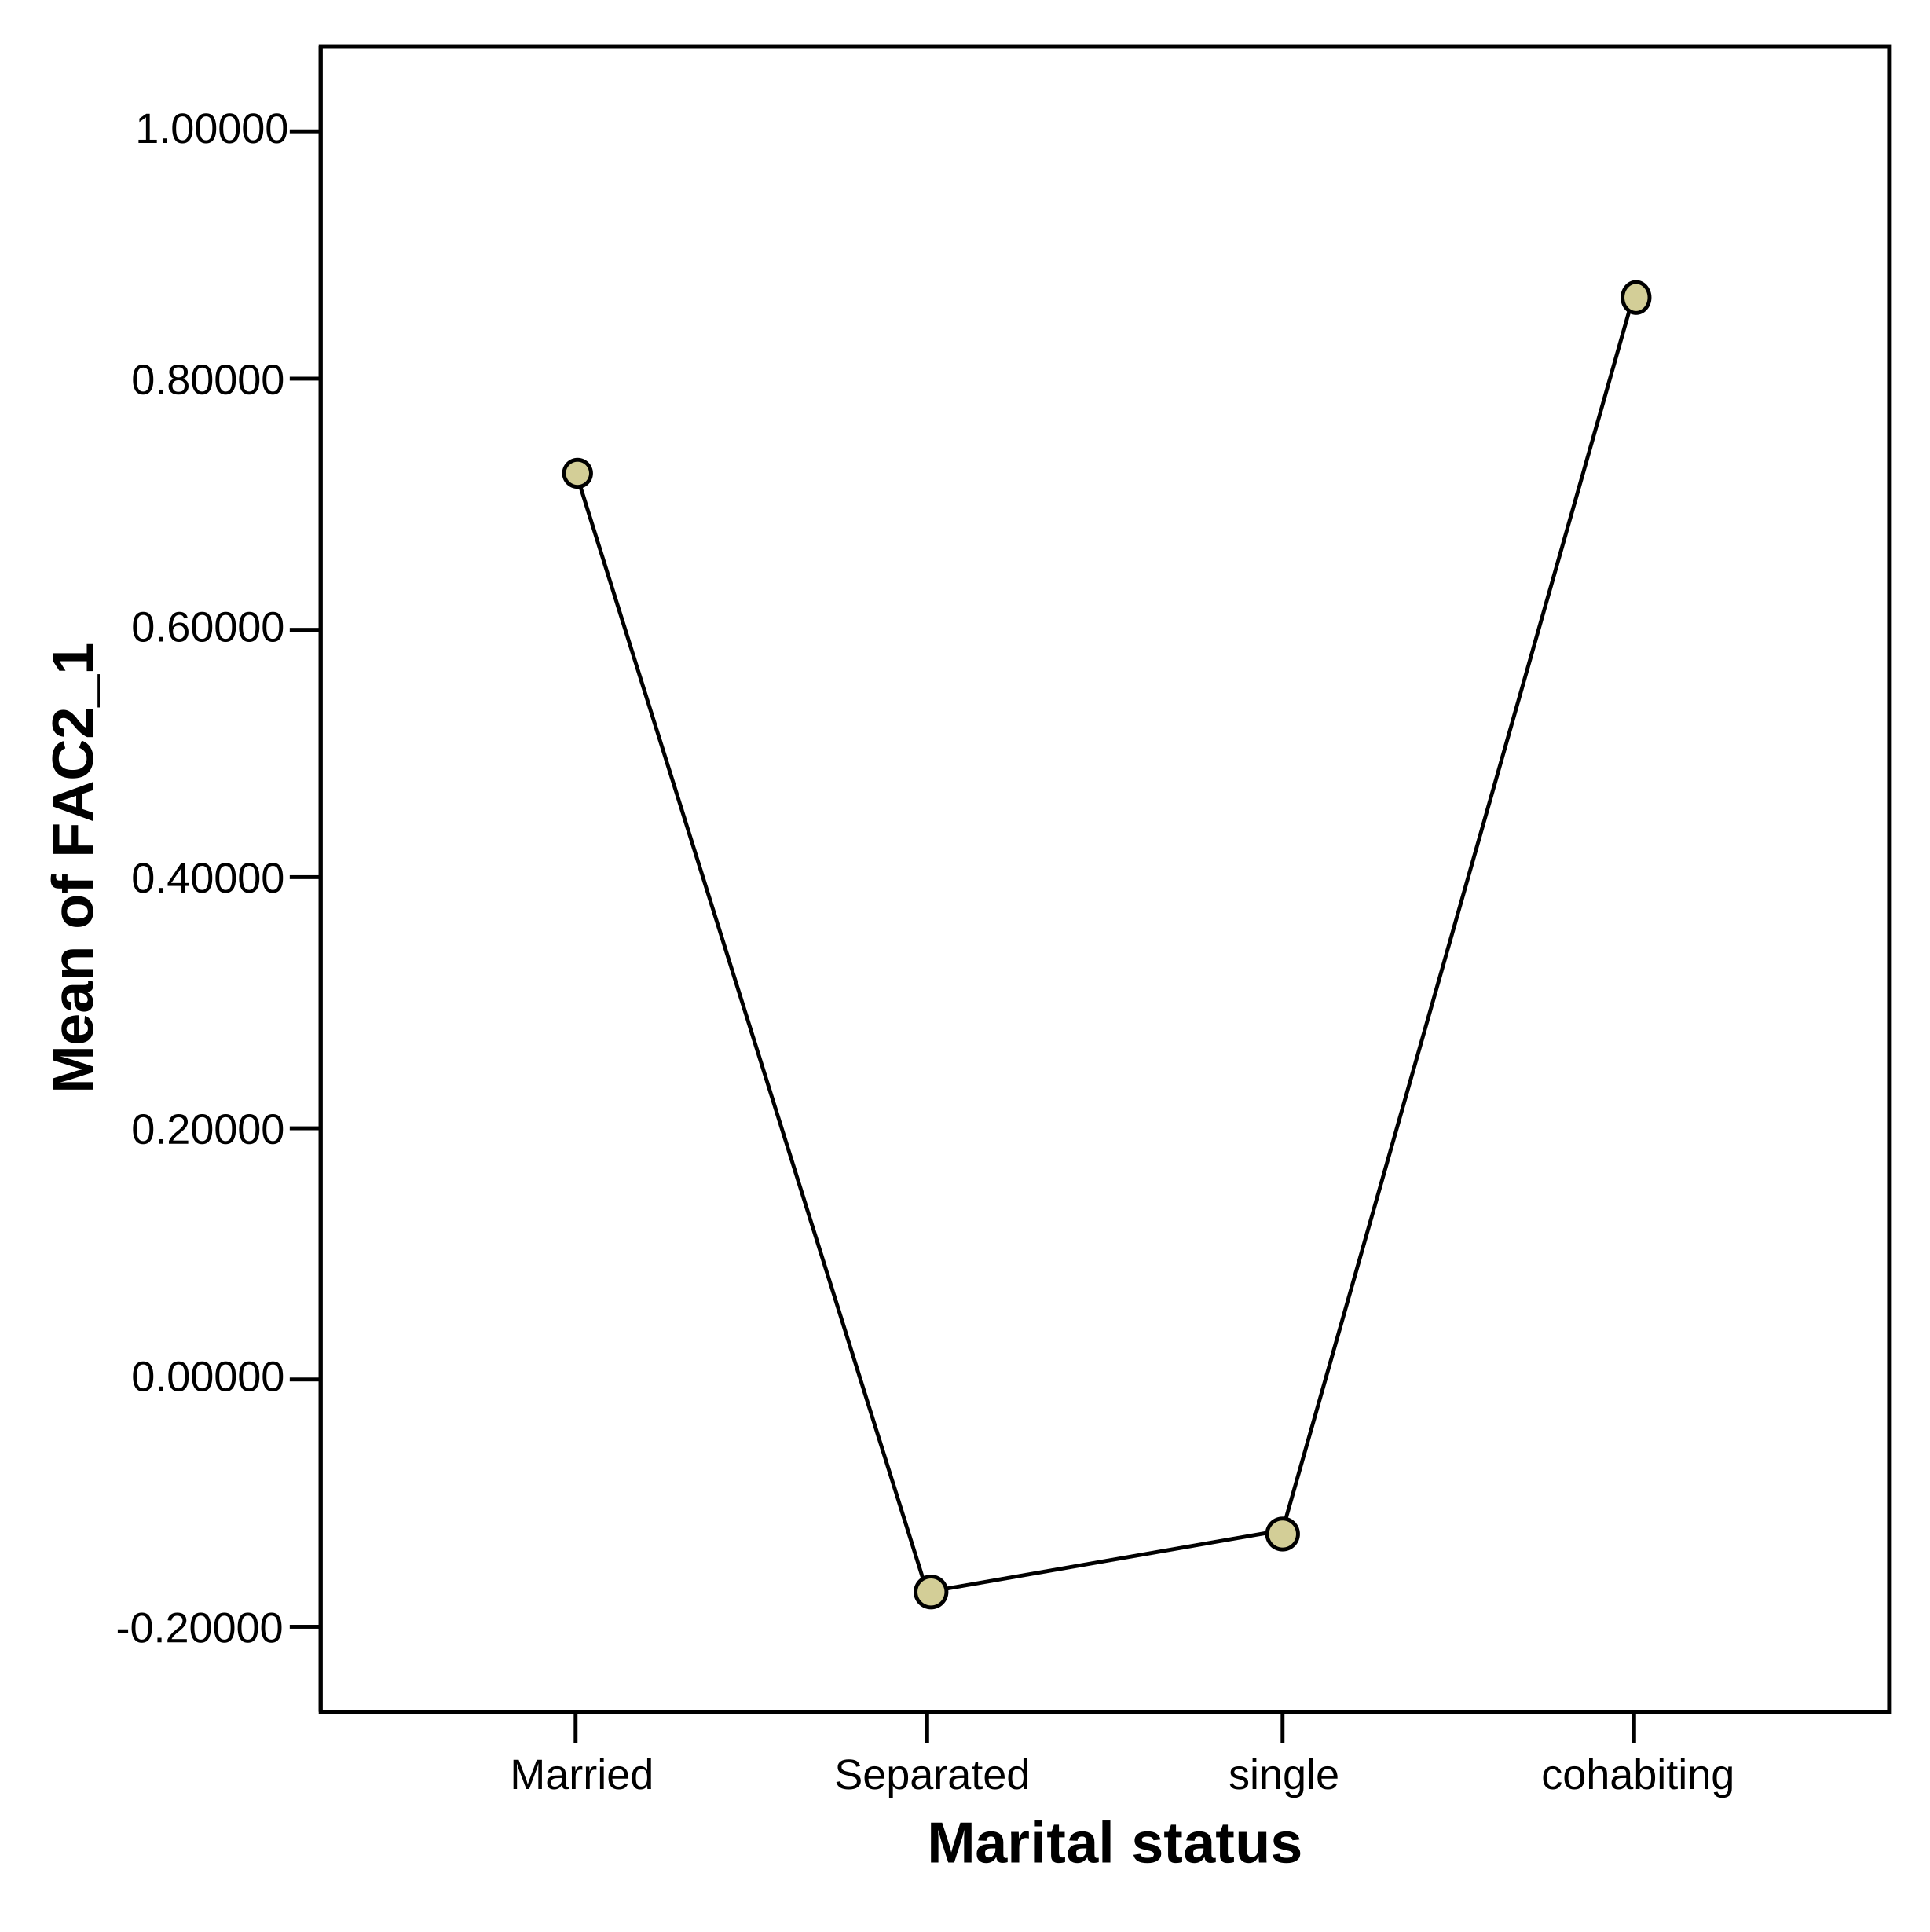
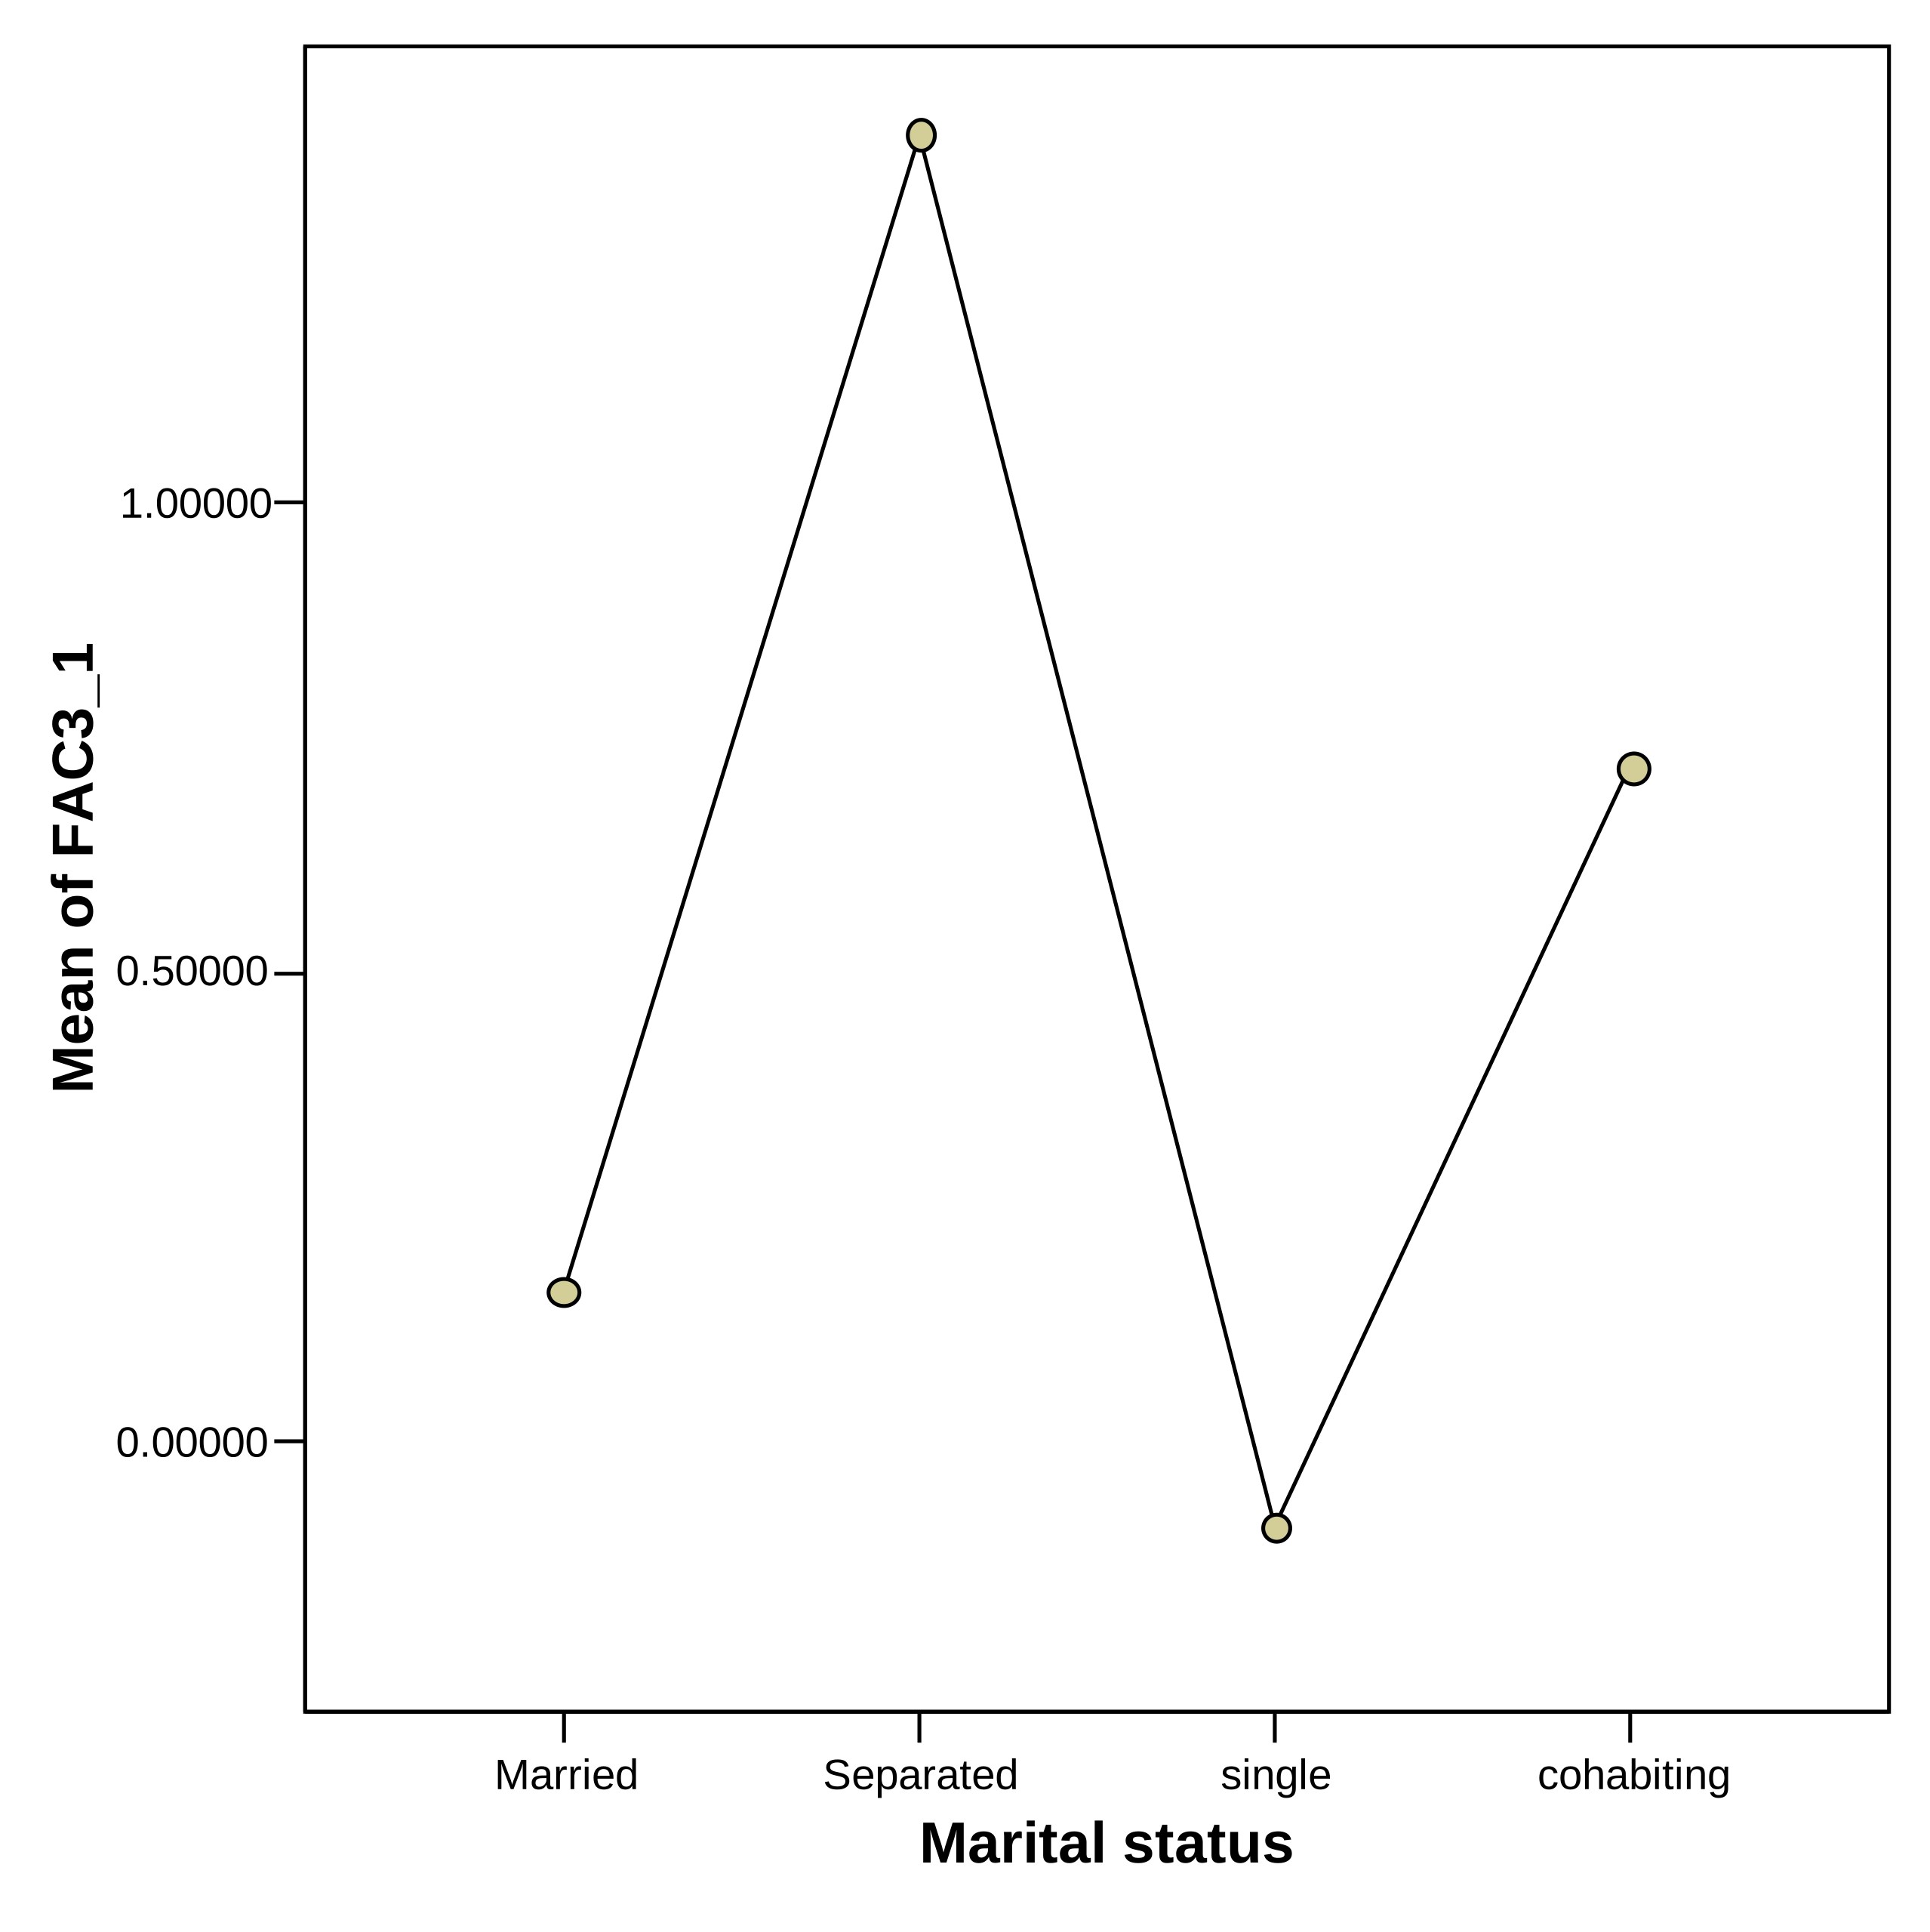
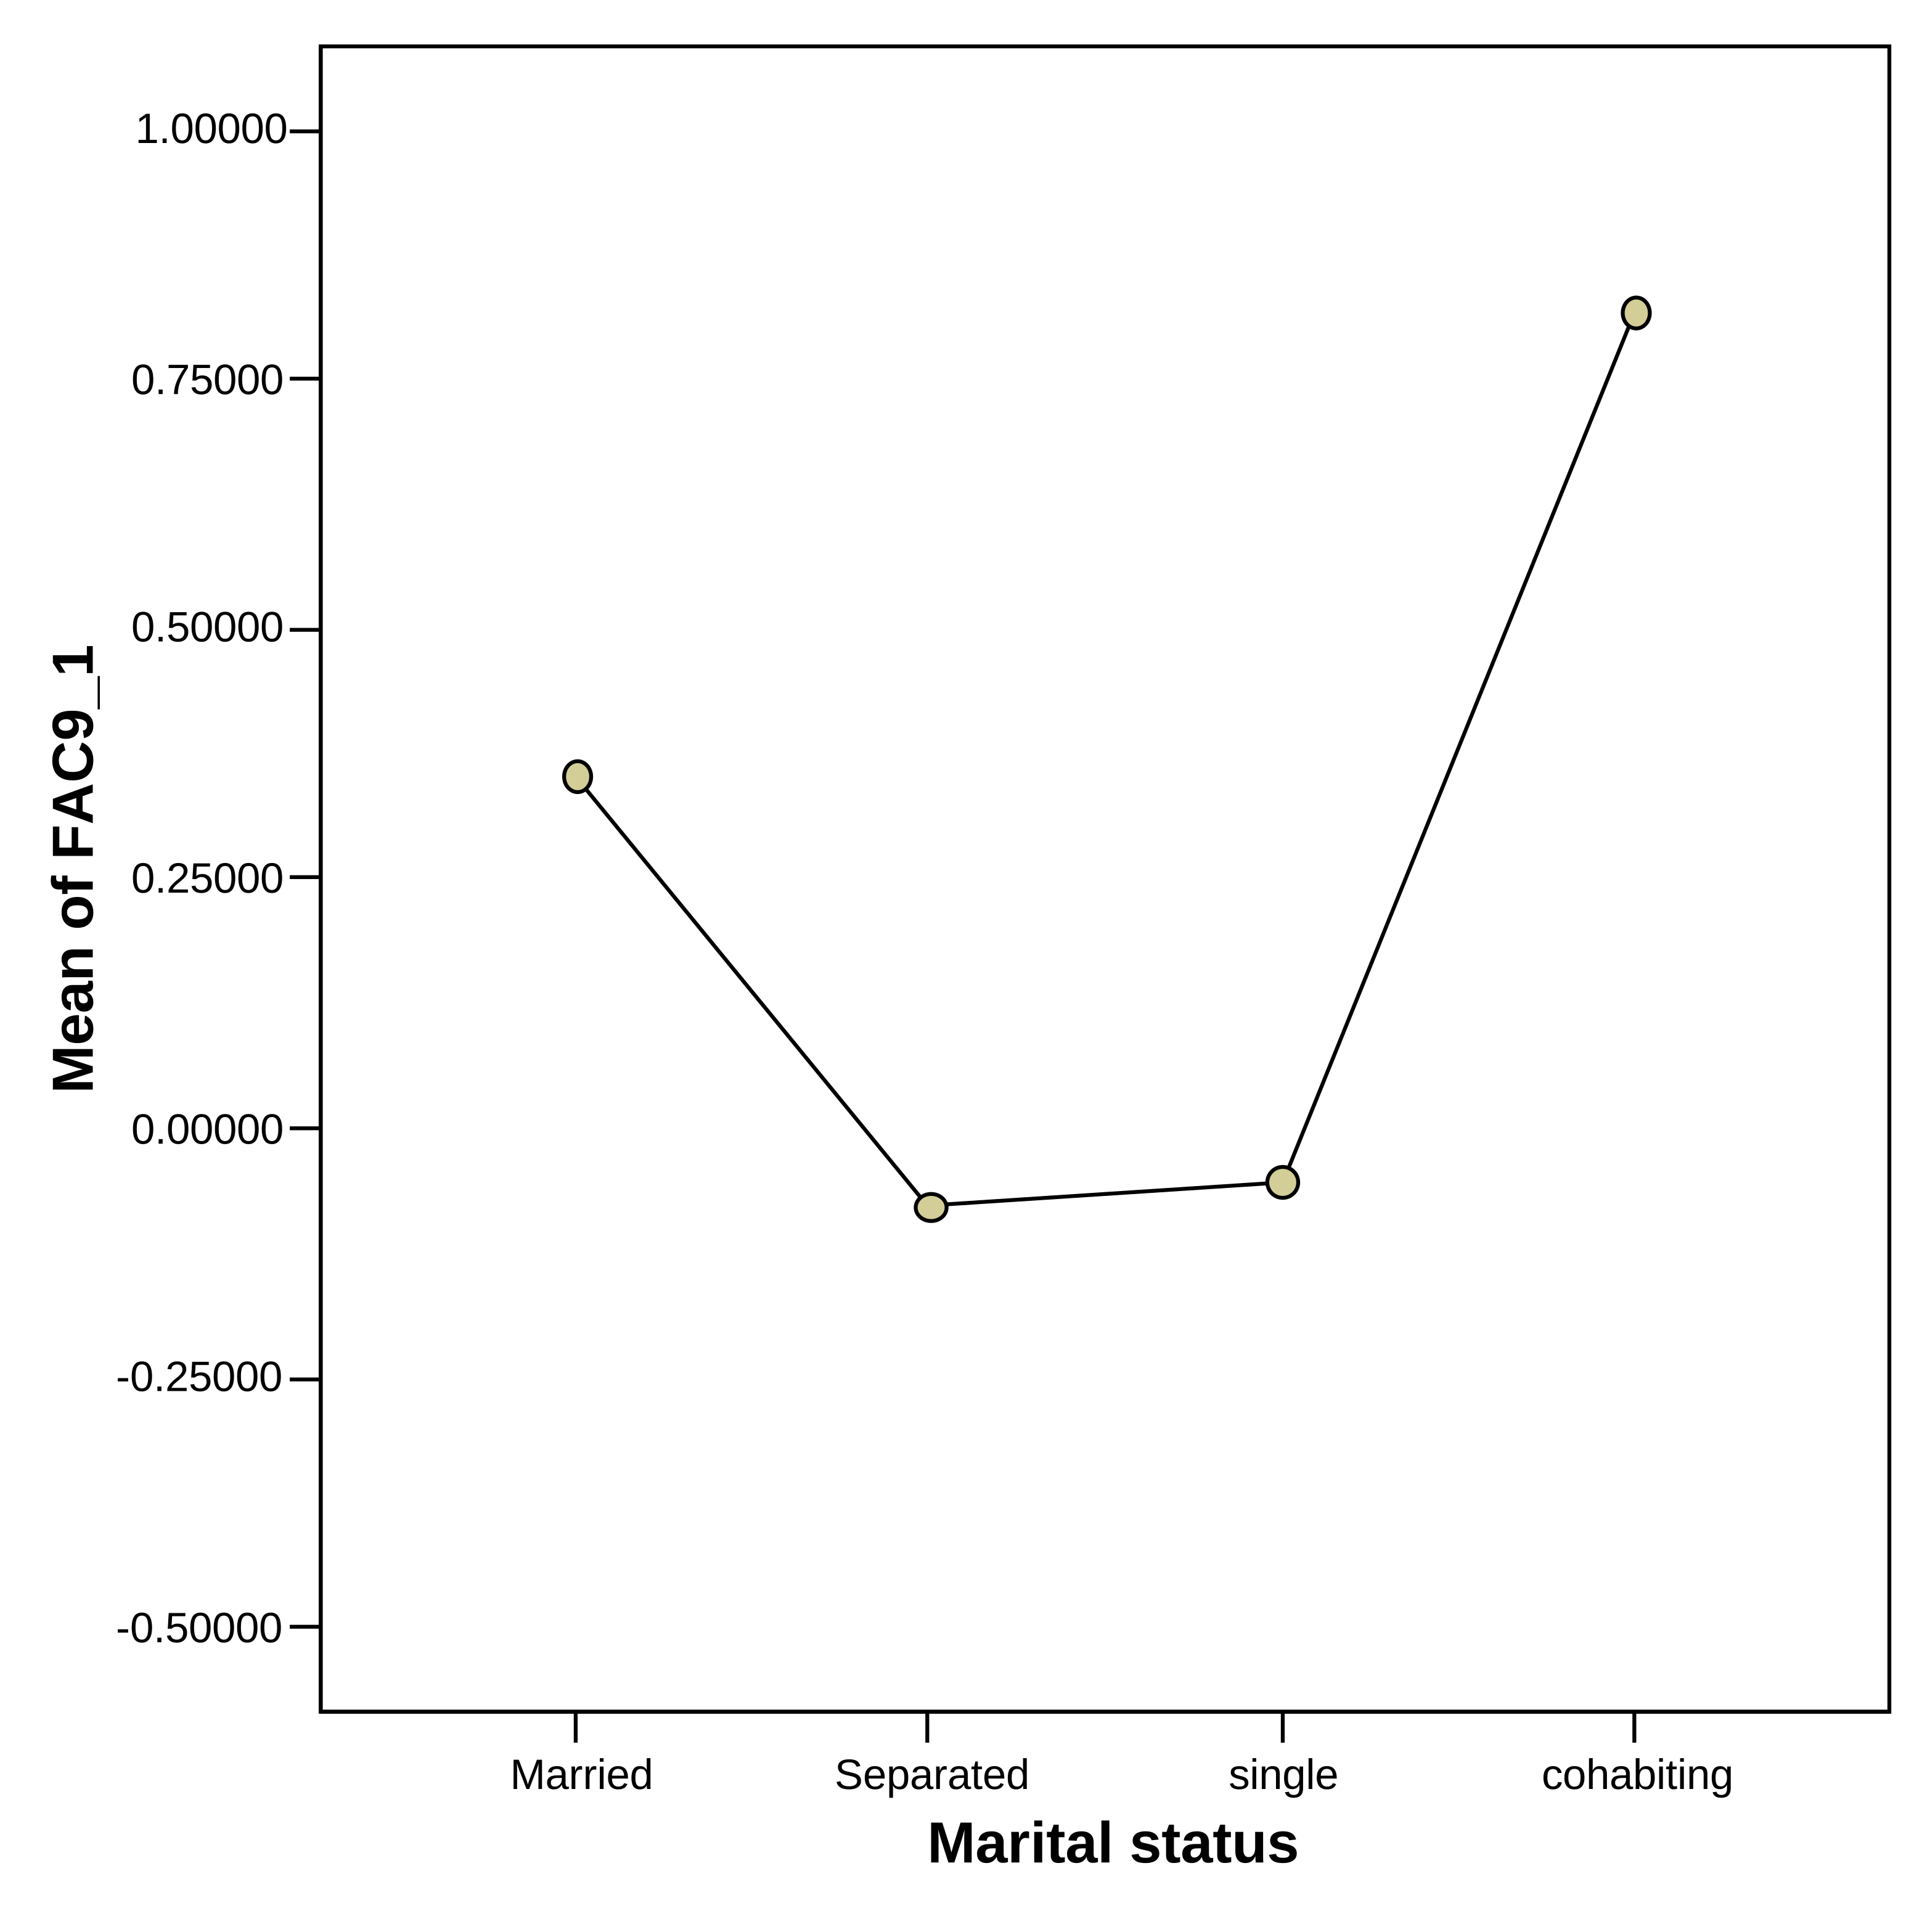
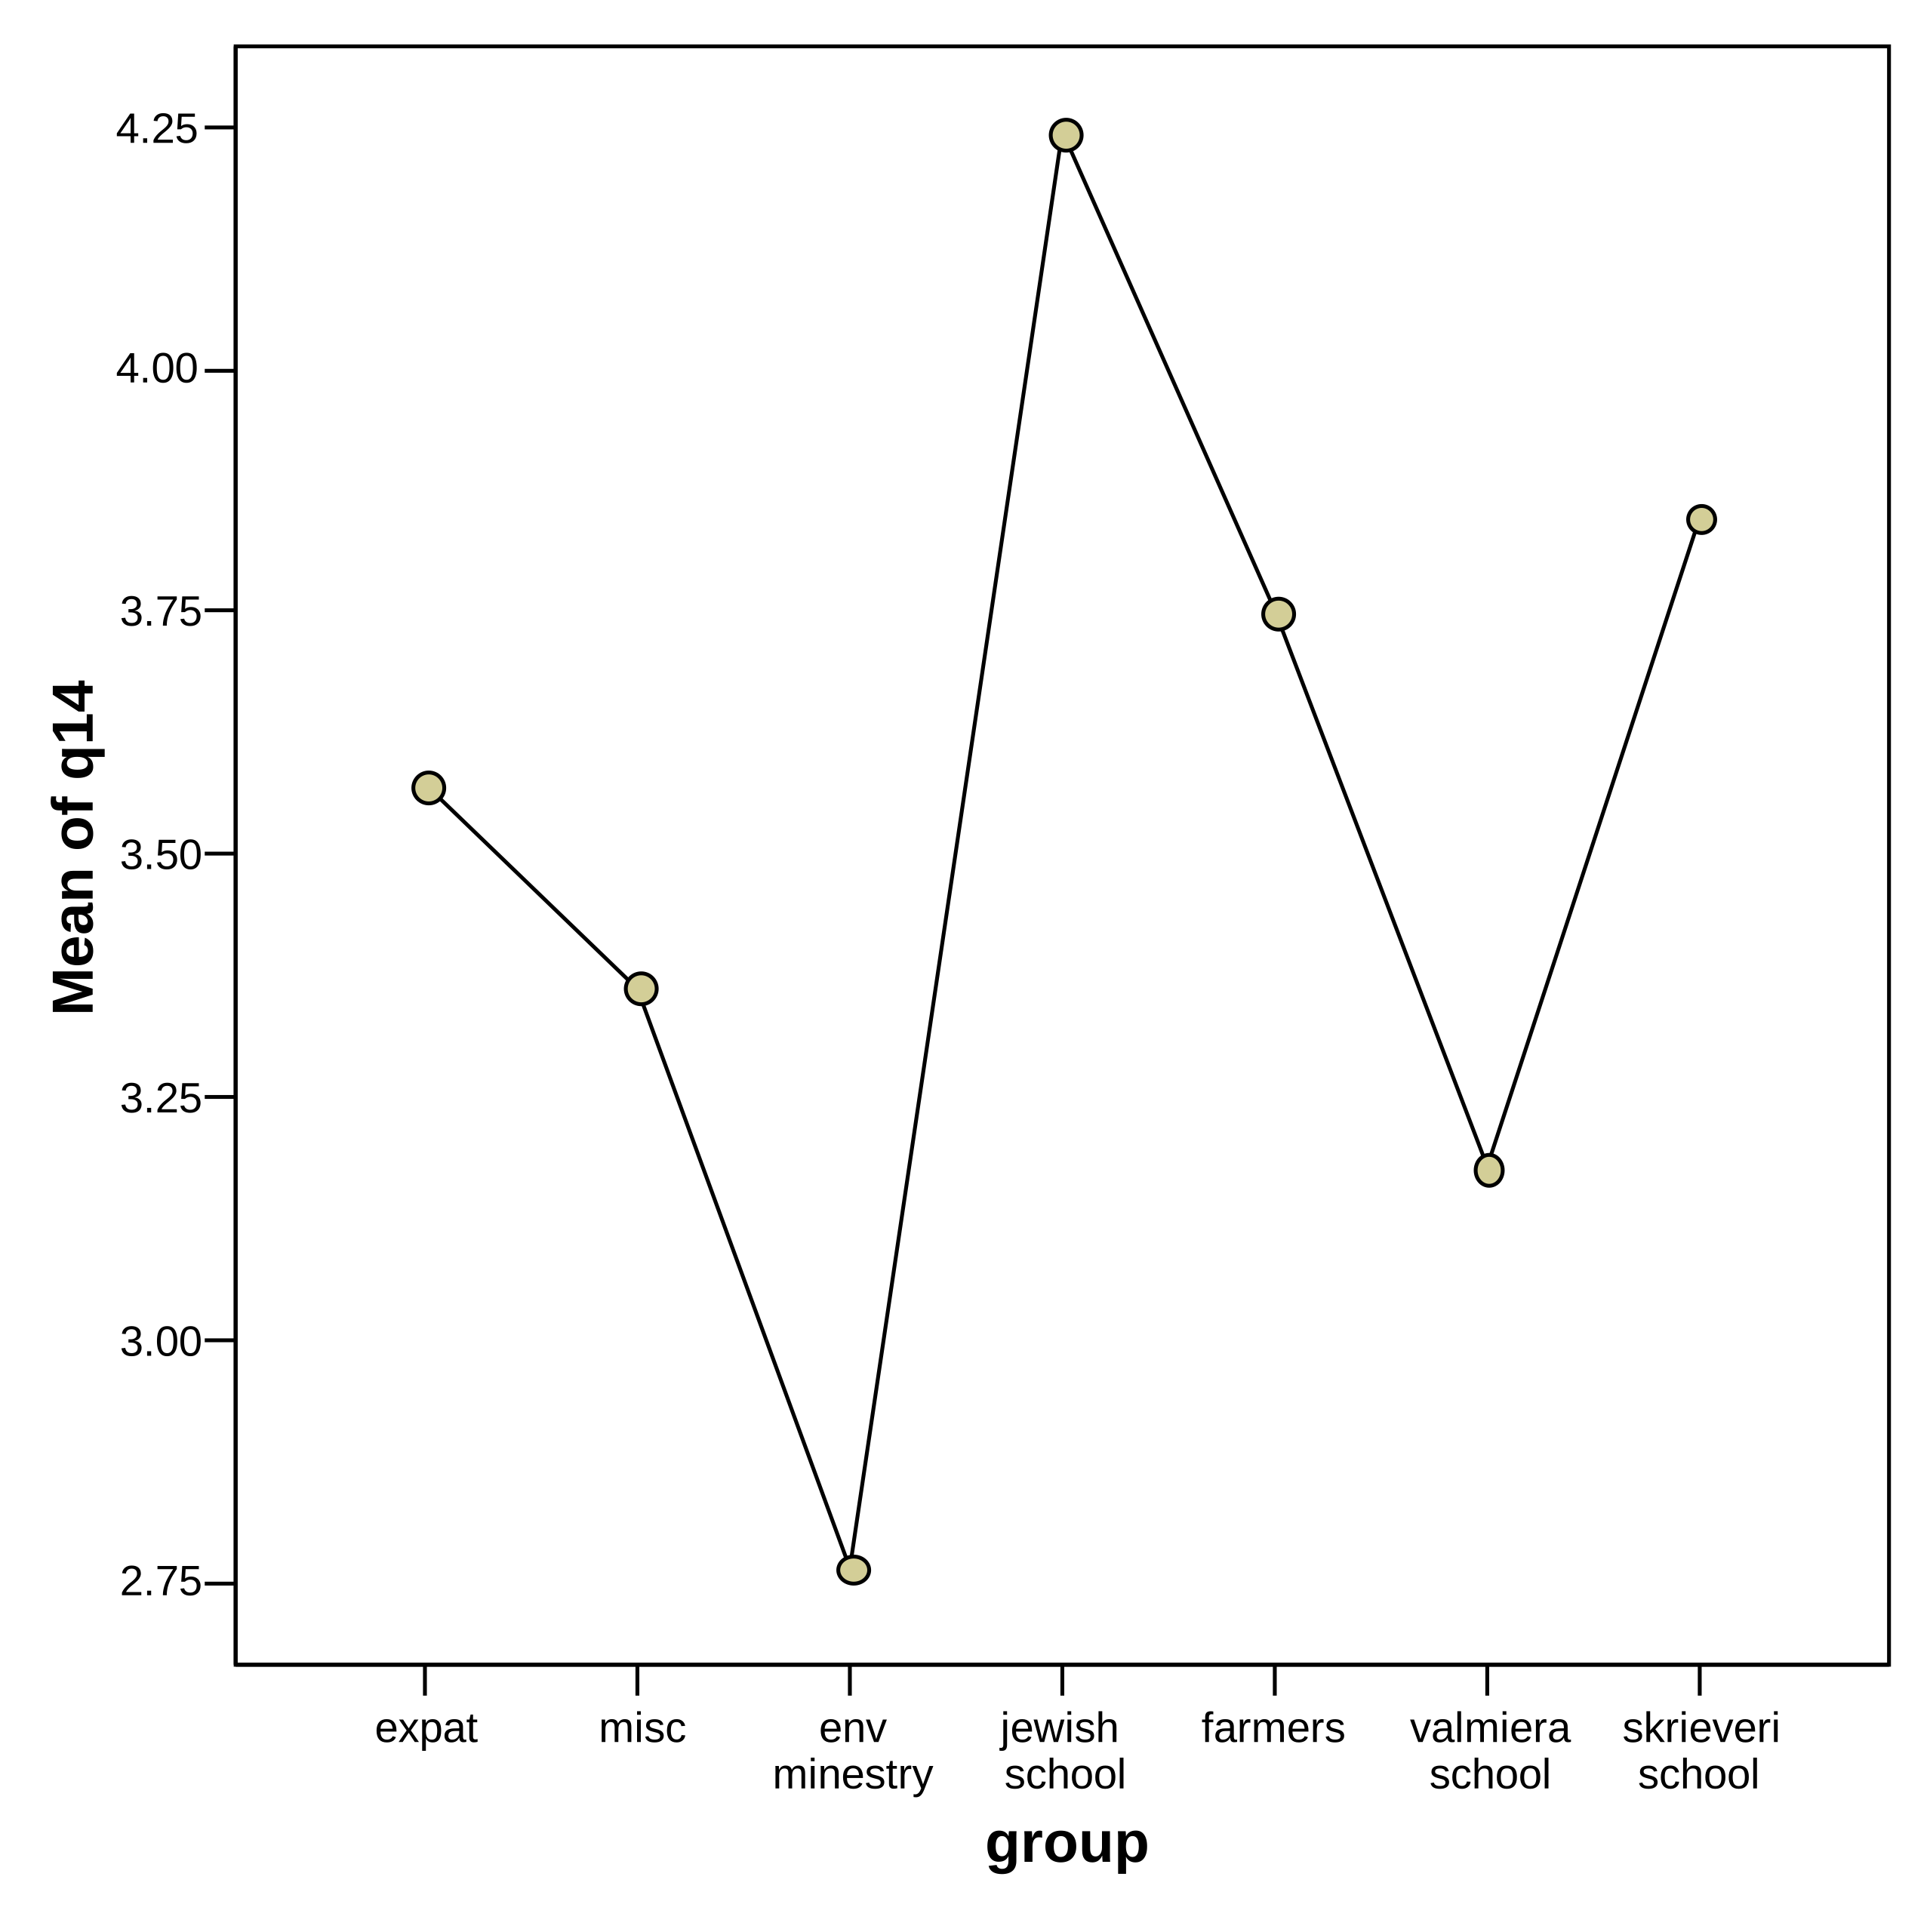
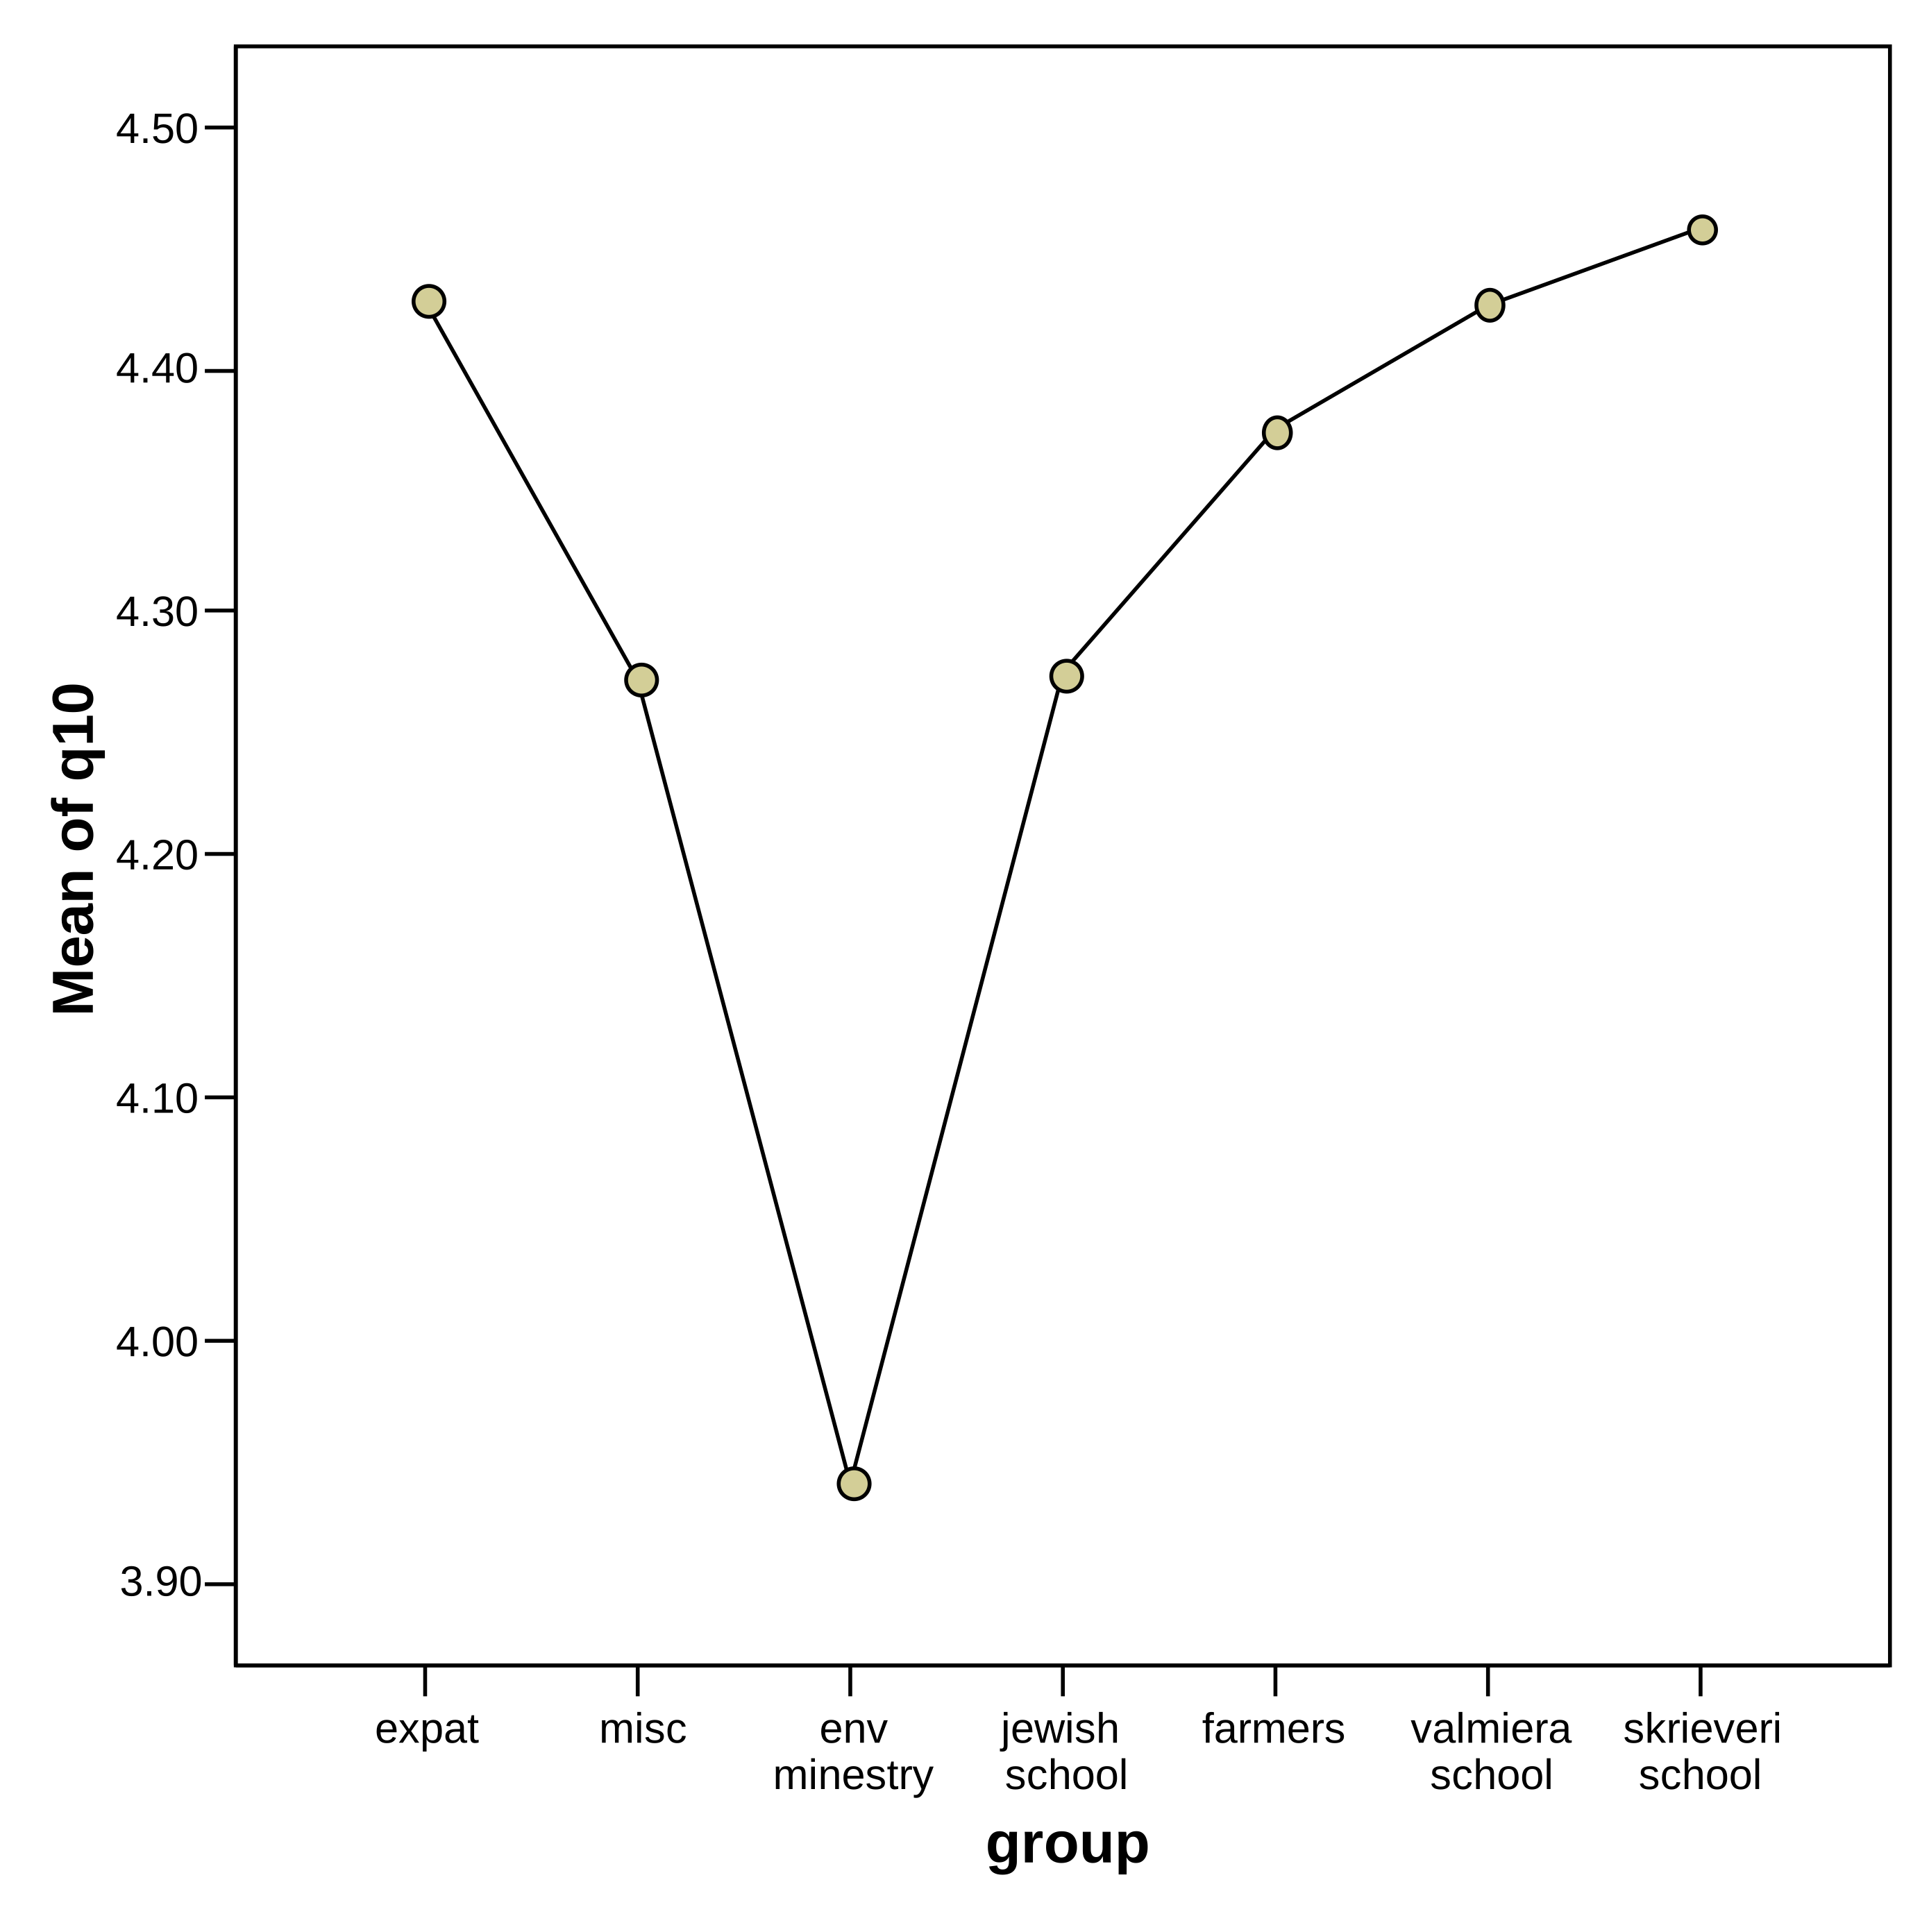
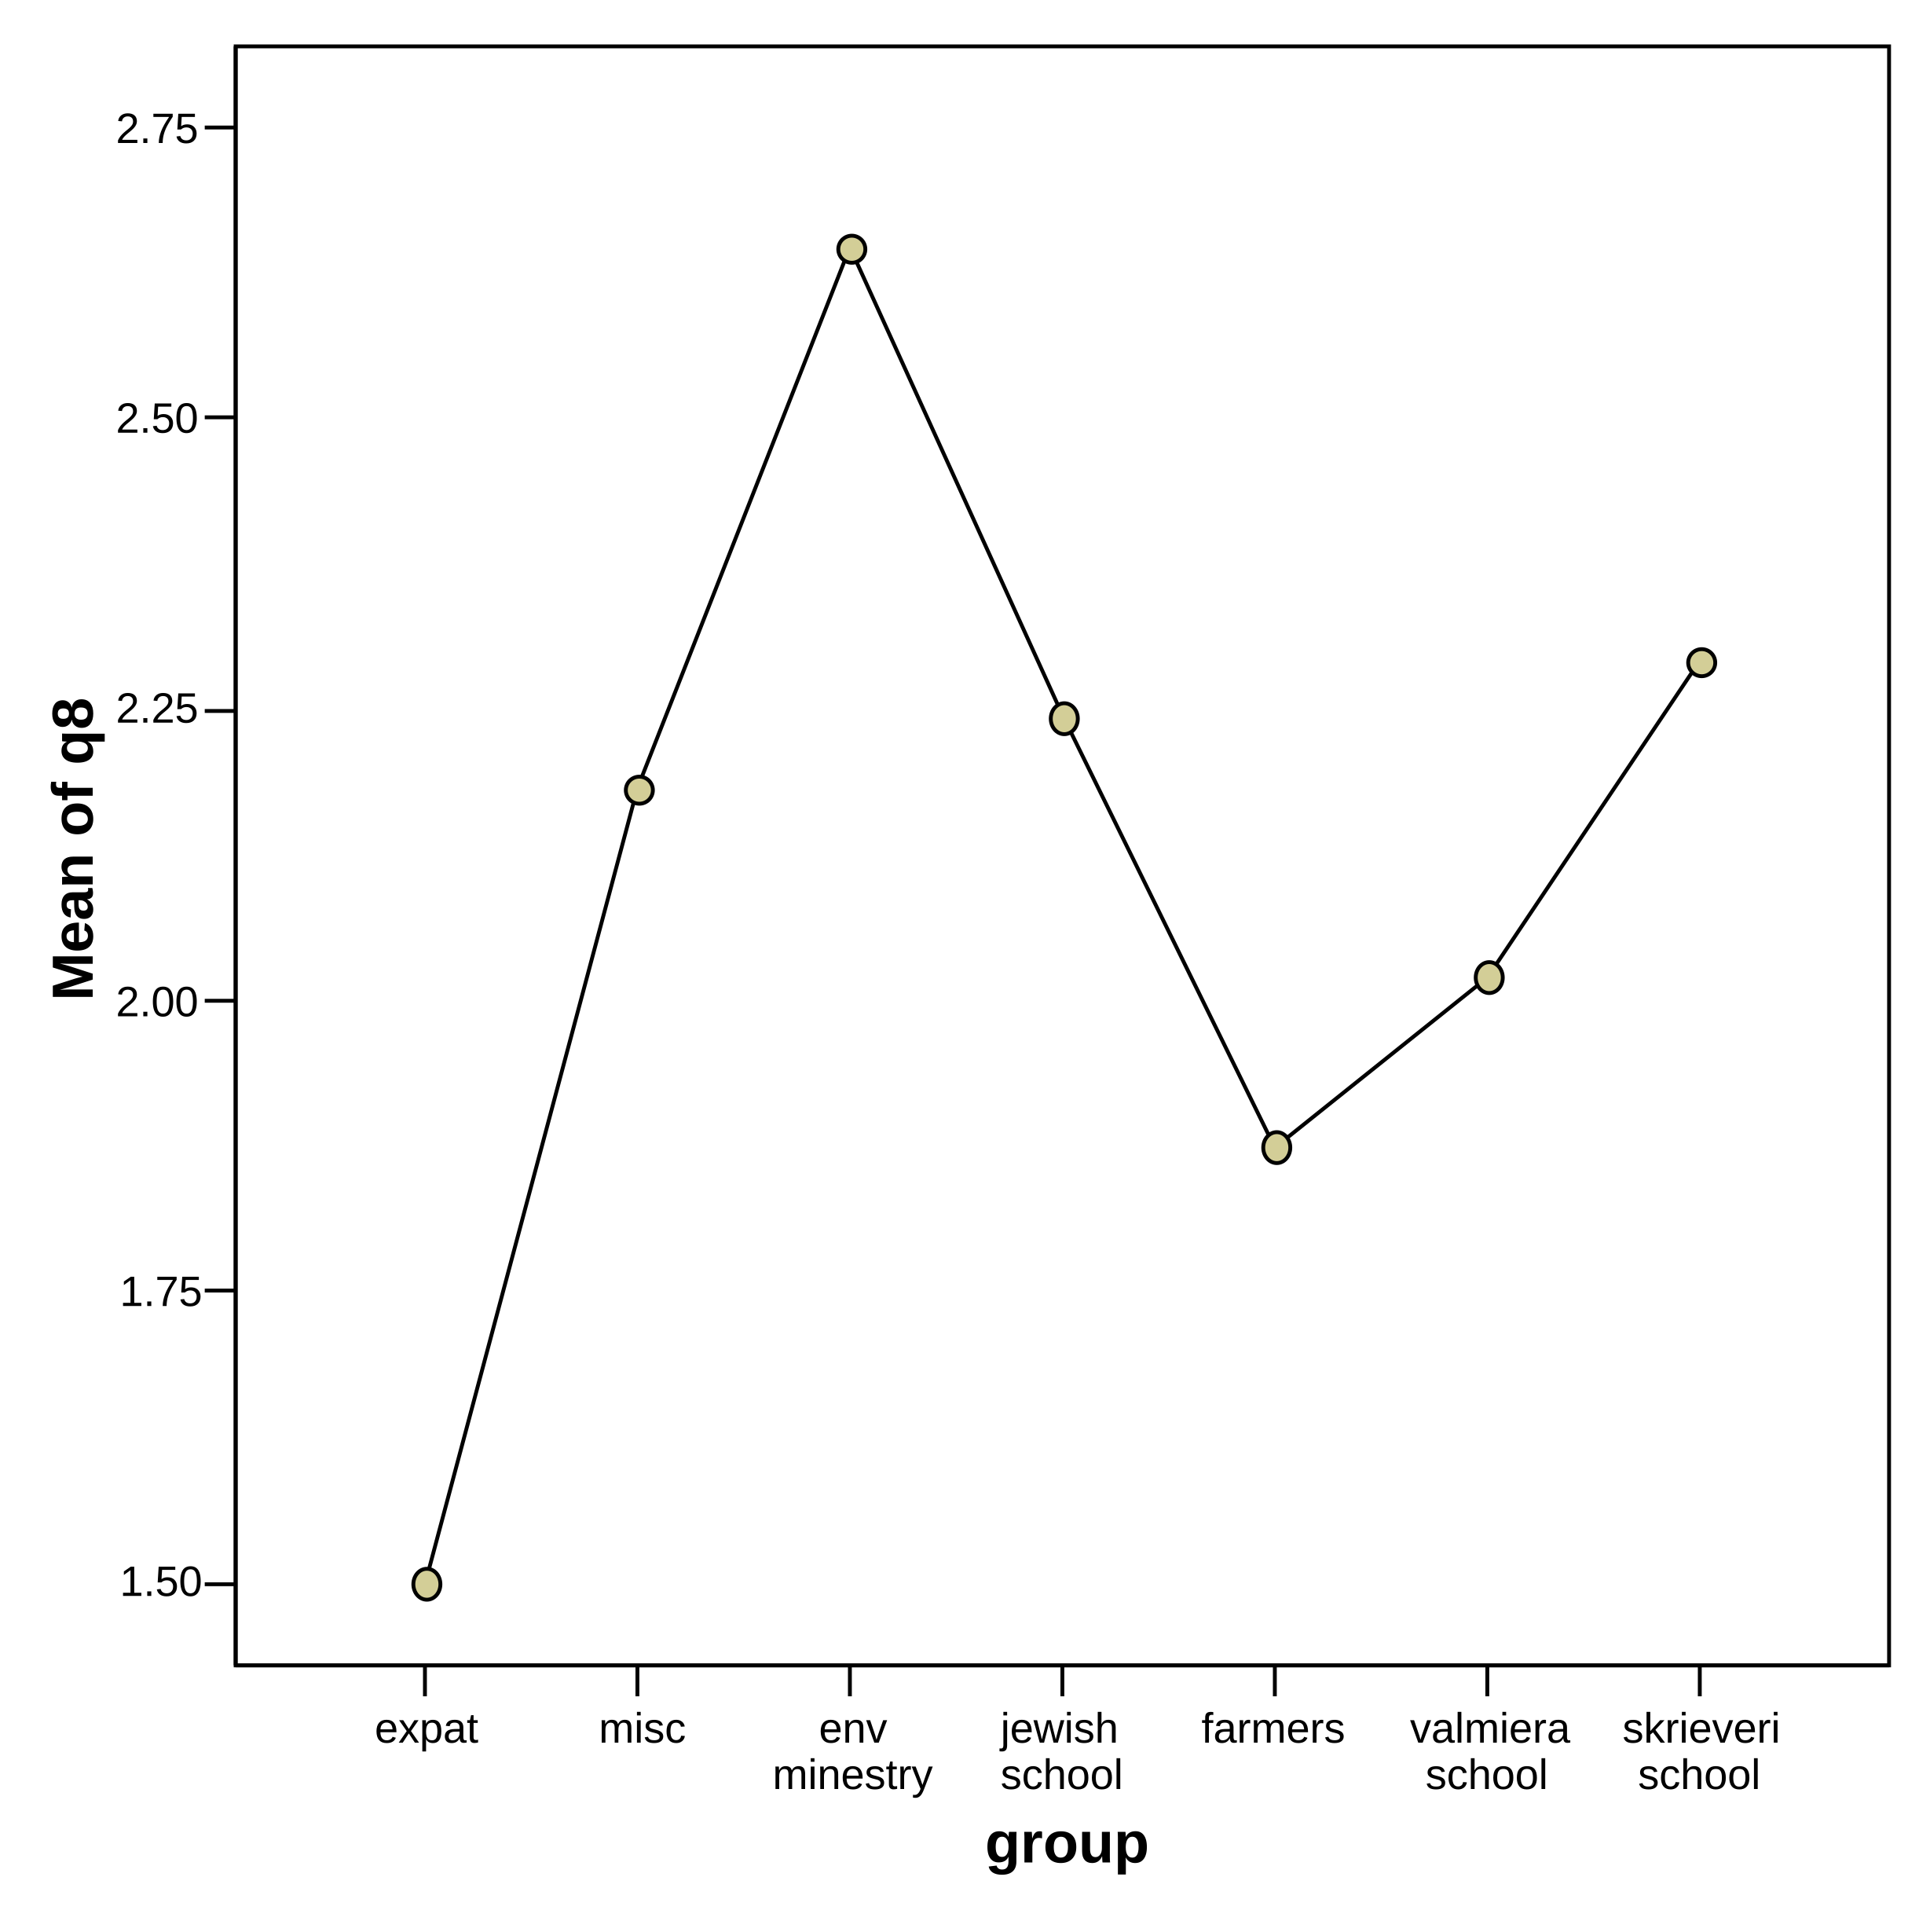
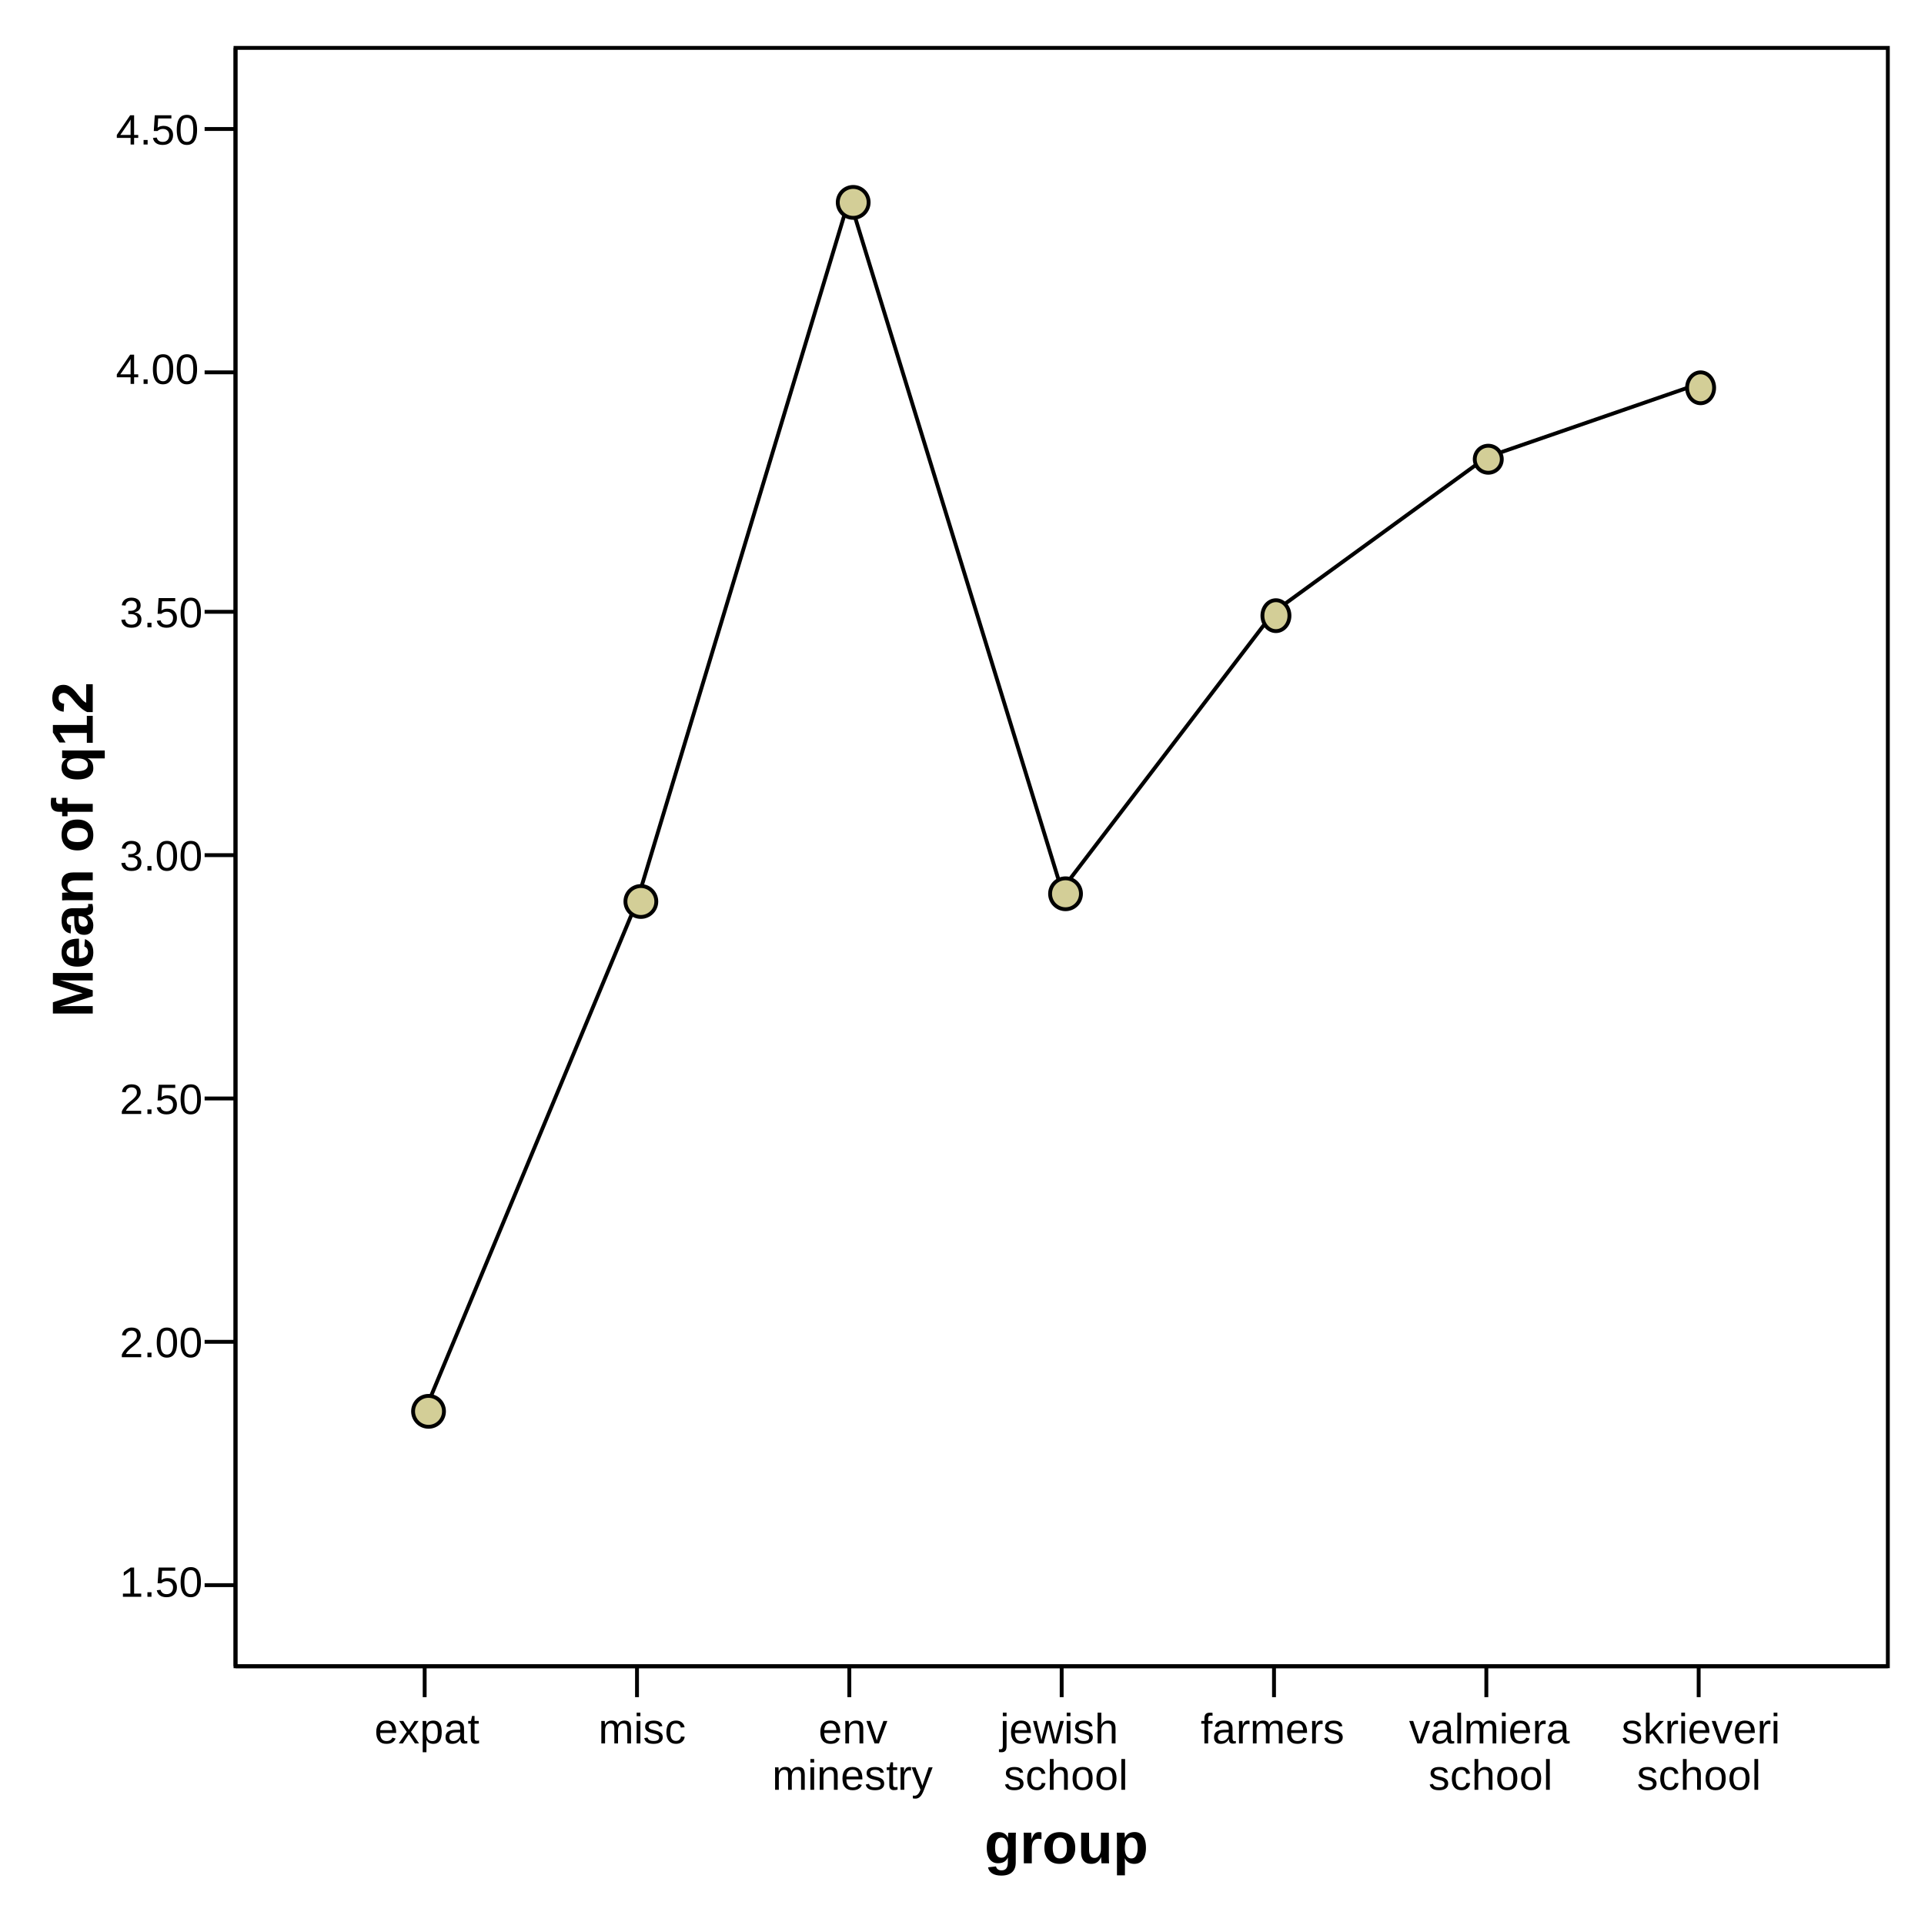
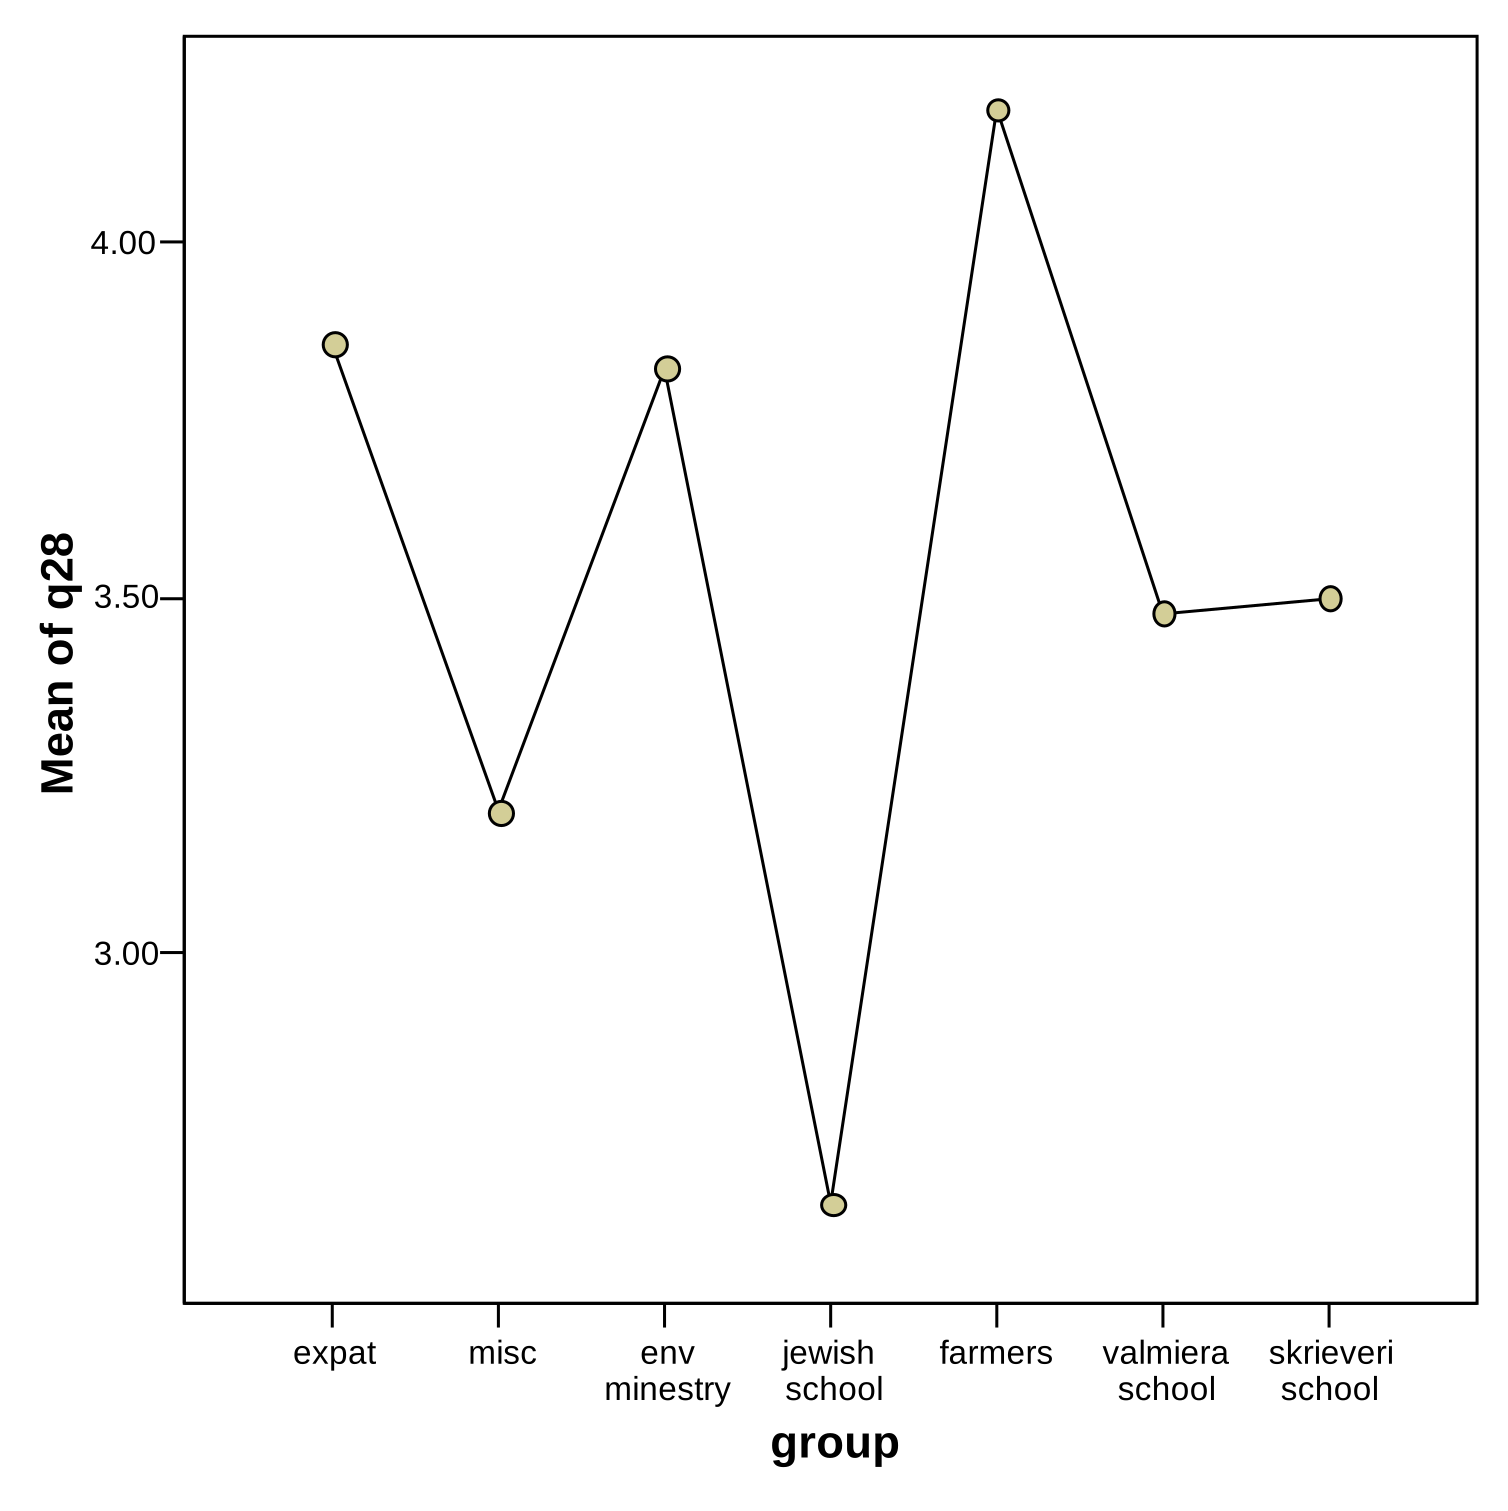
The other 89 figures were never pictures at all. Word had stored them as Windows metafiles — lists of drawing commands, pen by pen and letter by letter — so nothing was there to extract as an image. They have been replayed instead, command by command, into SVG: the same lines, the same fonts, the same labels, at any size you care to view them.
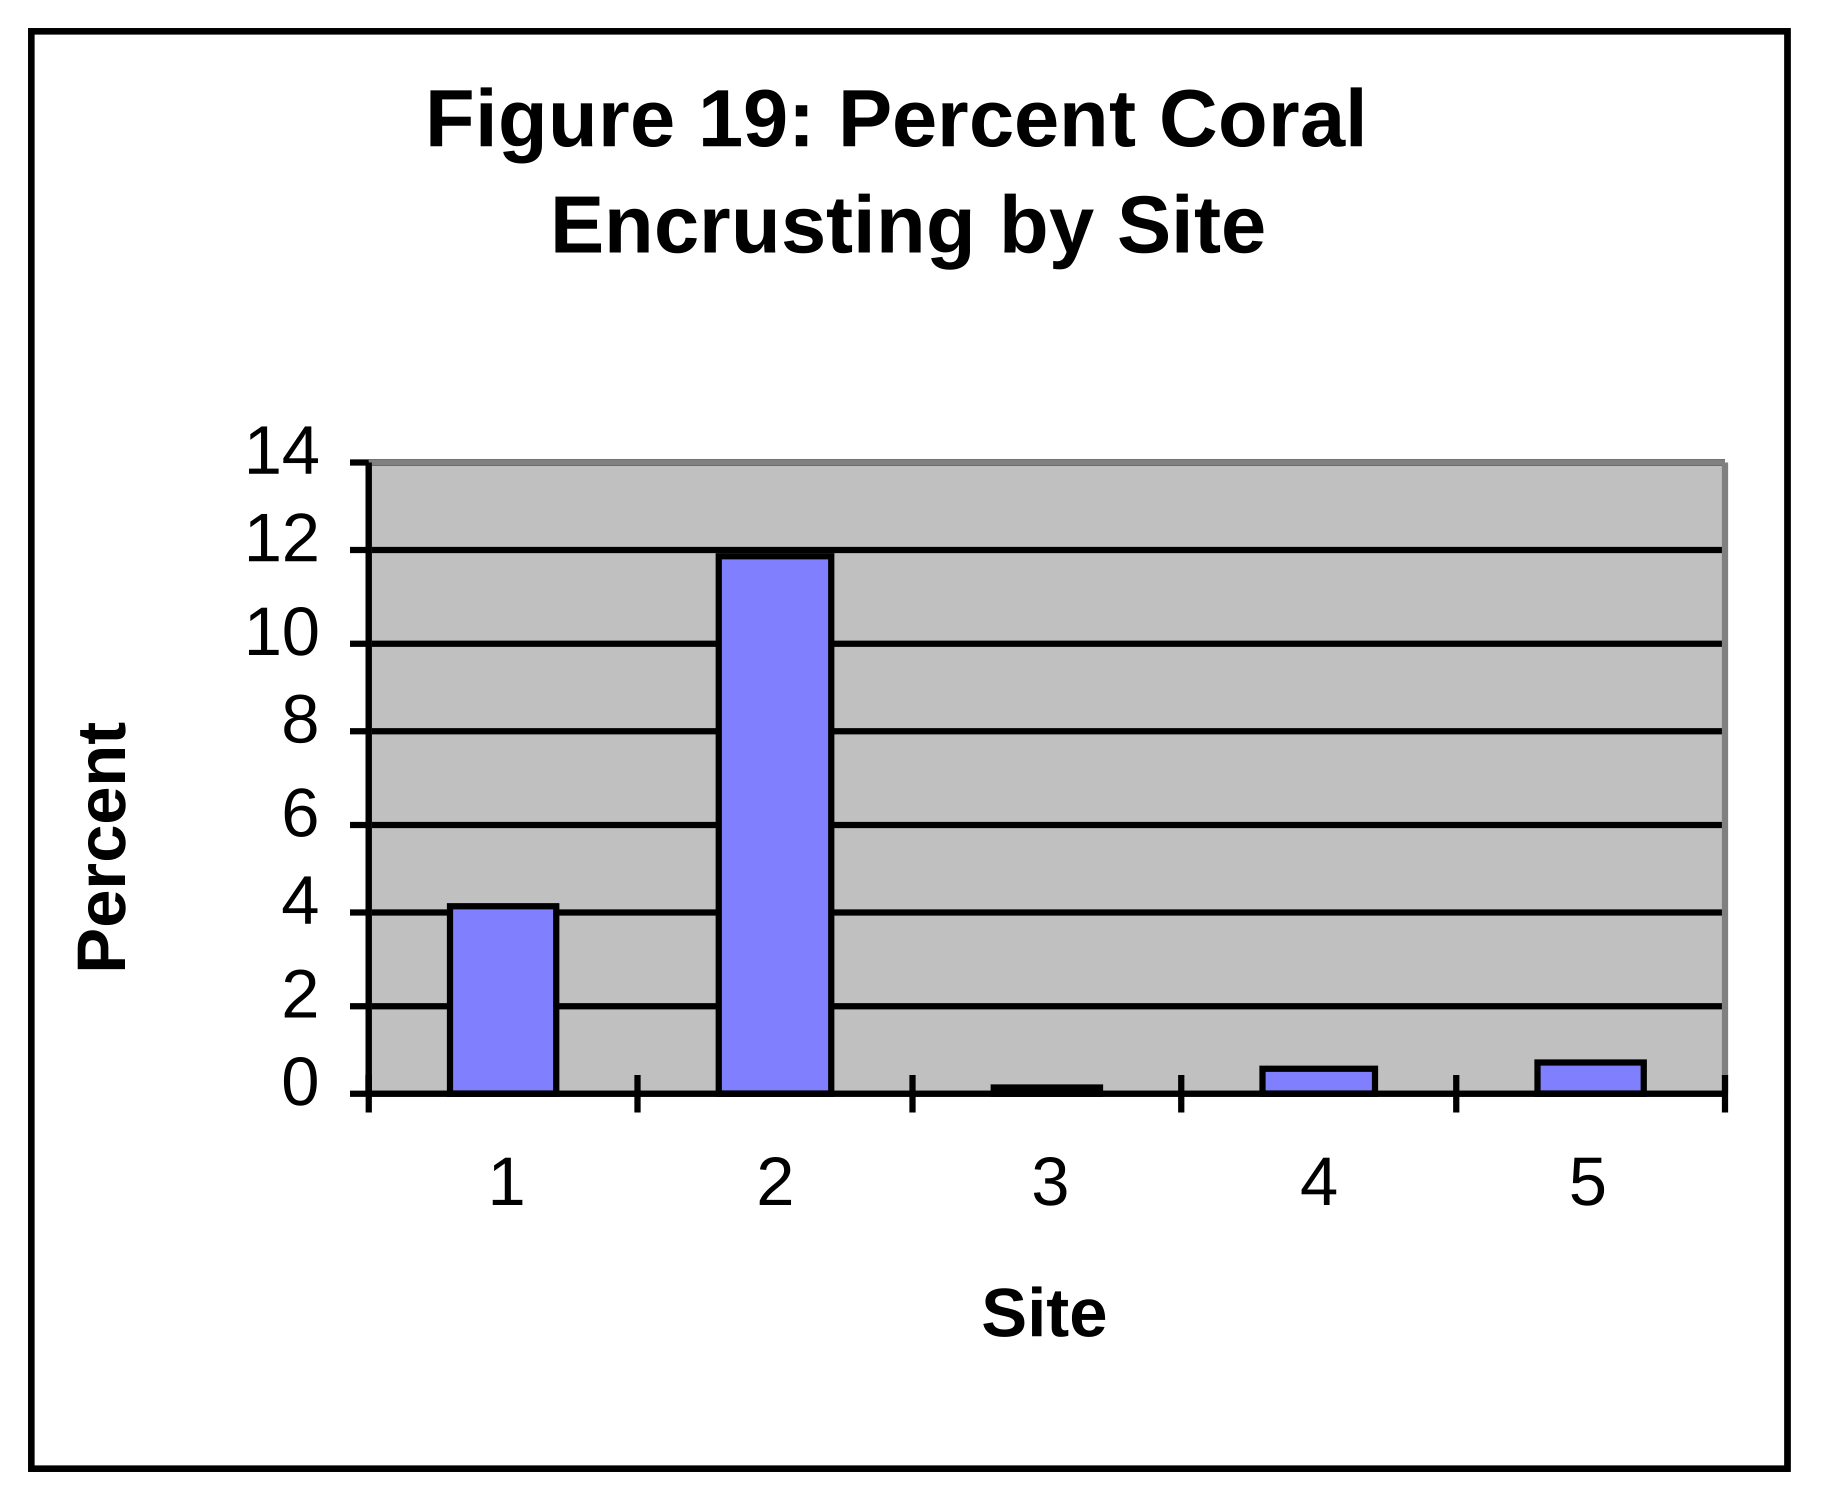
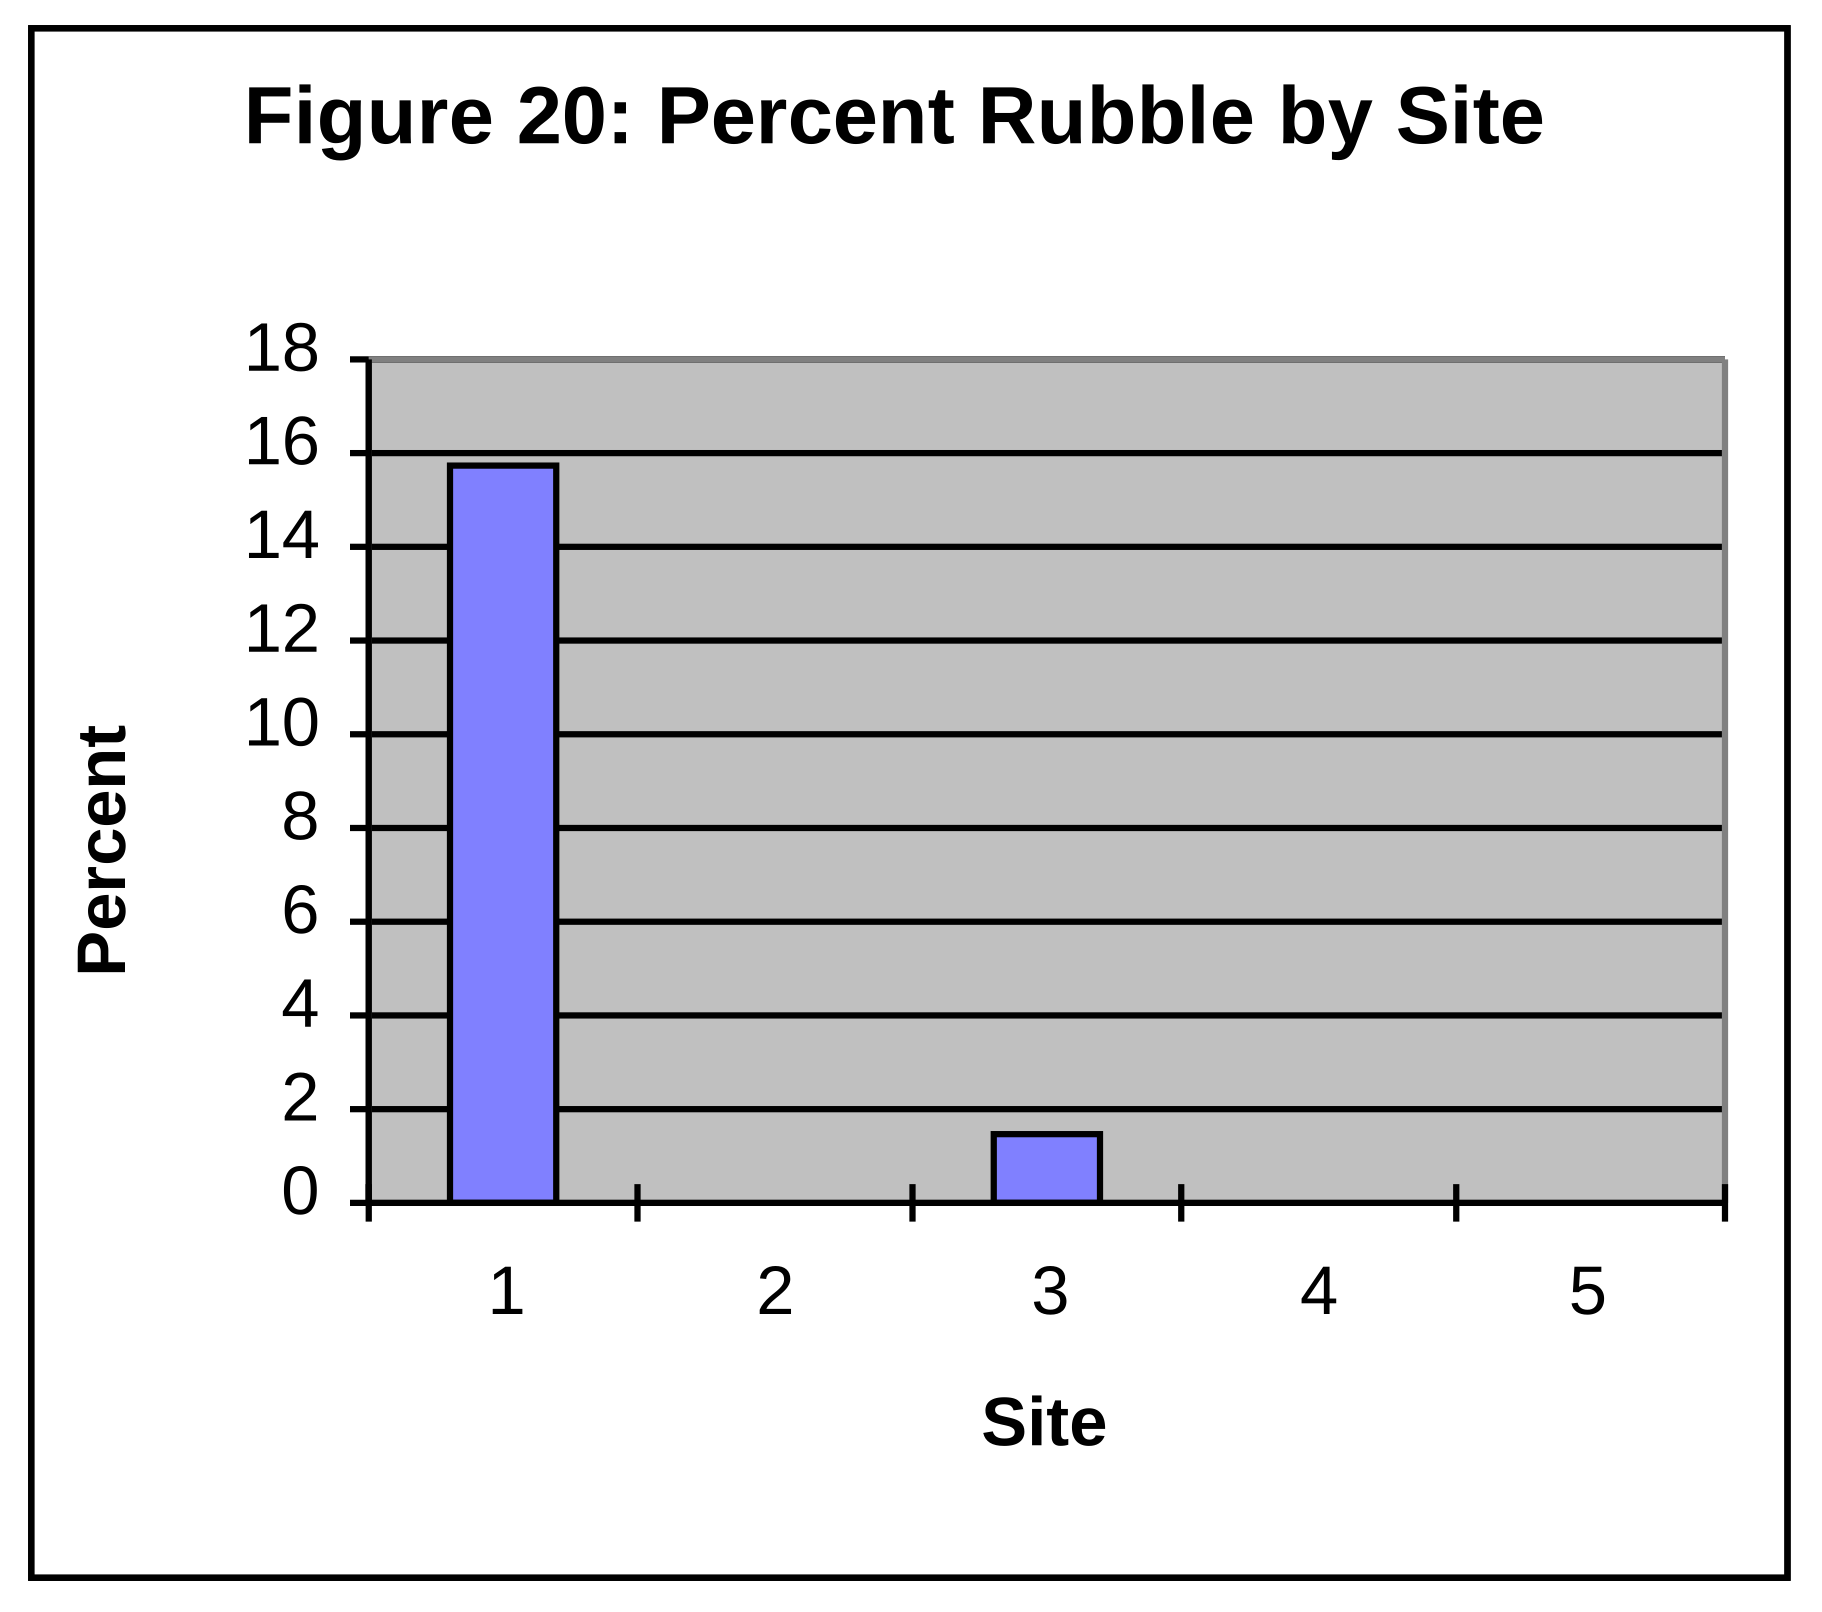
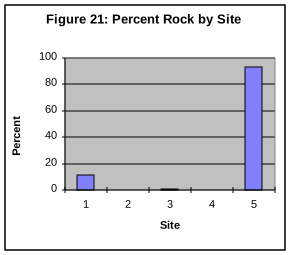
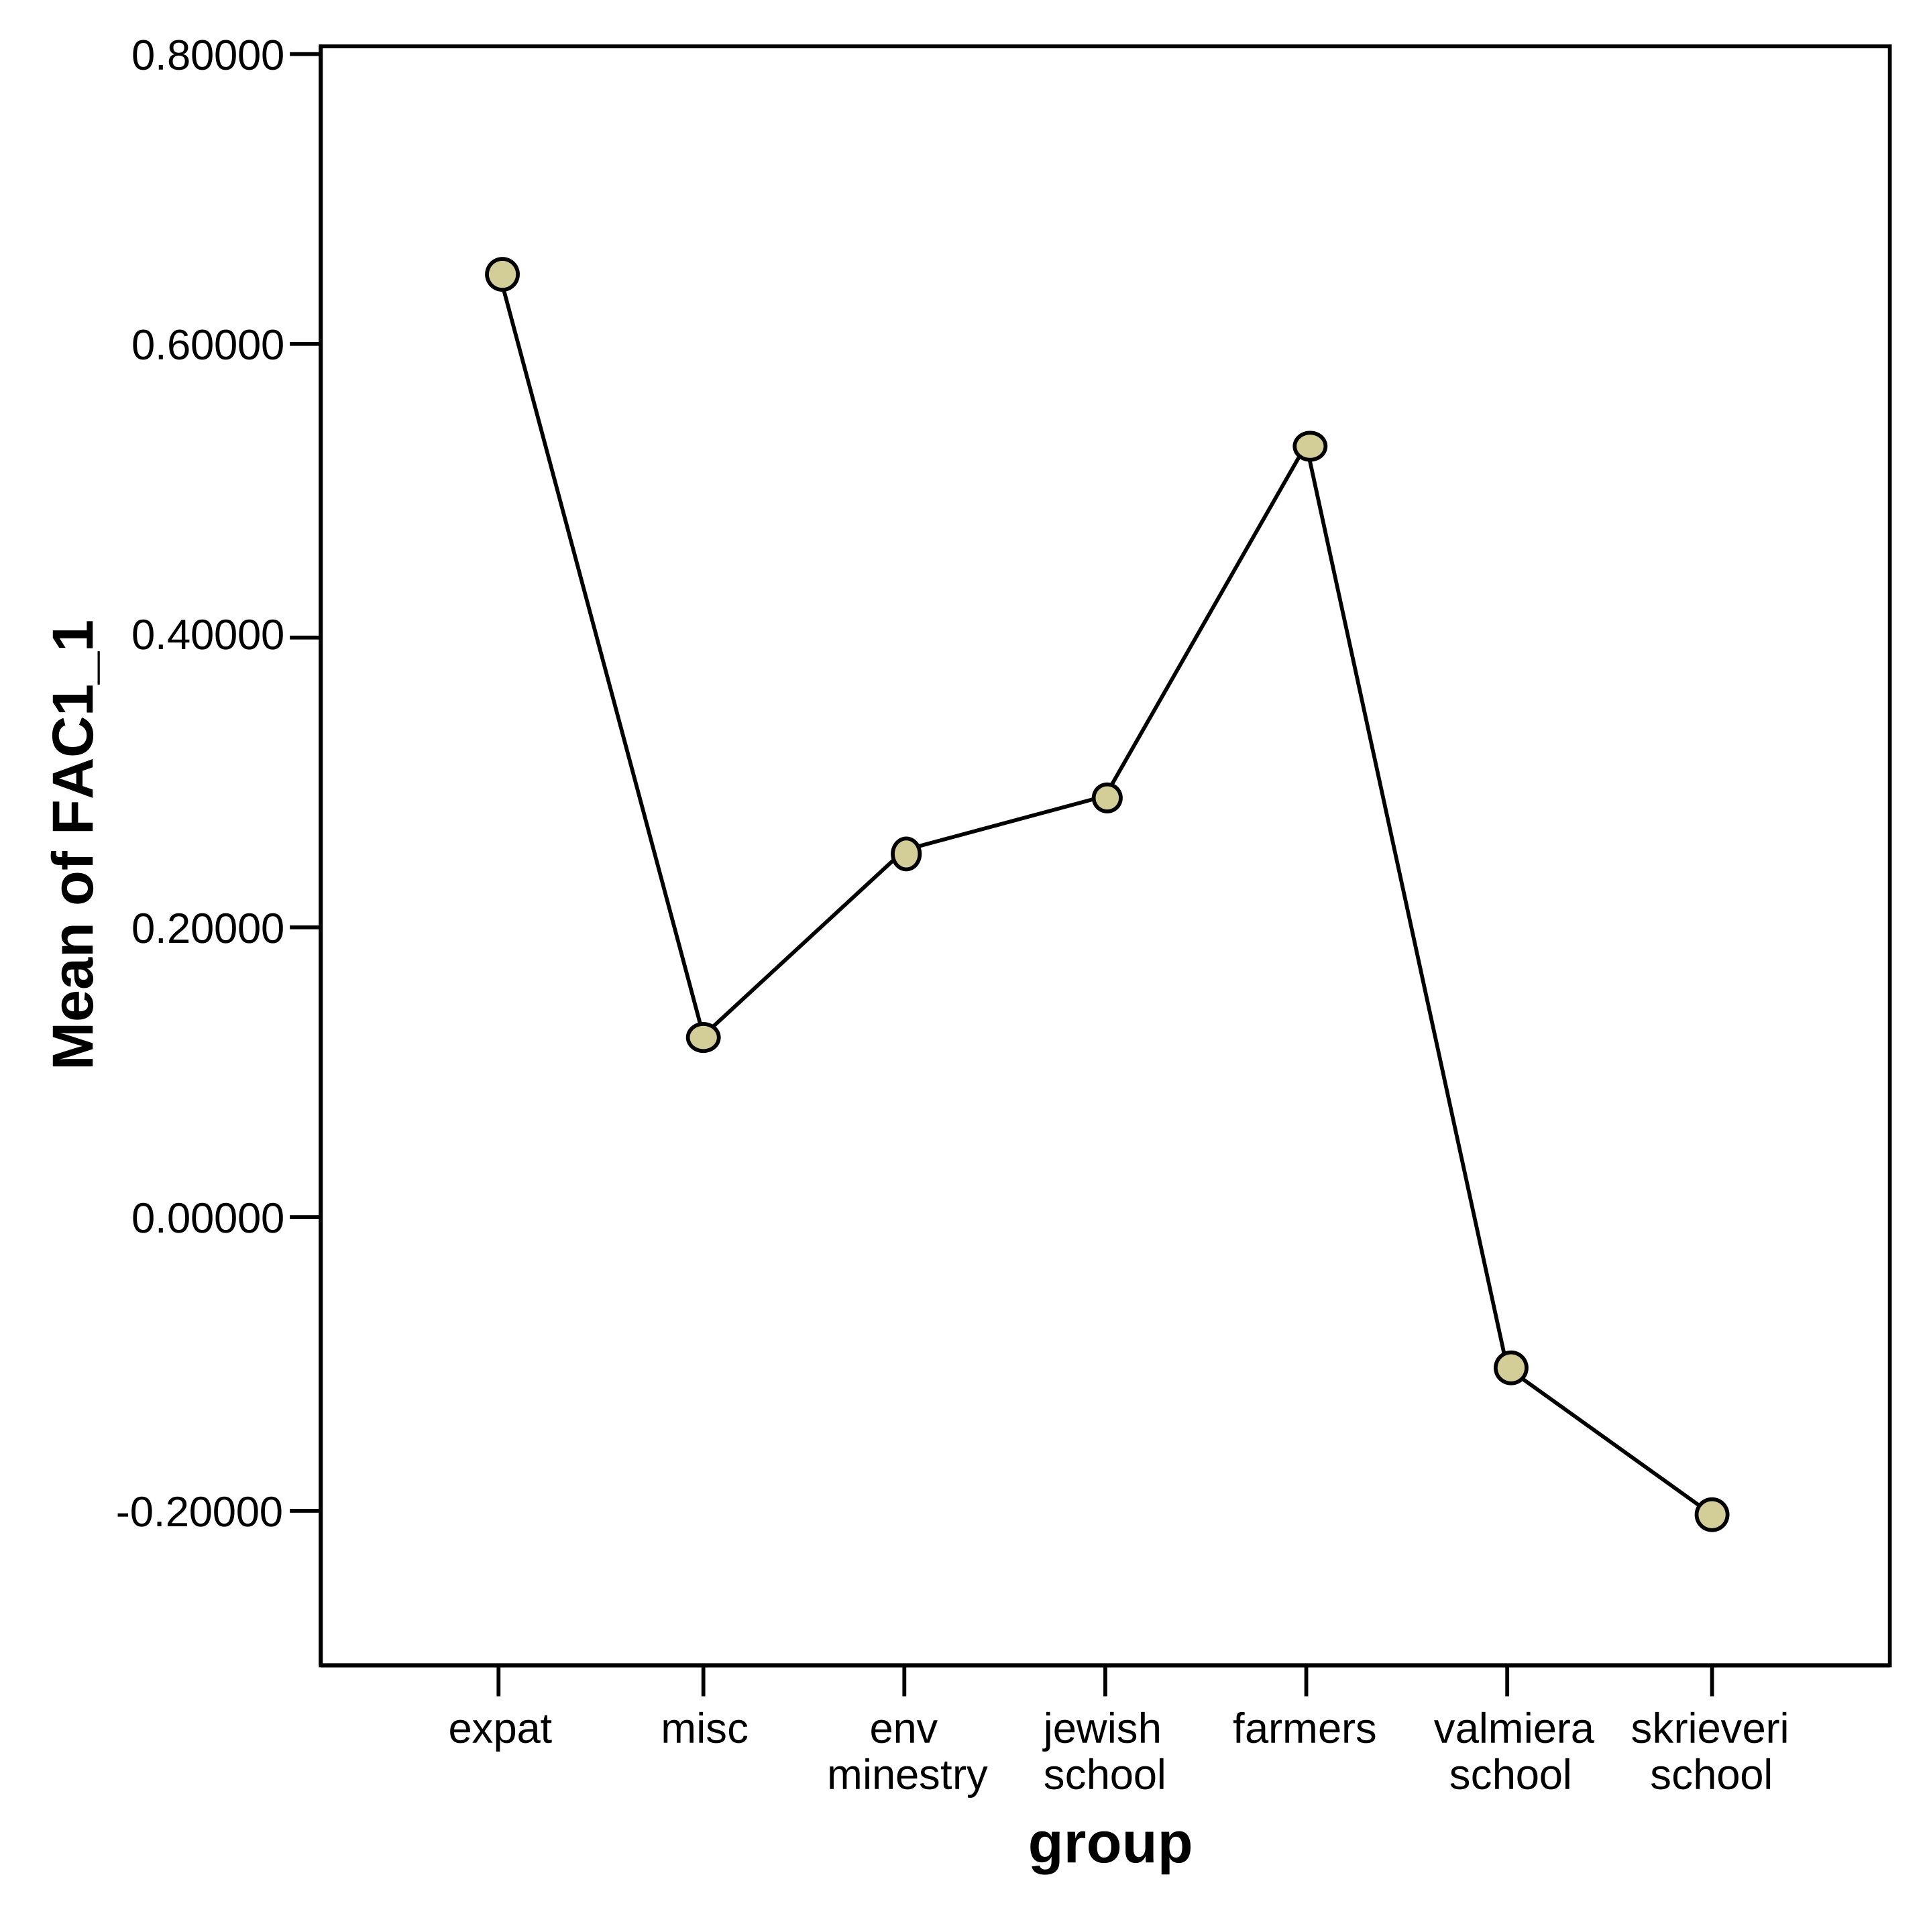
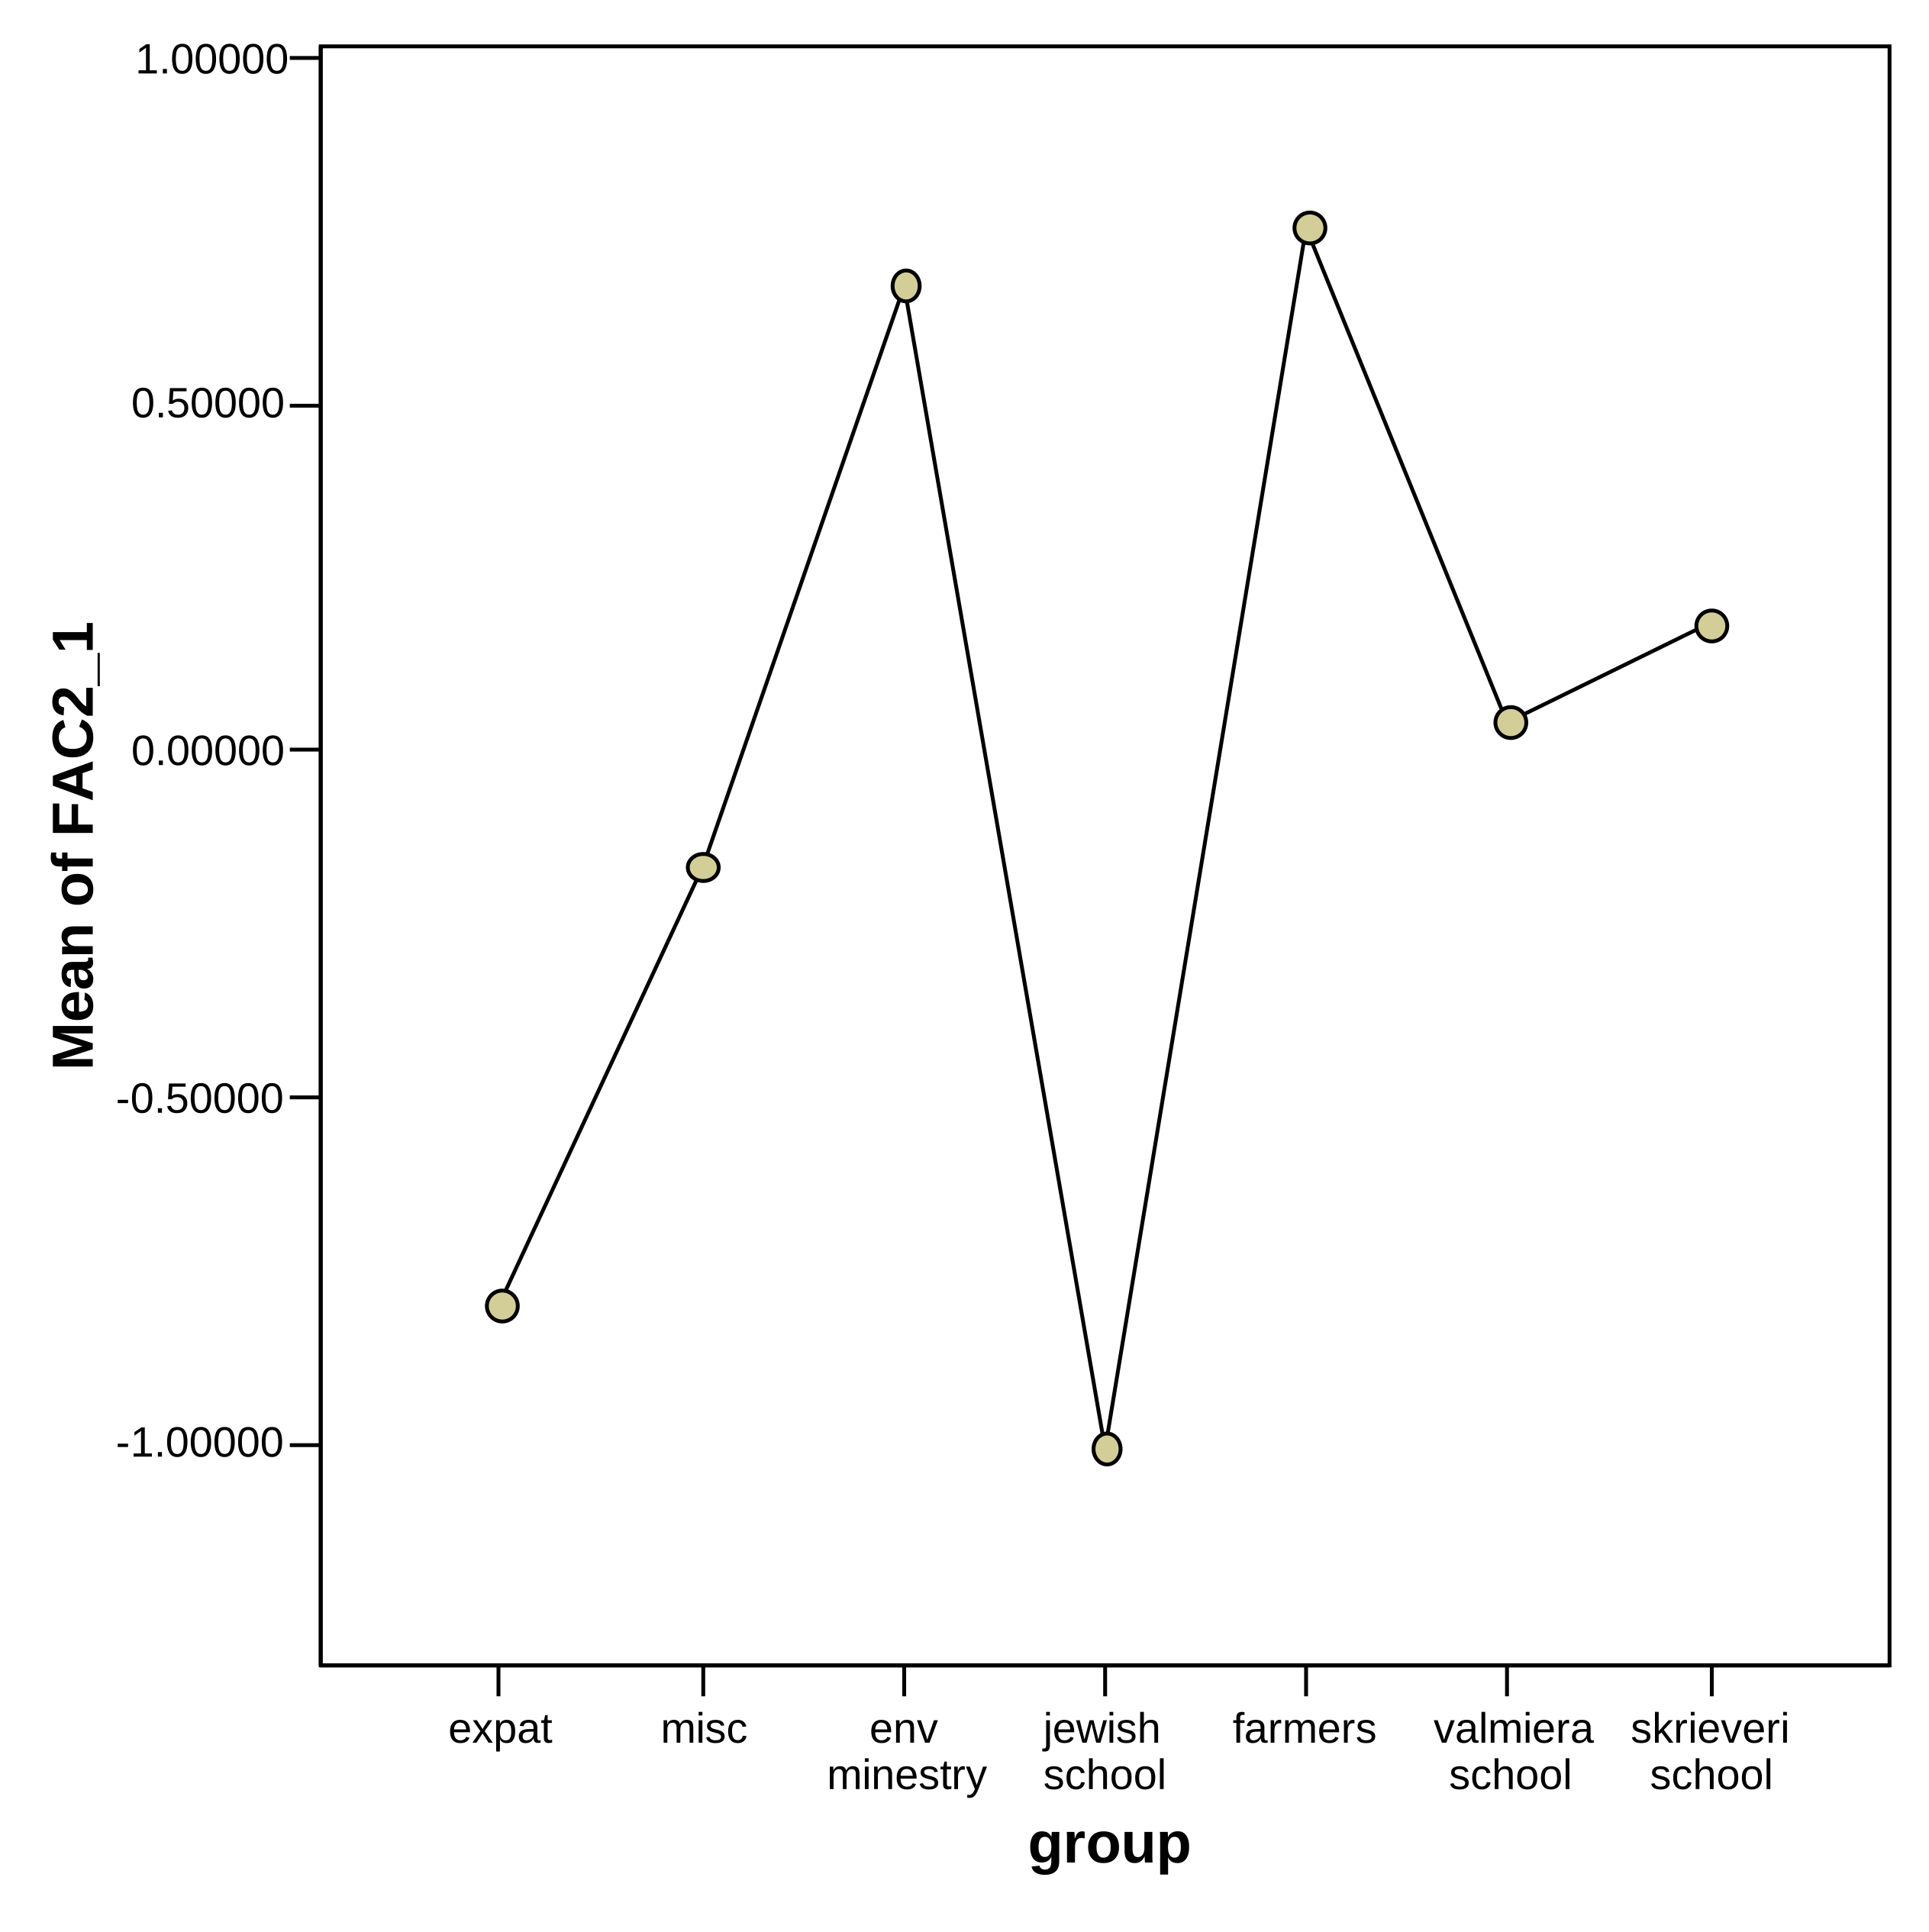
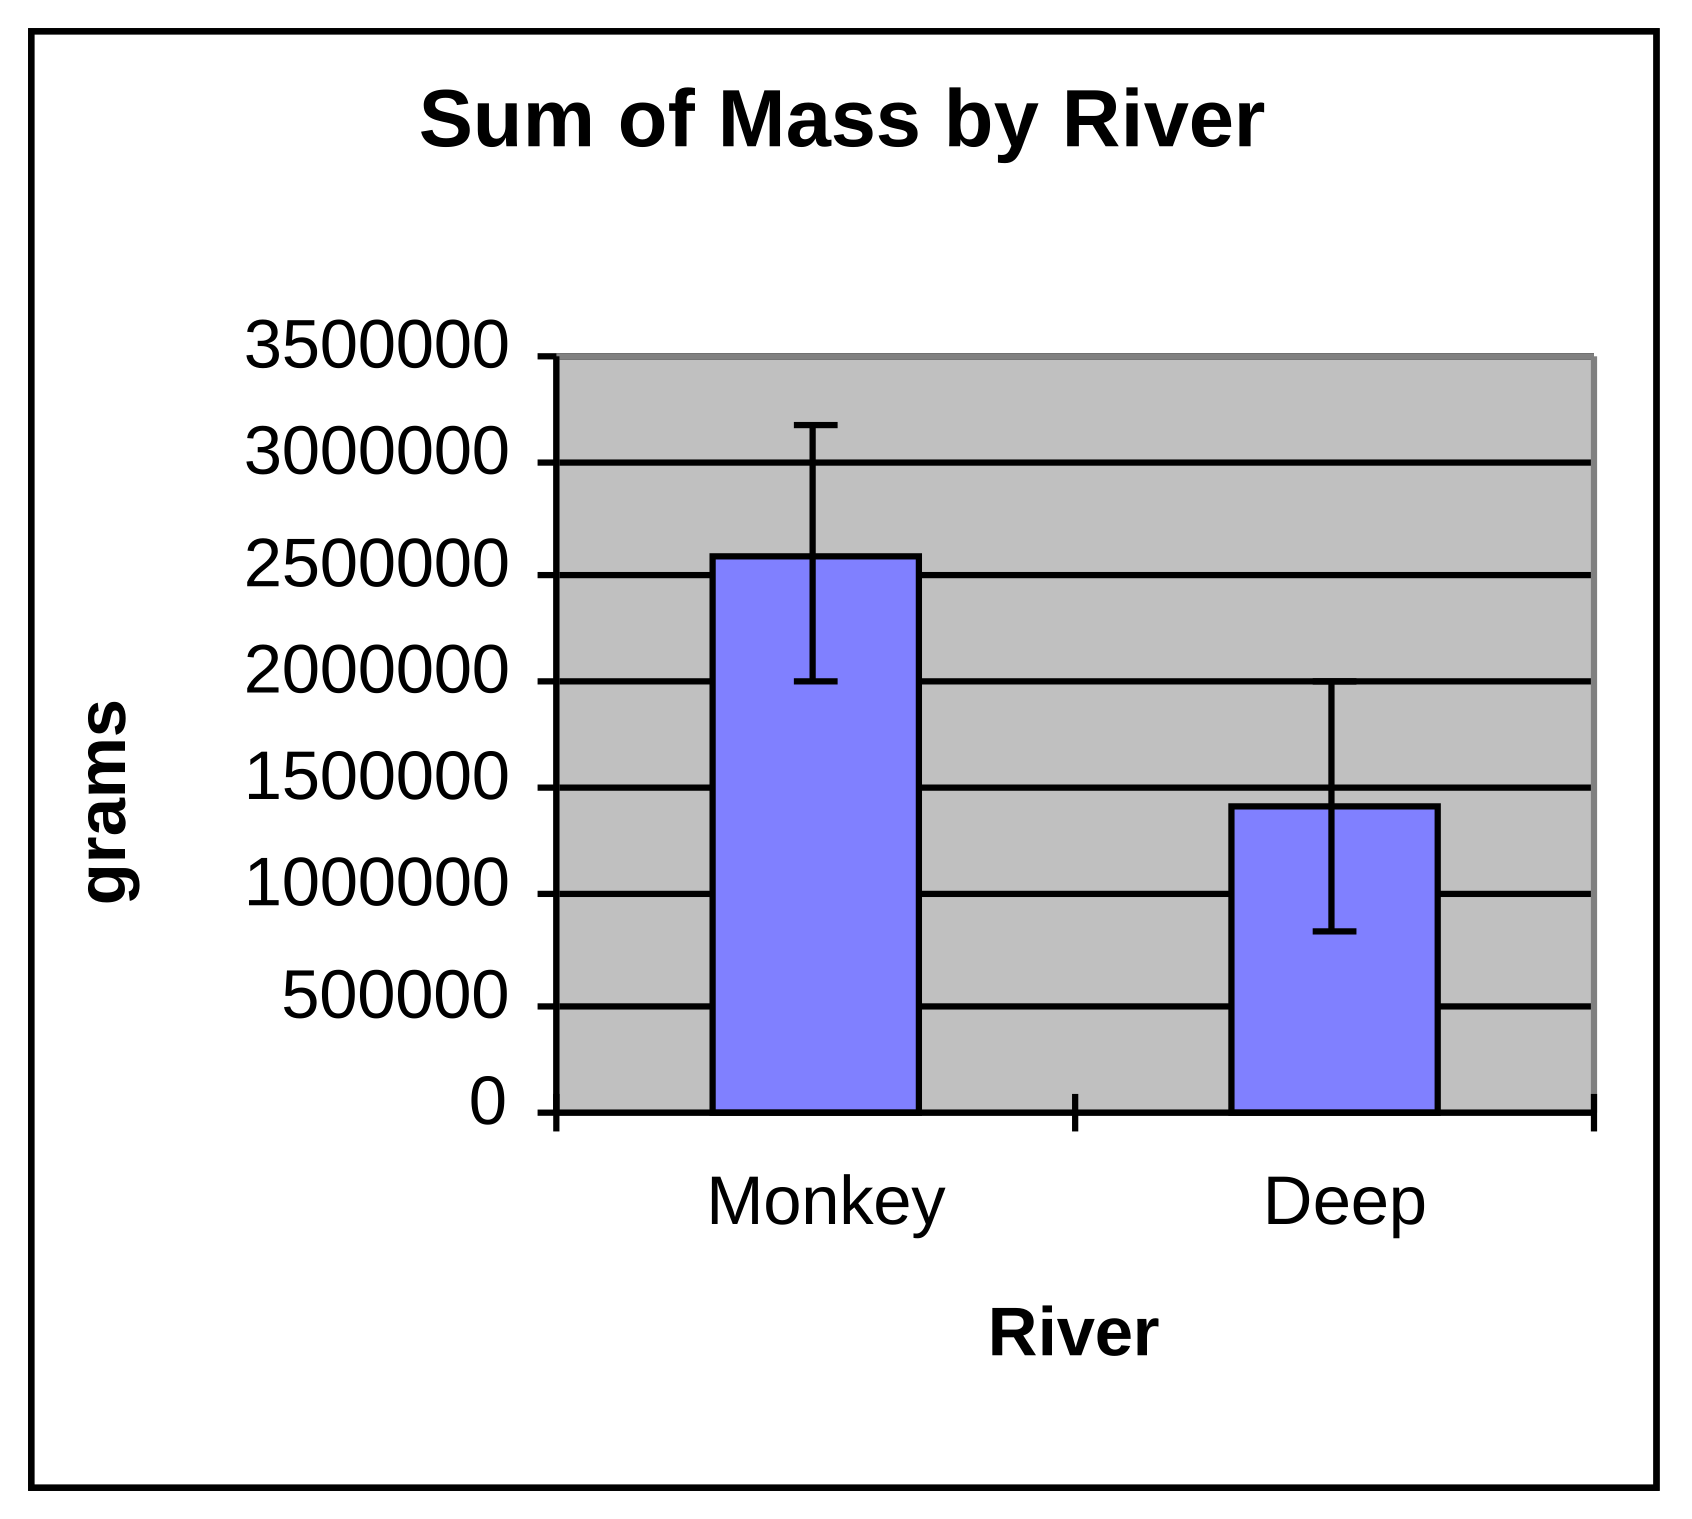
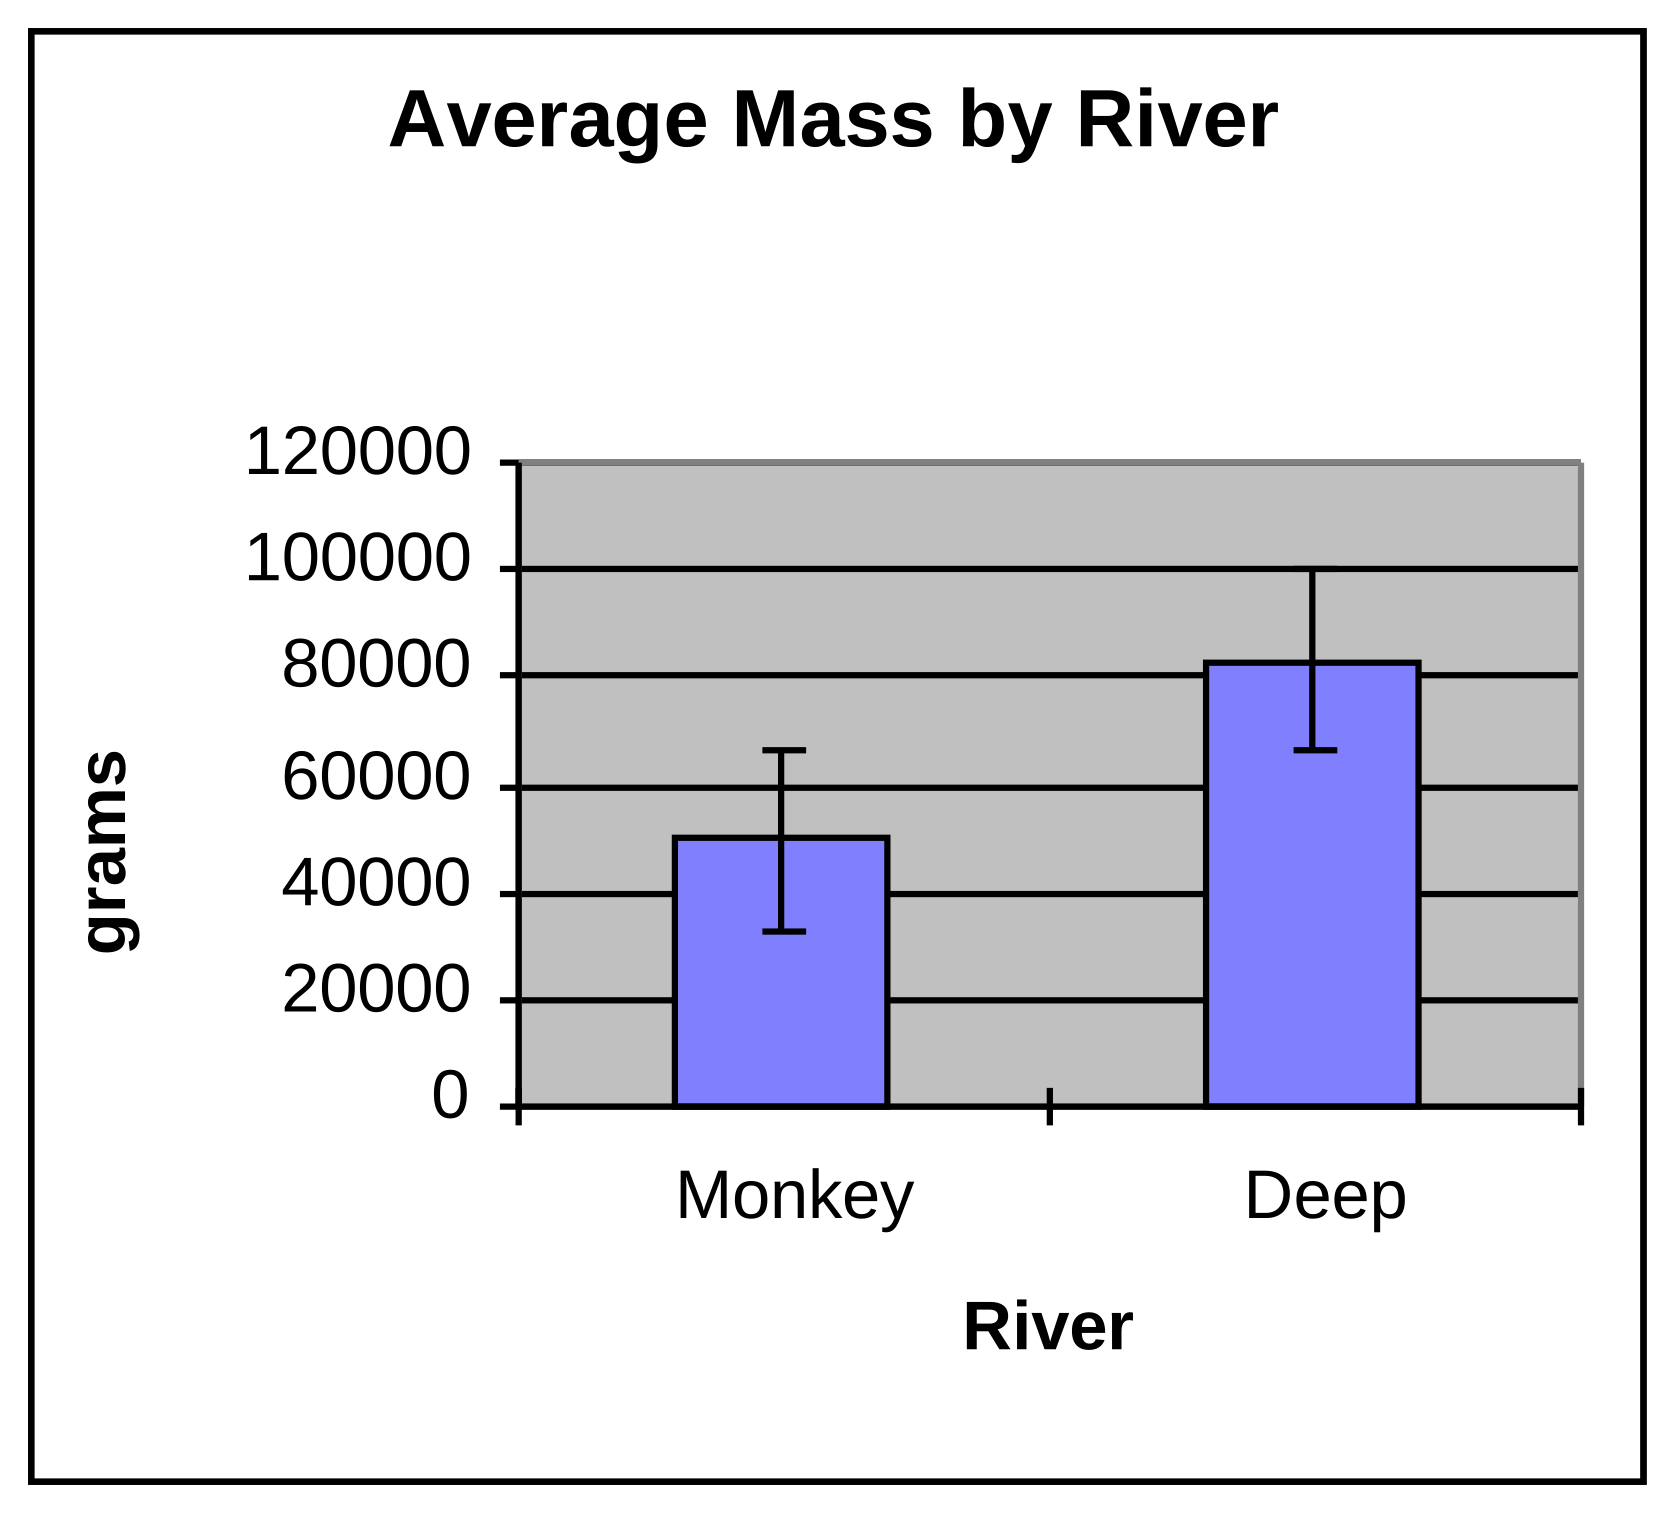
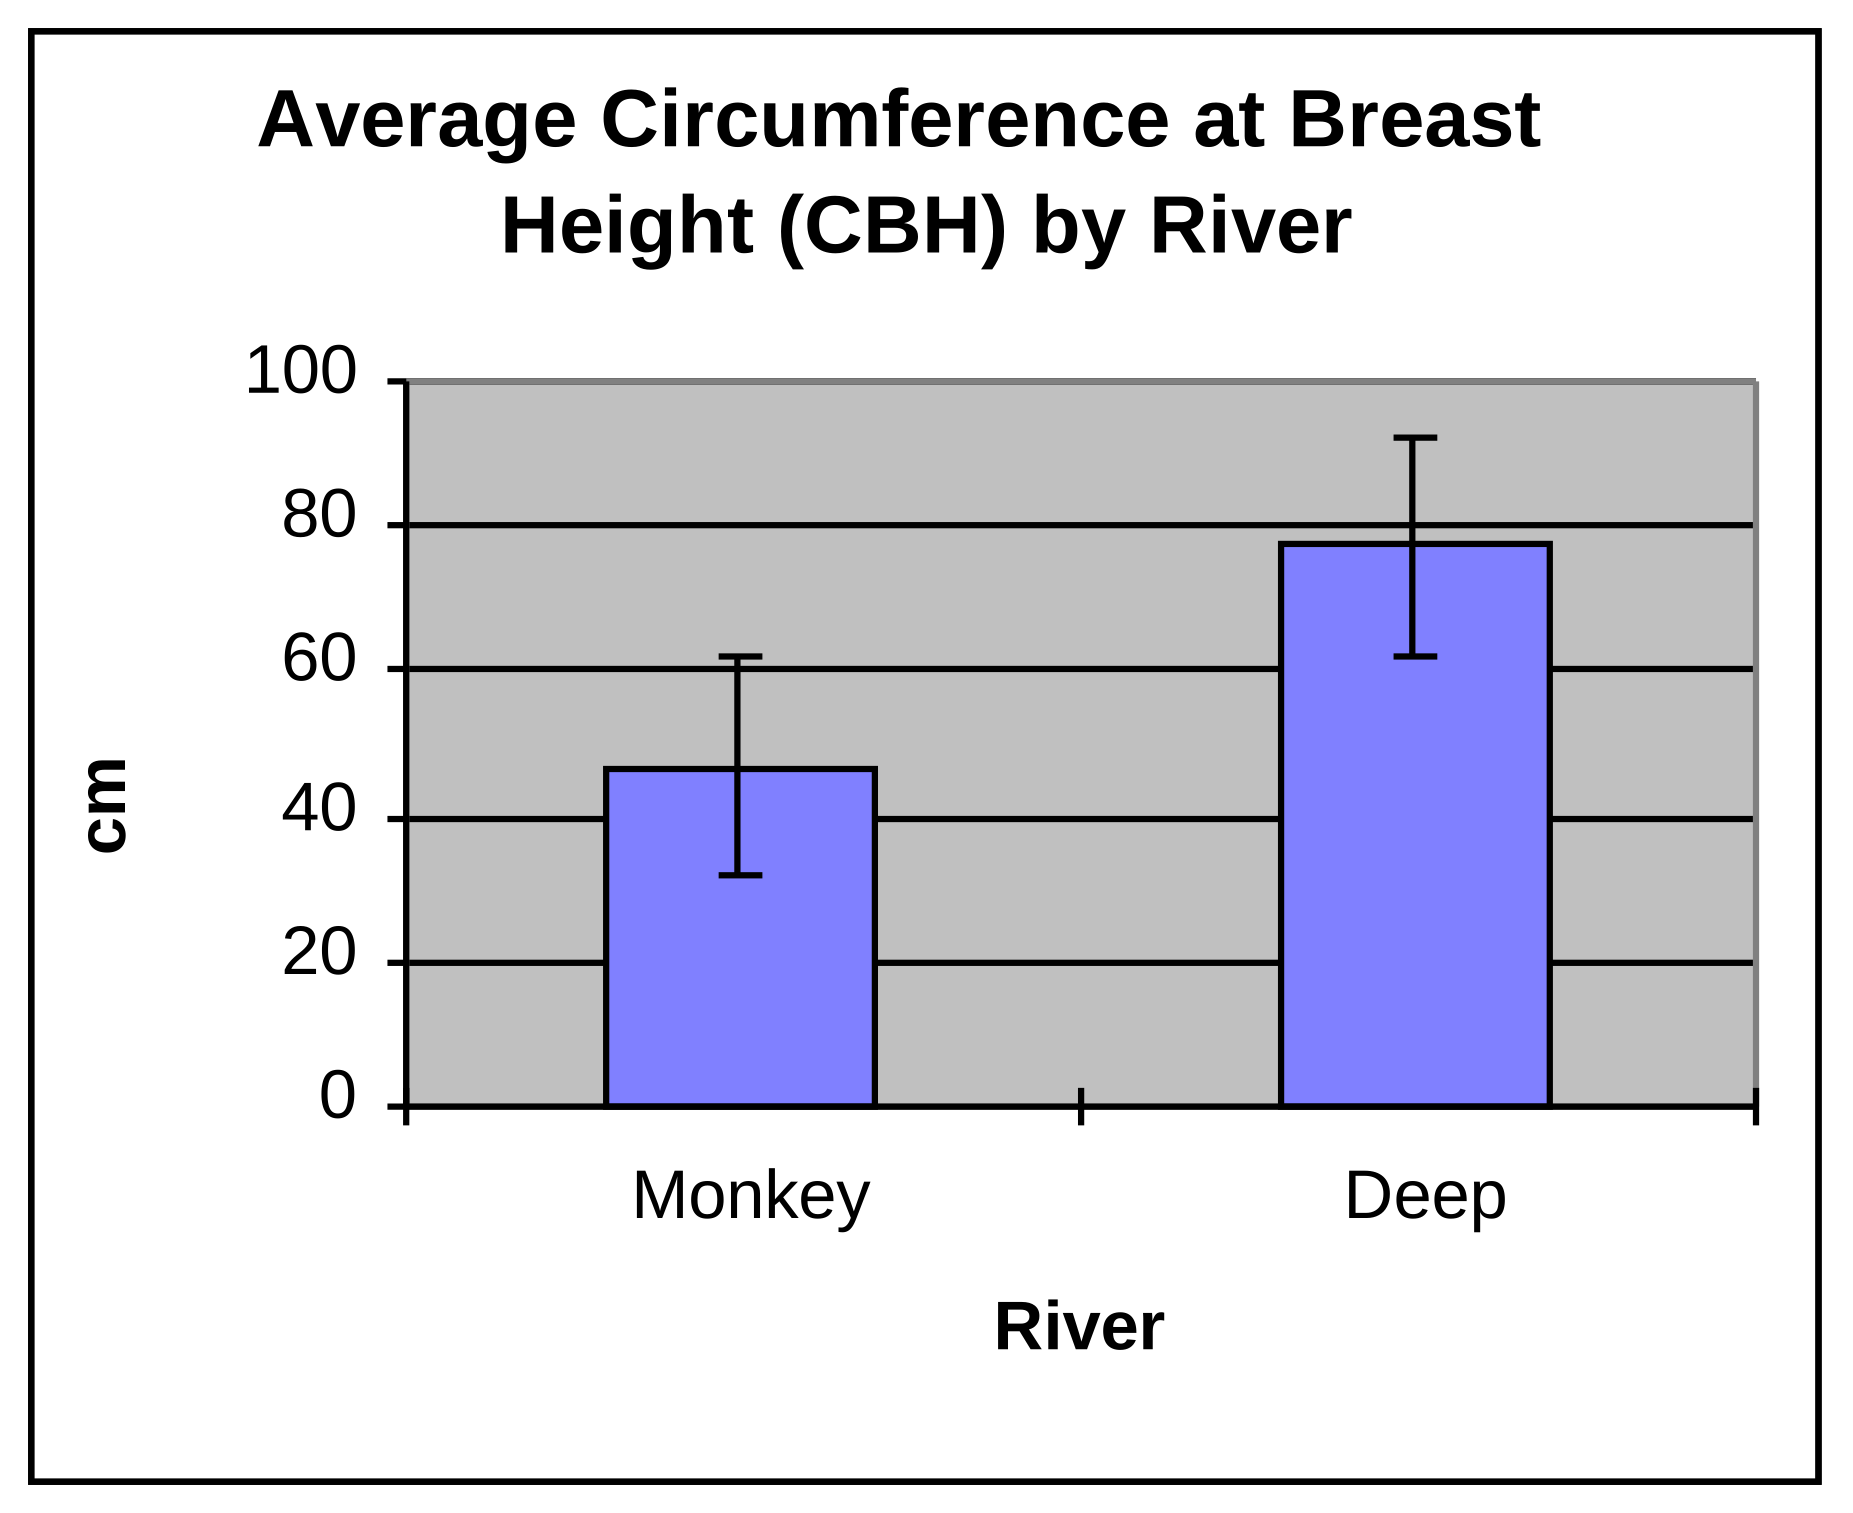
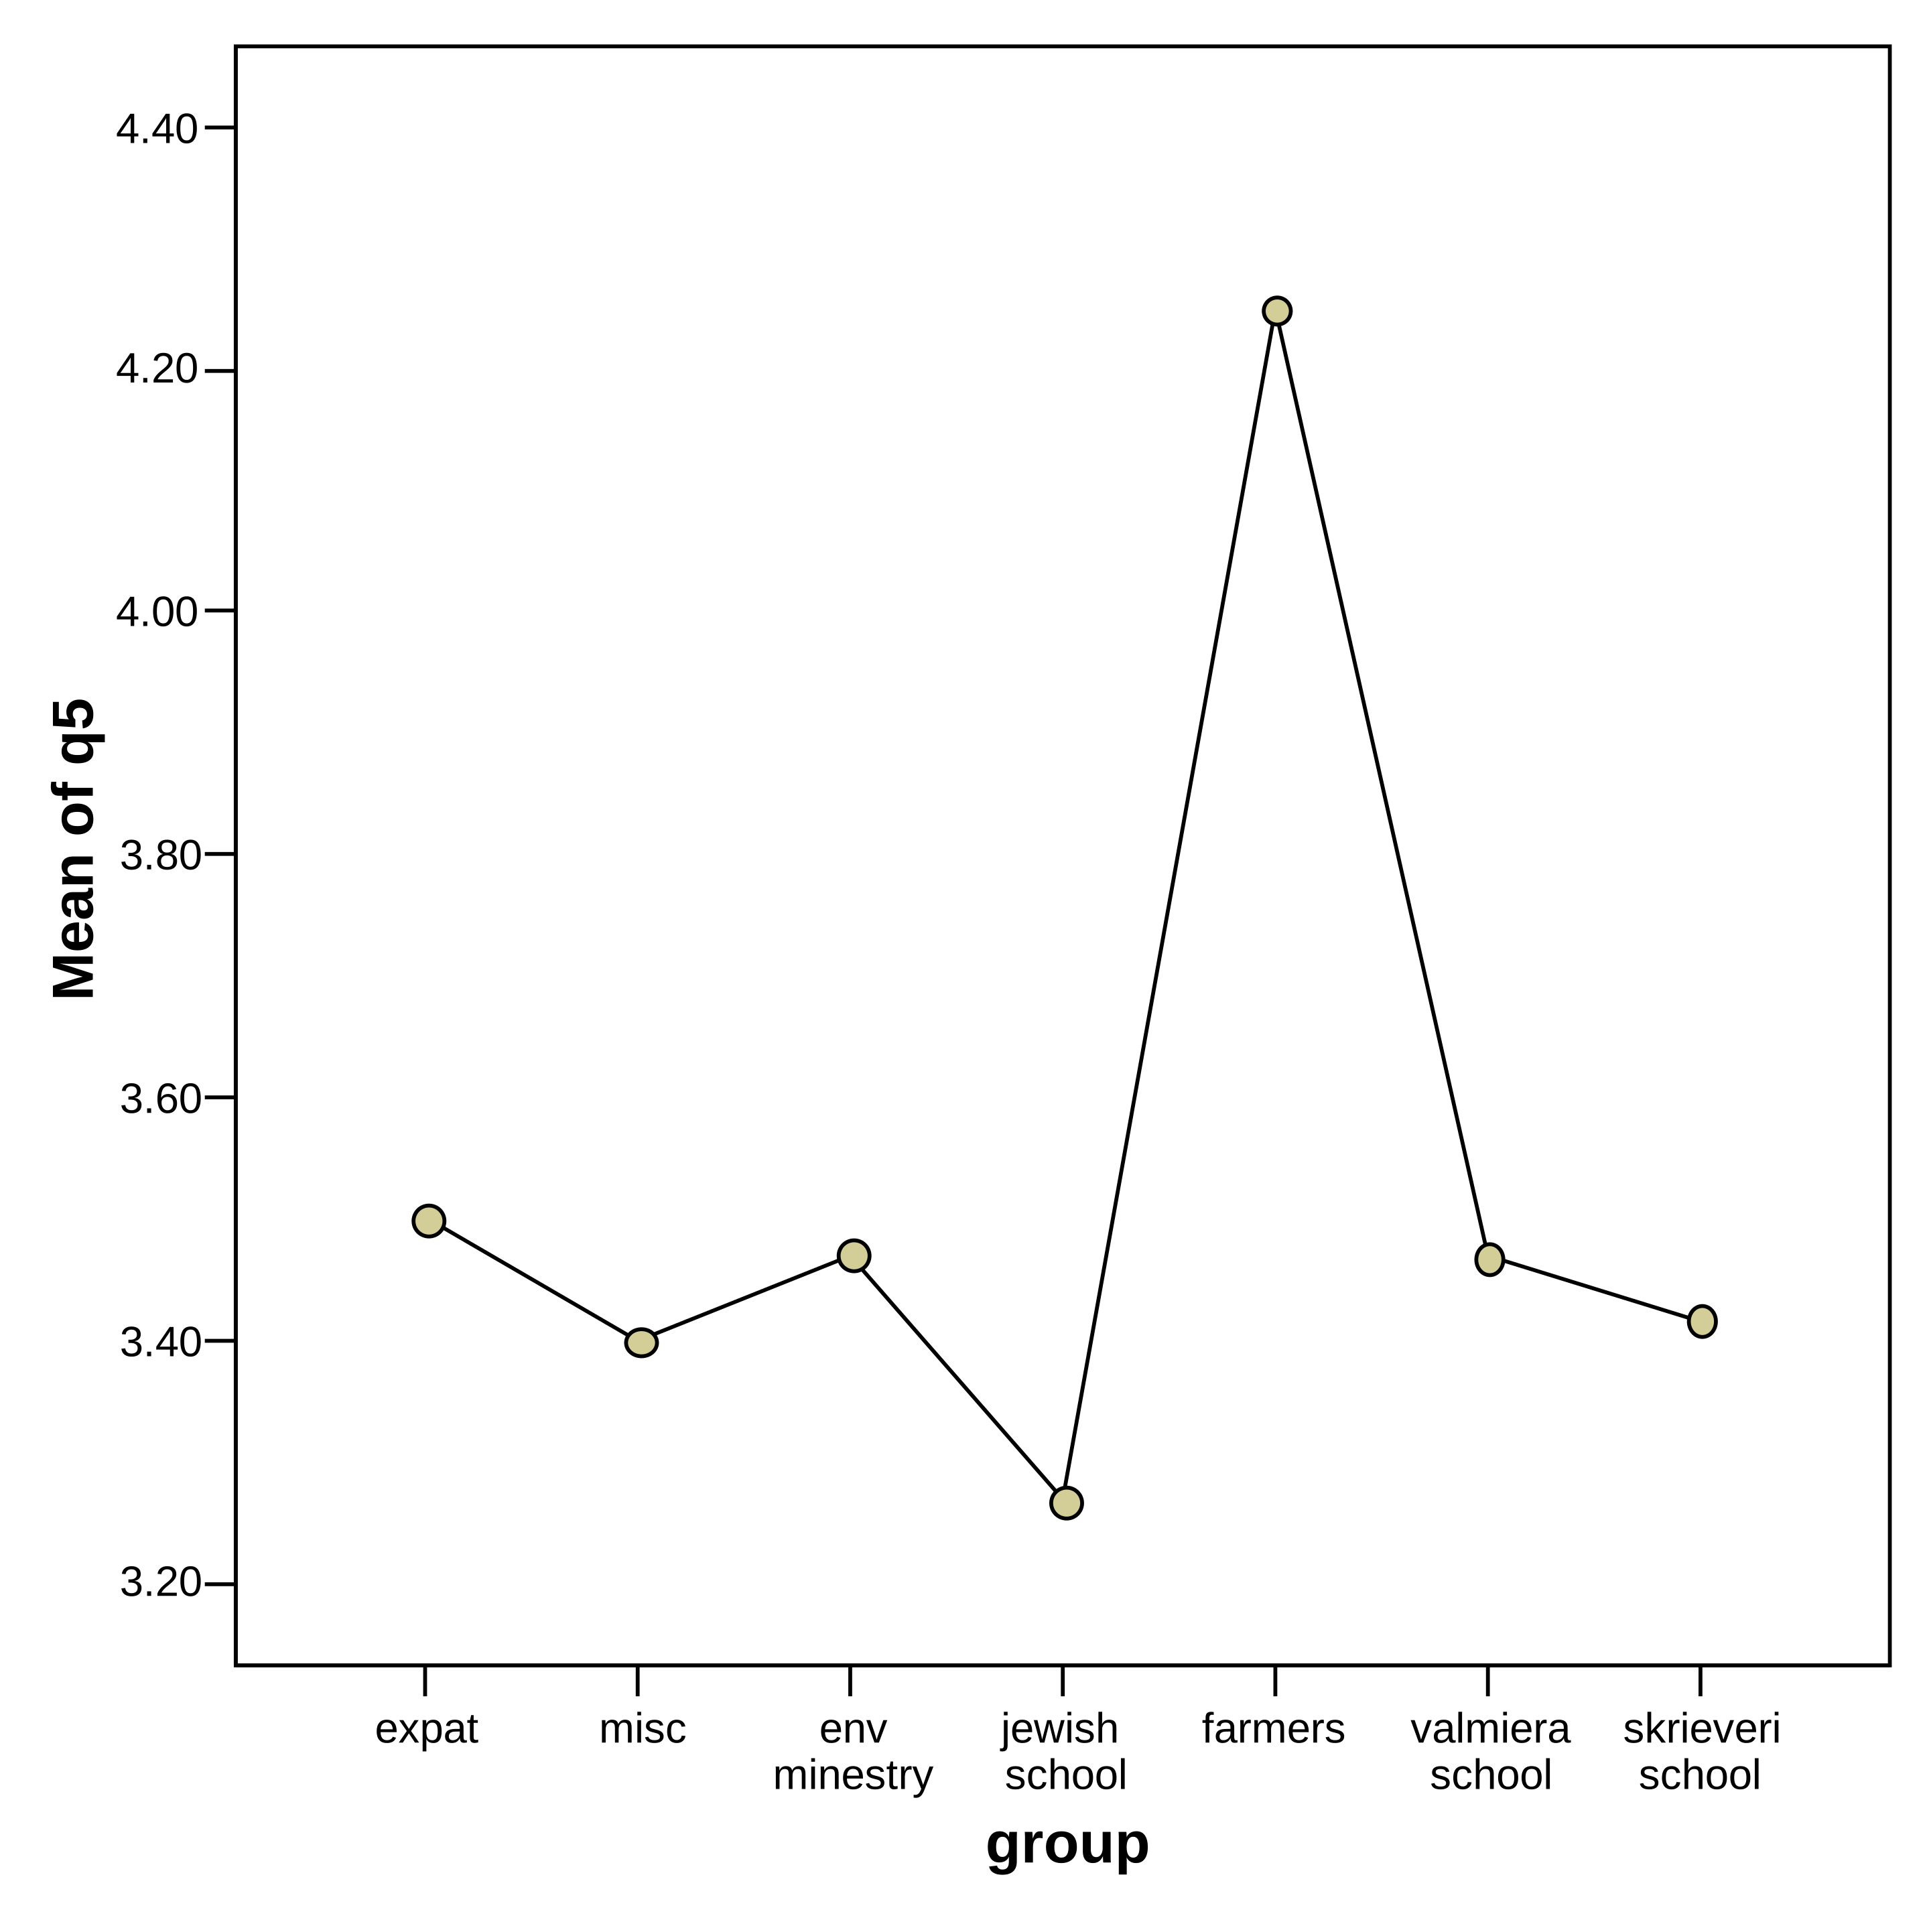
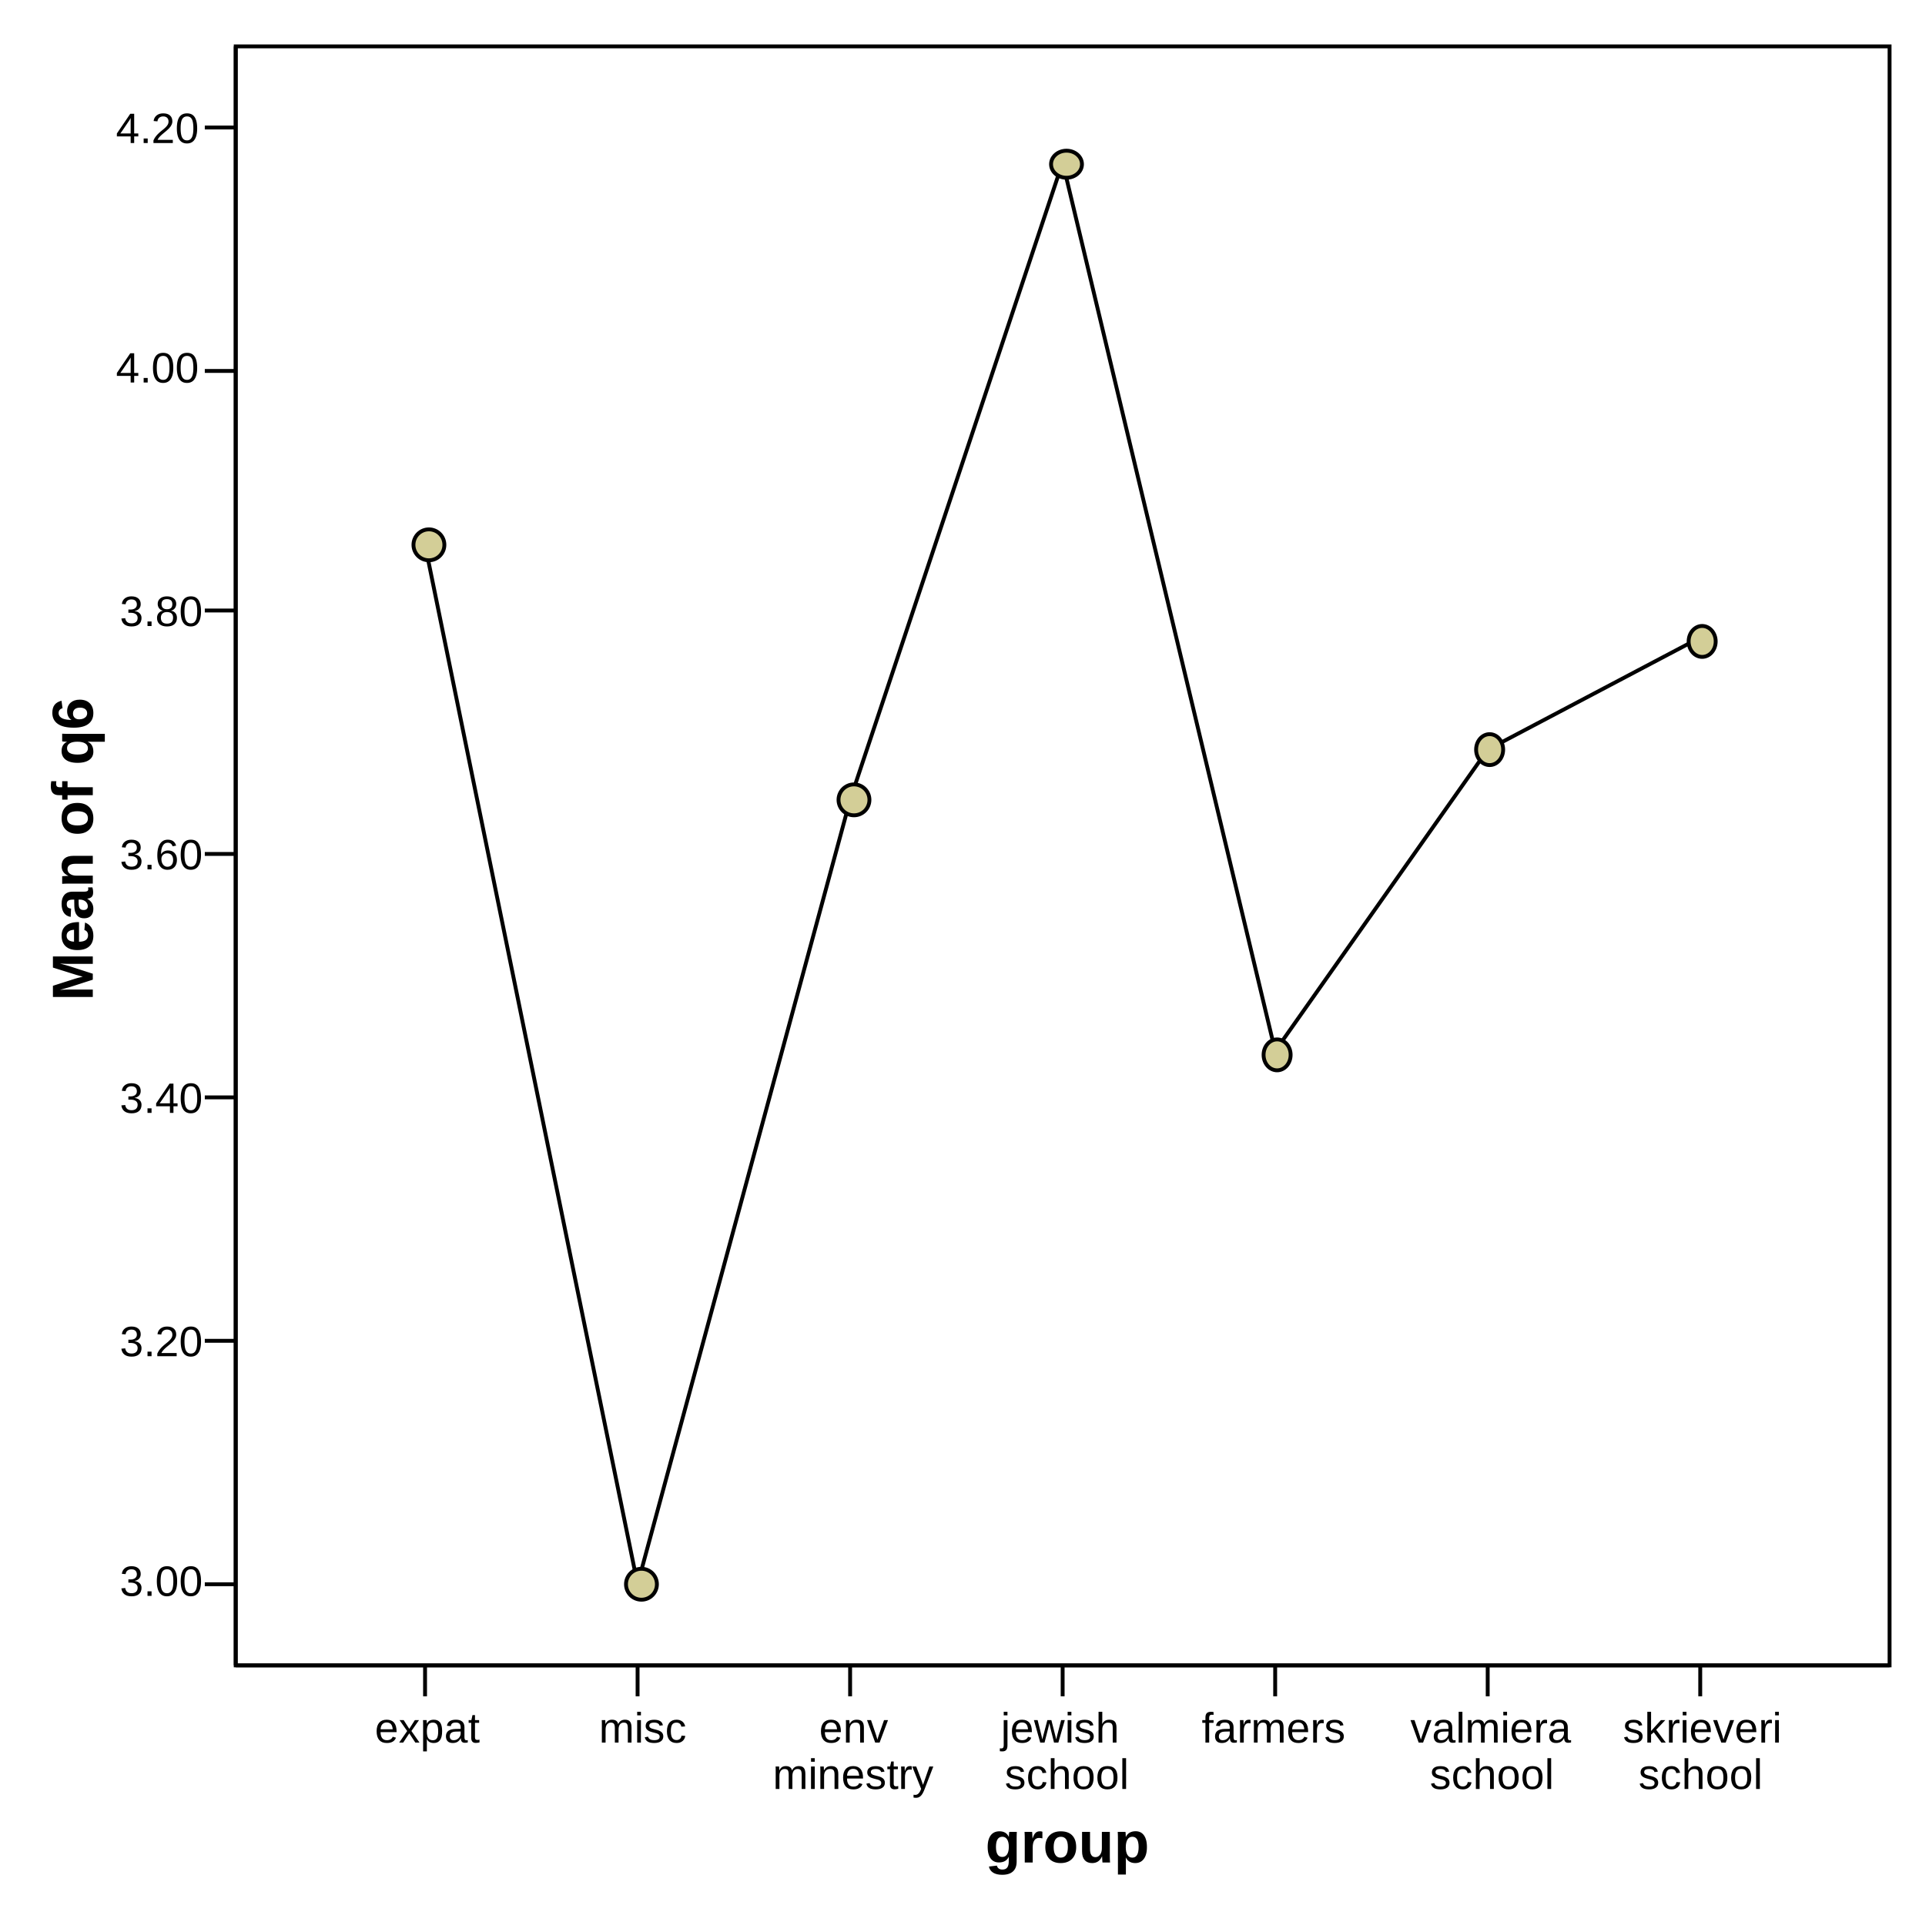
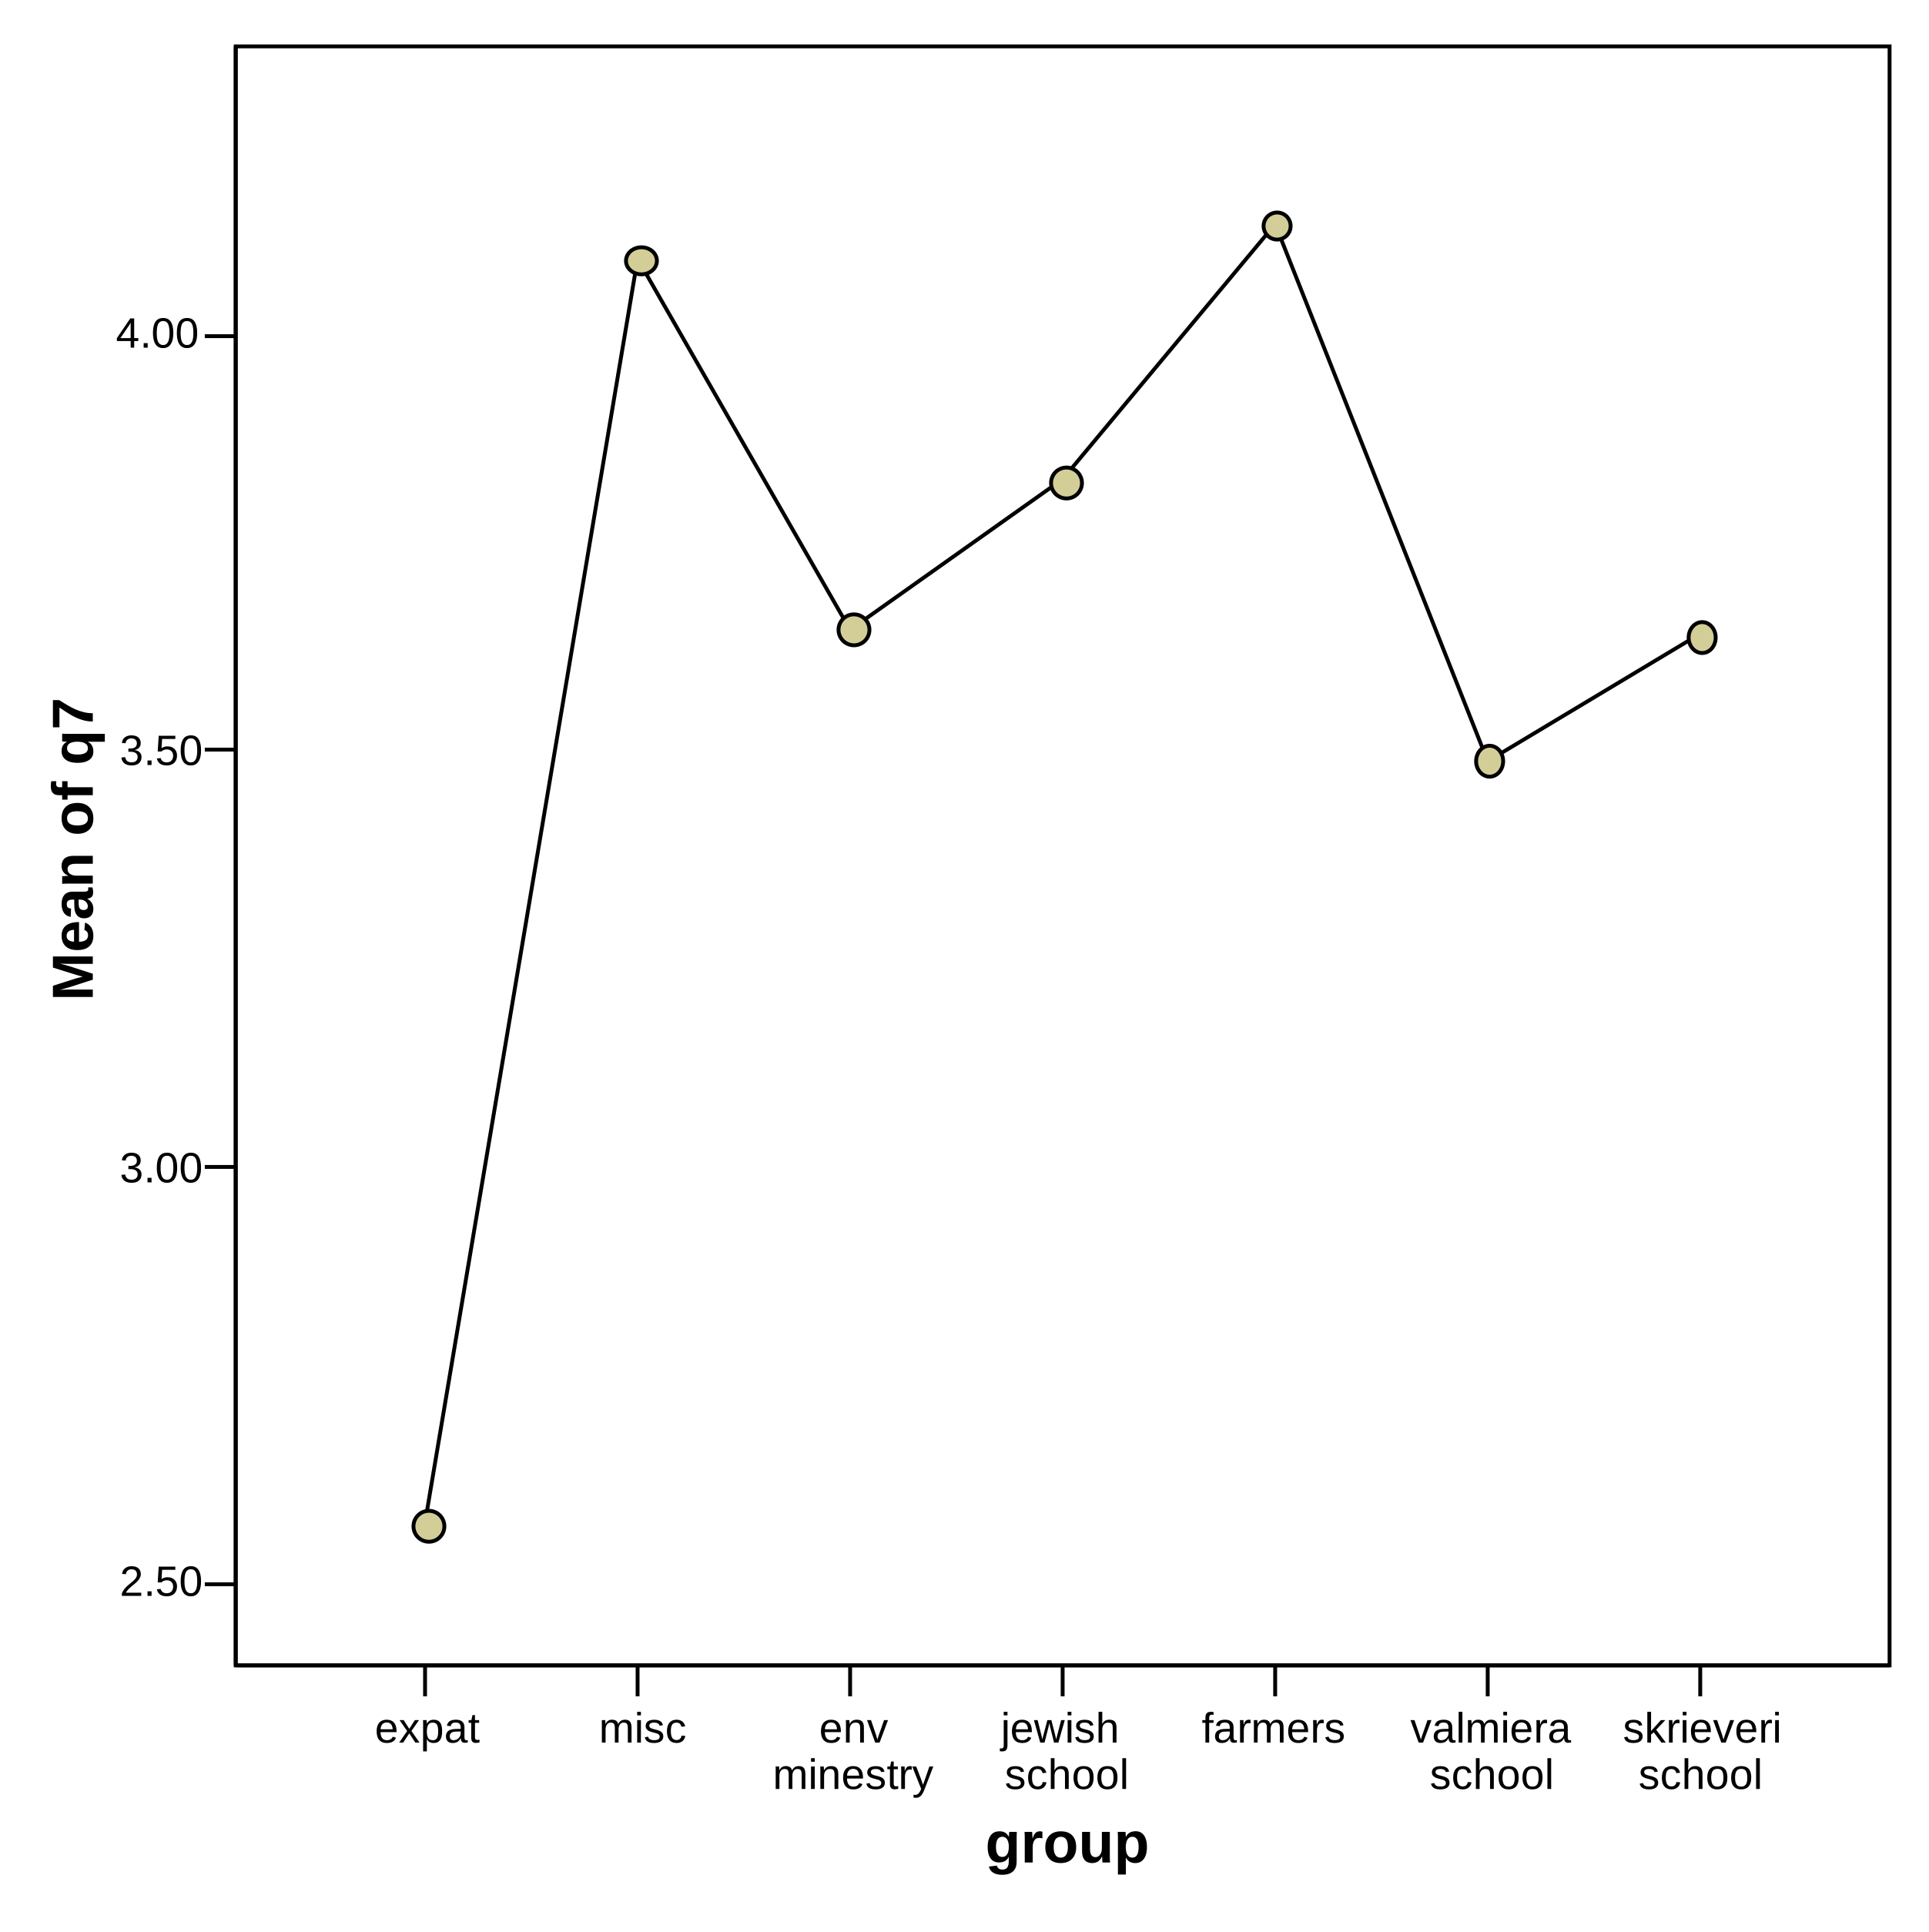
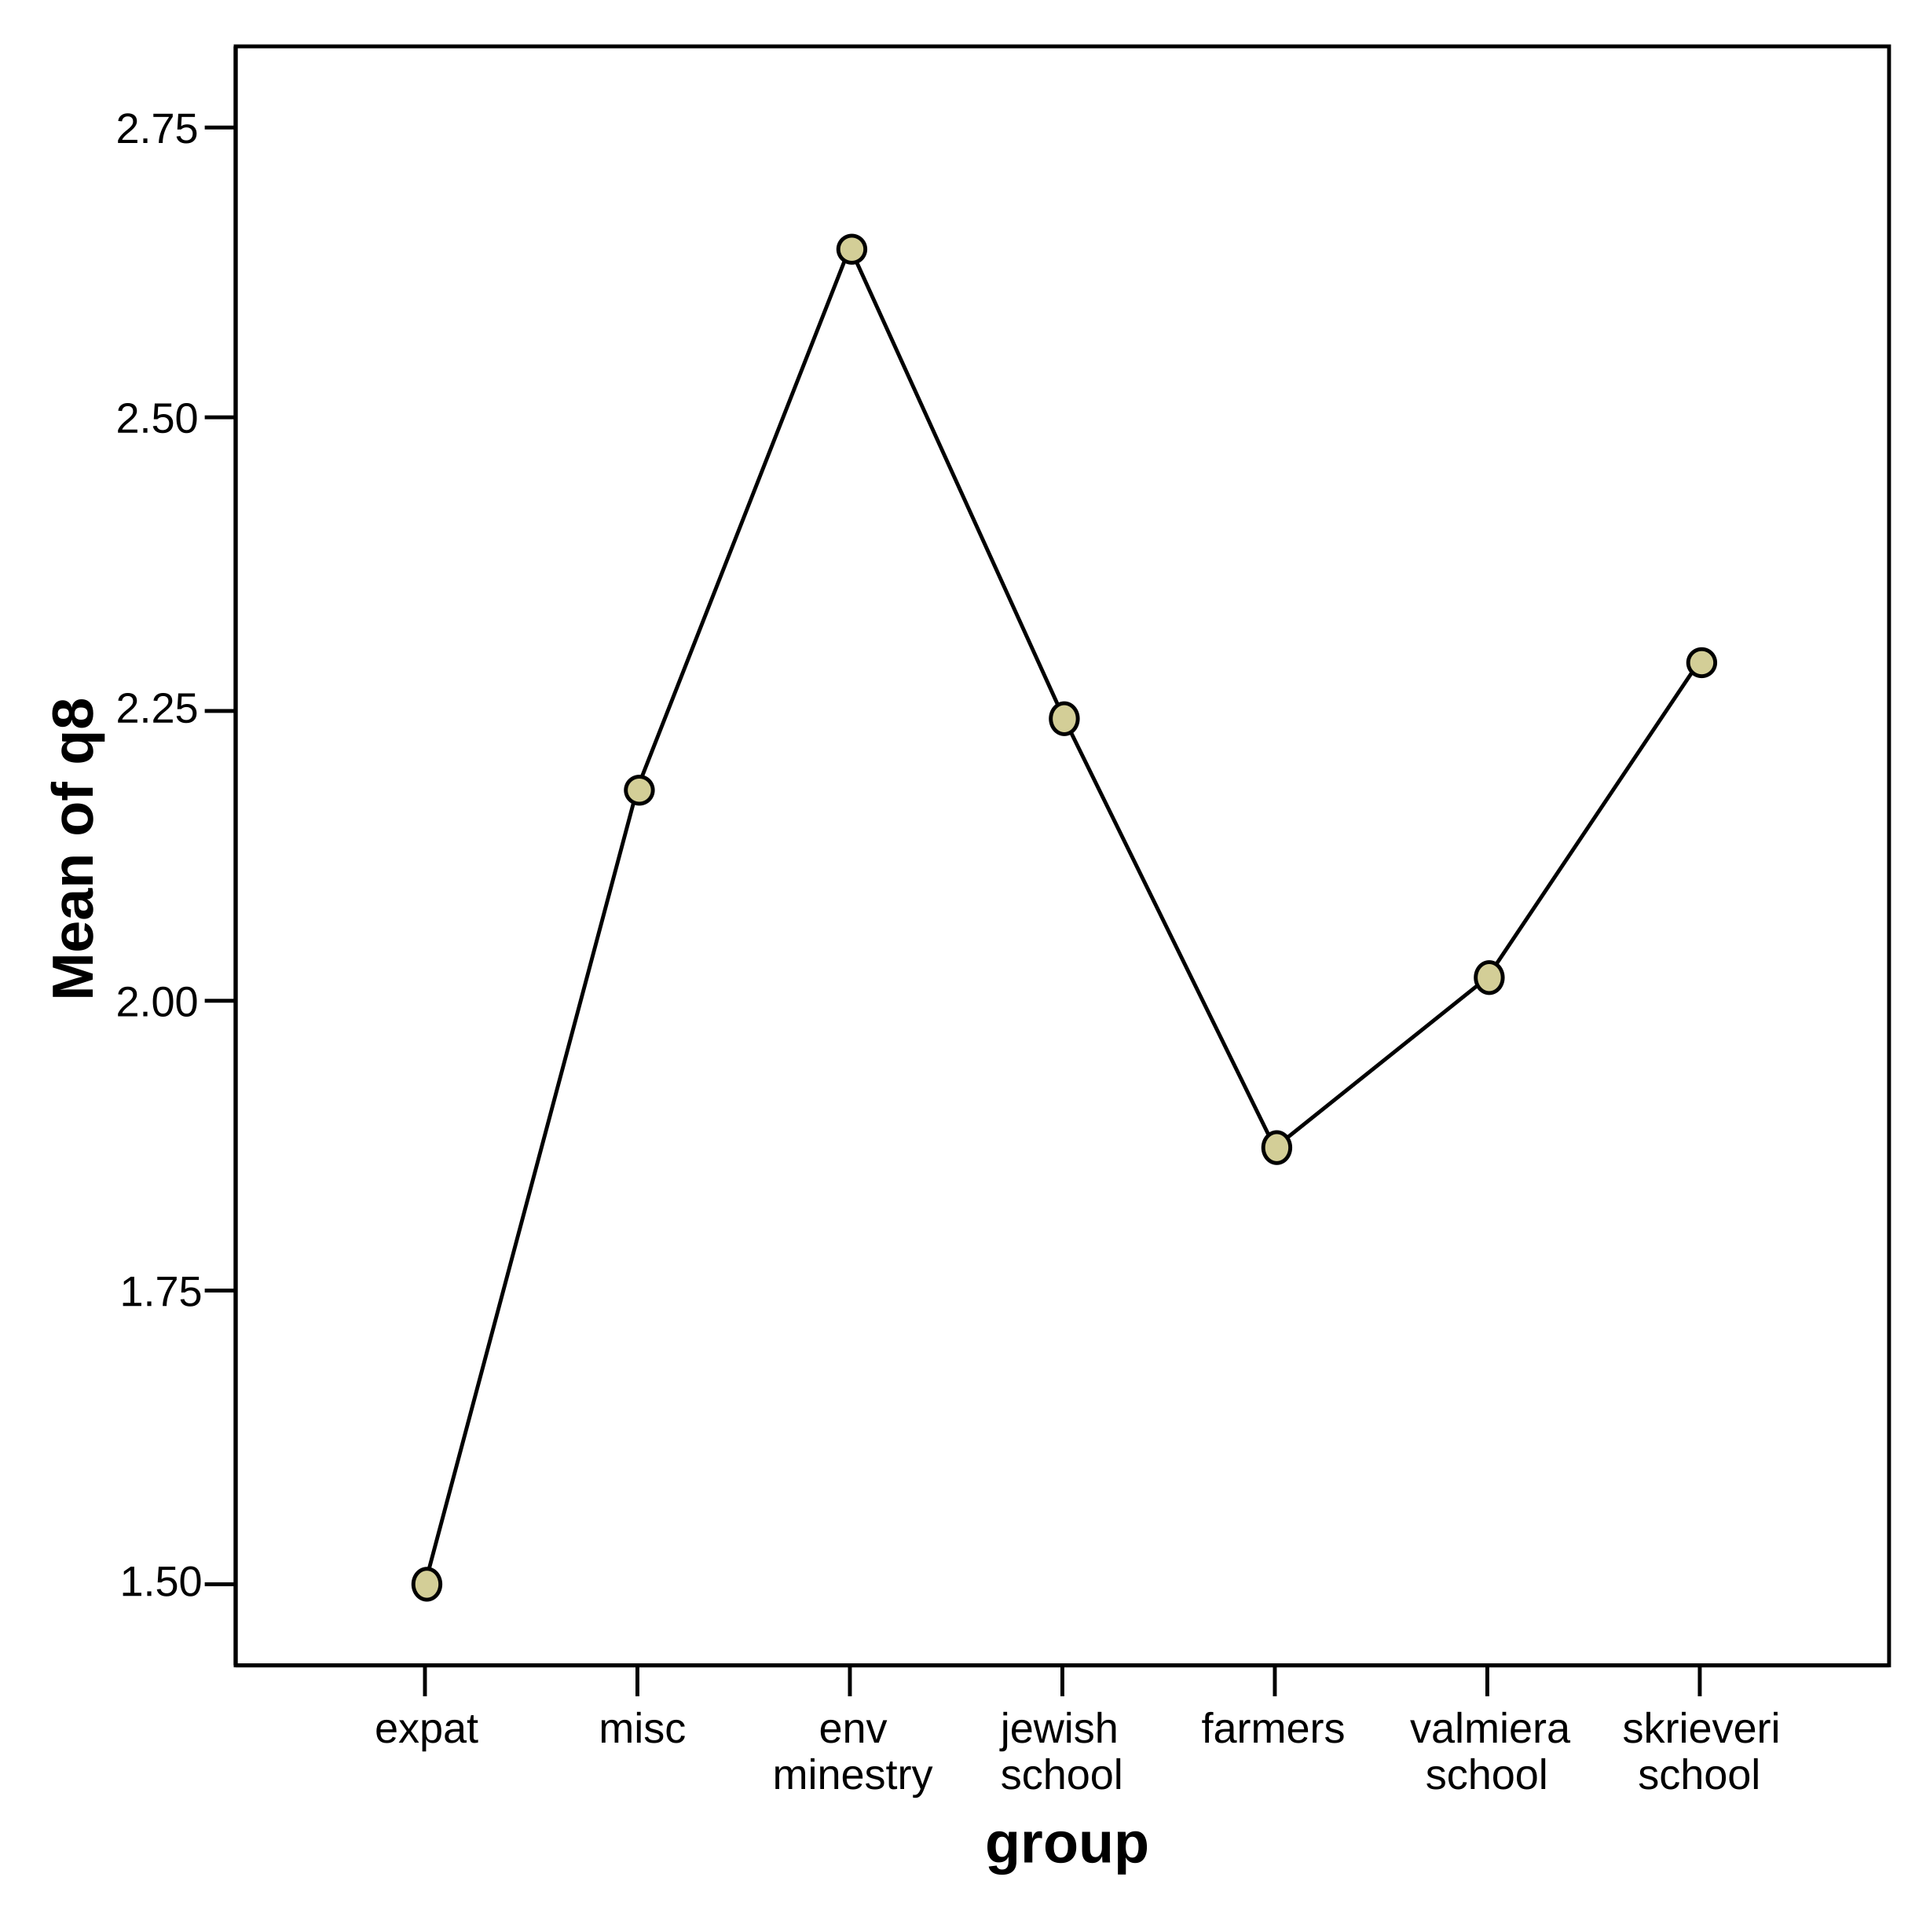
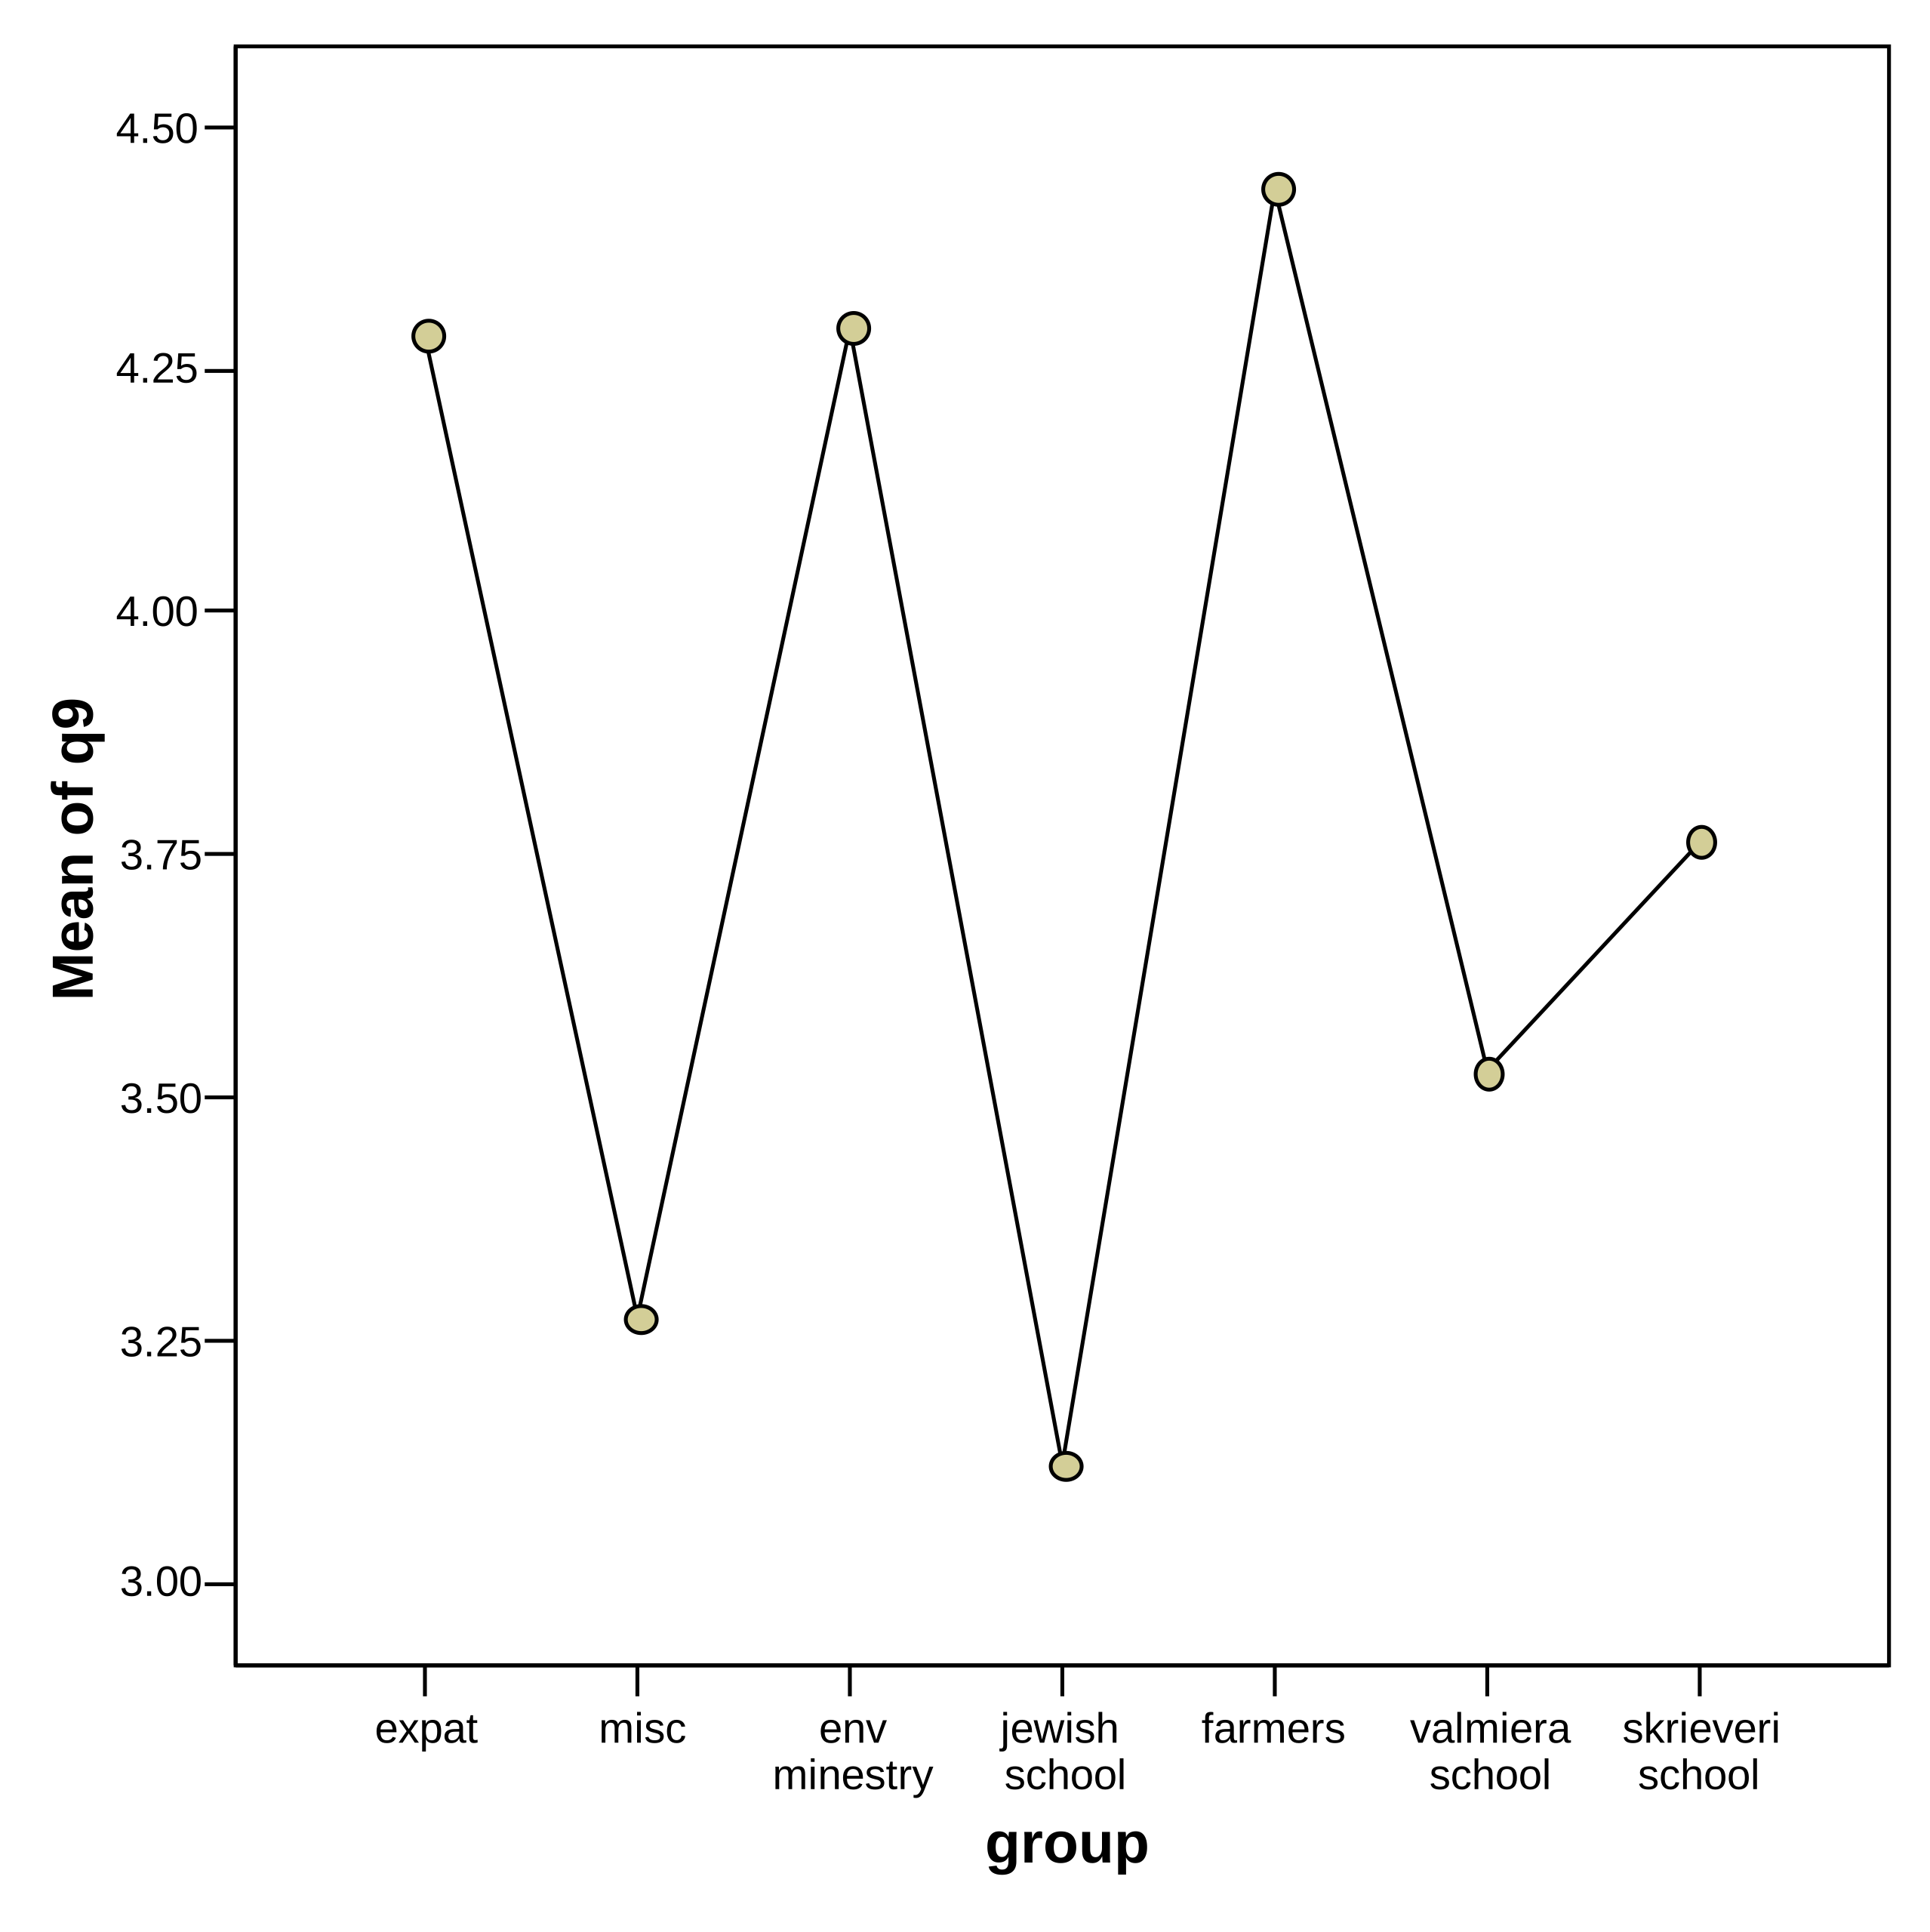
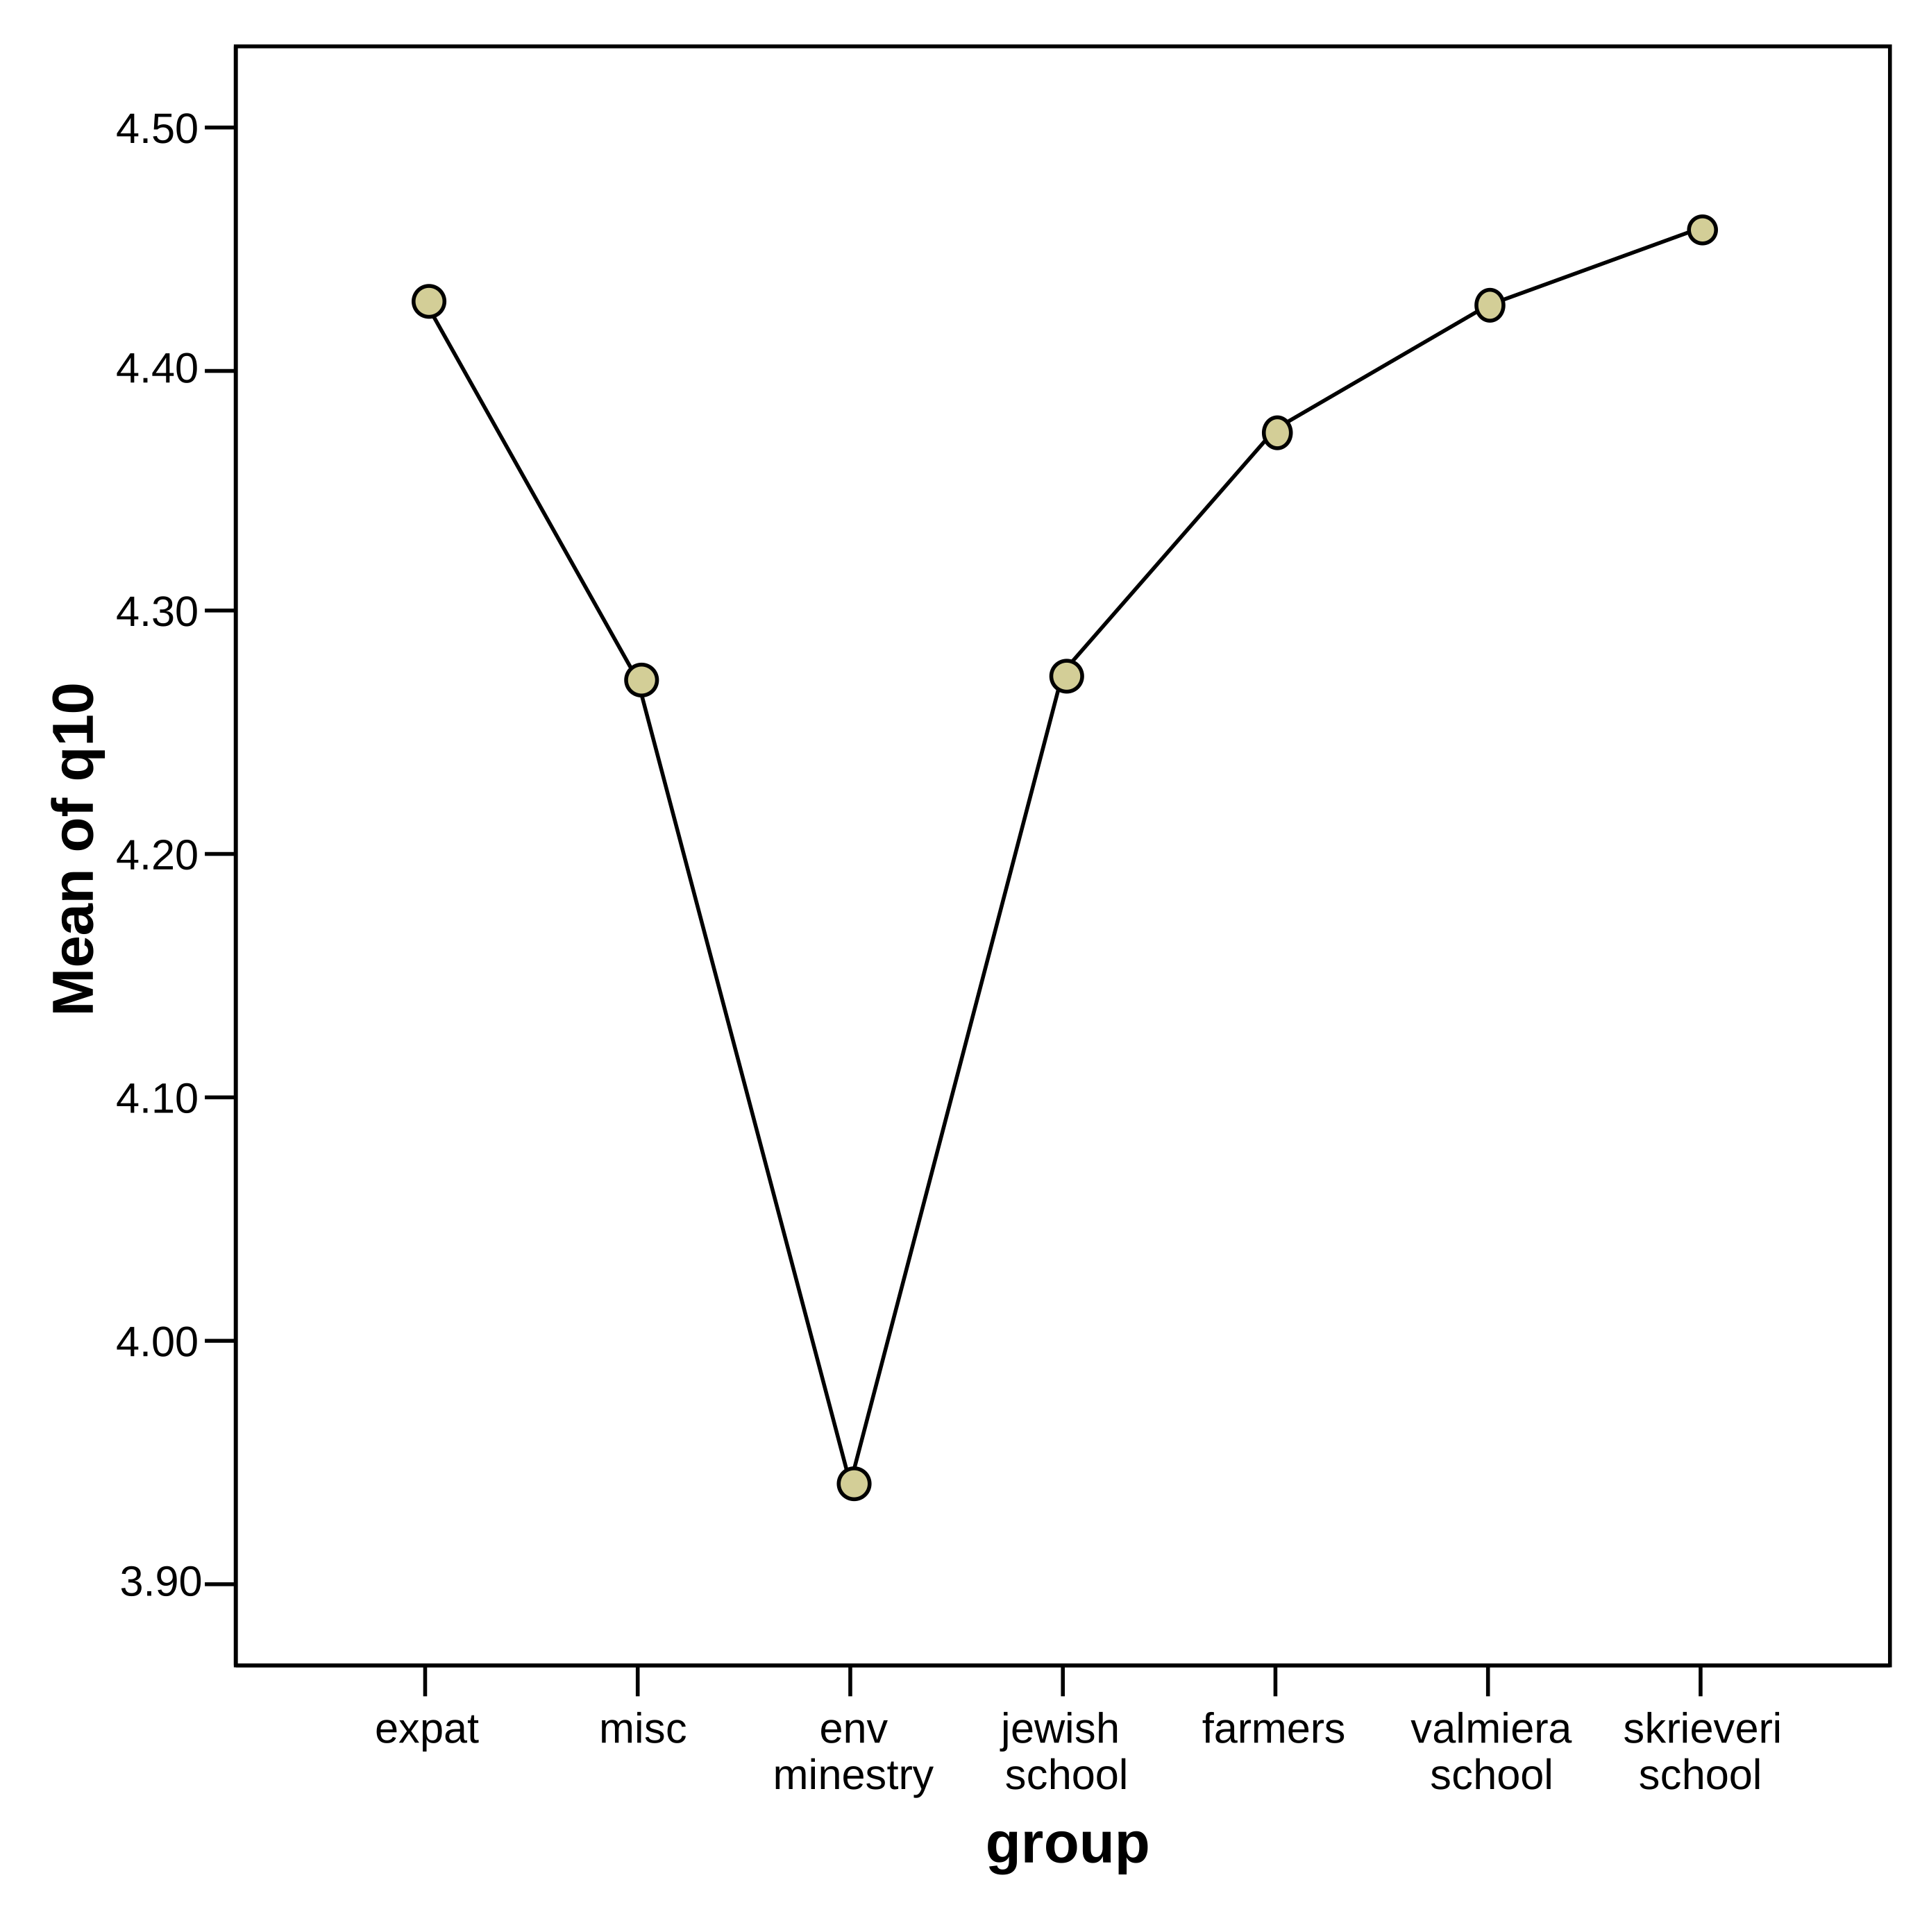
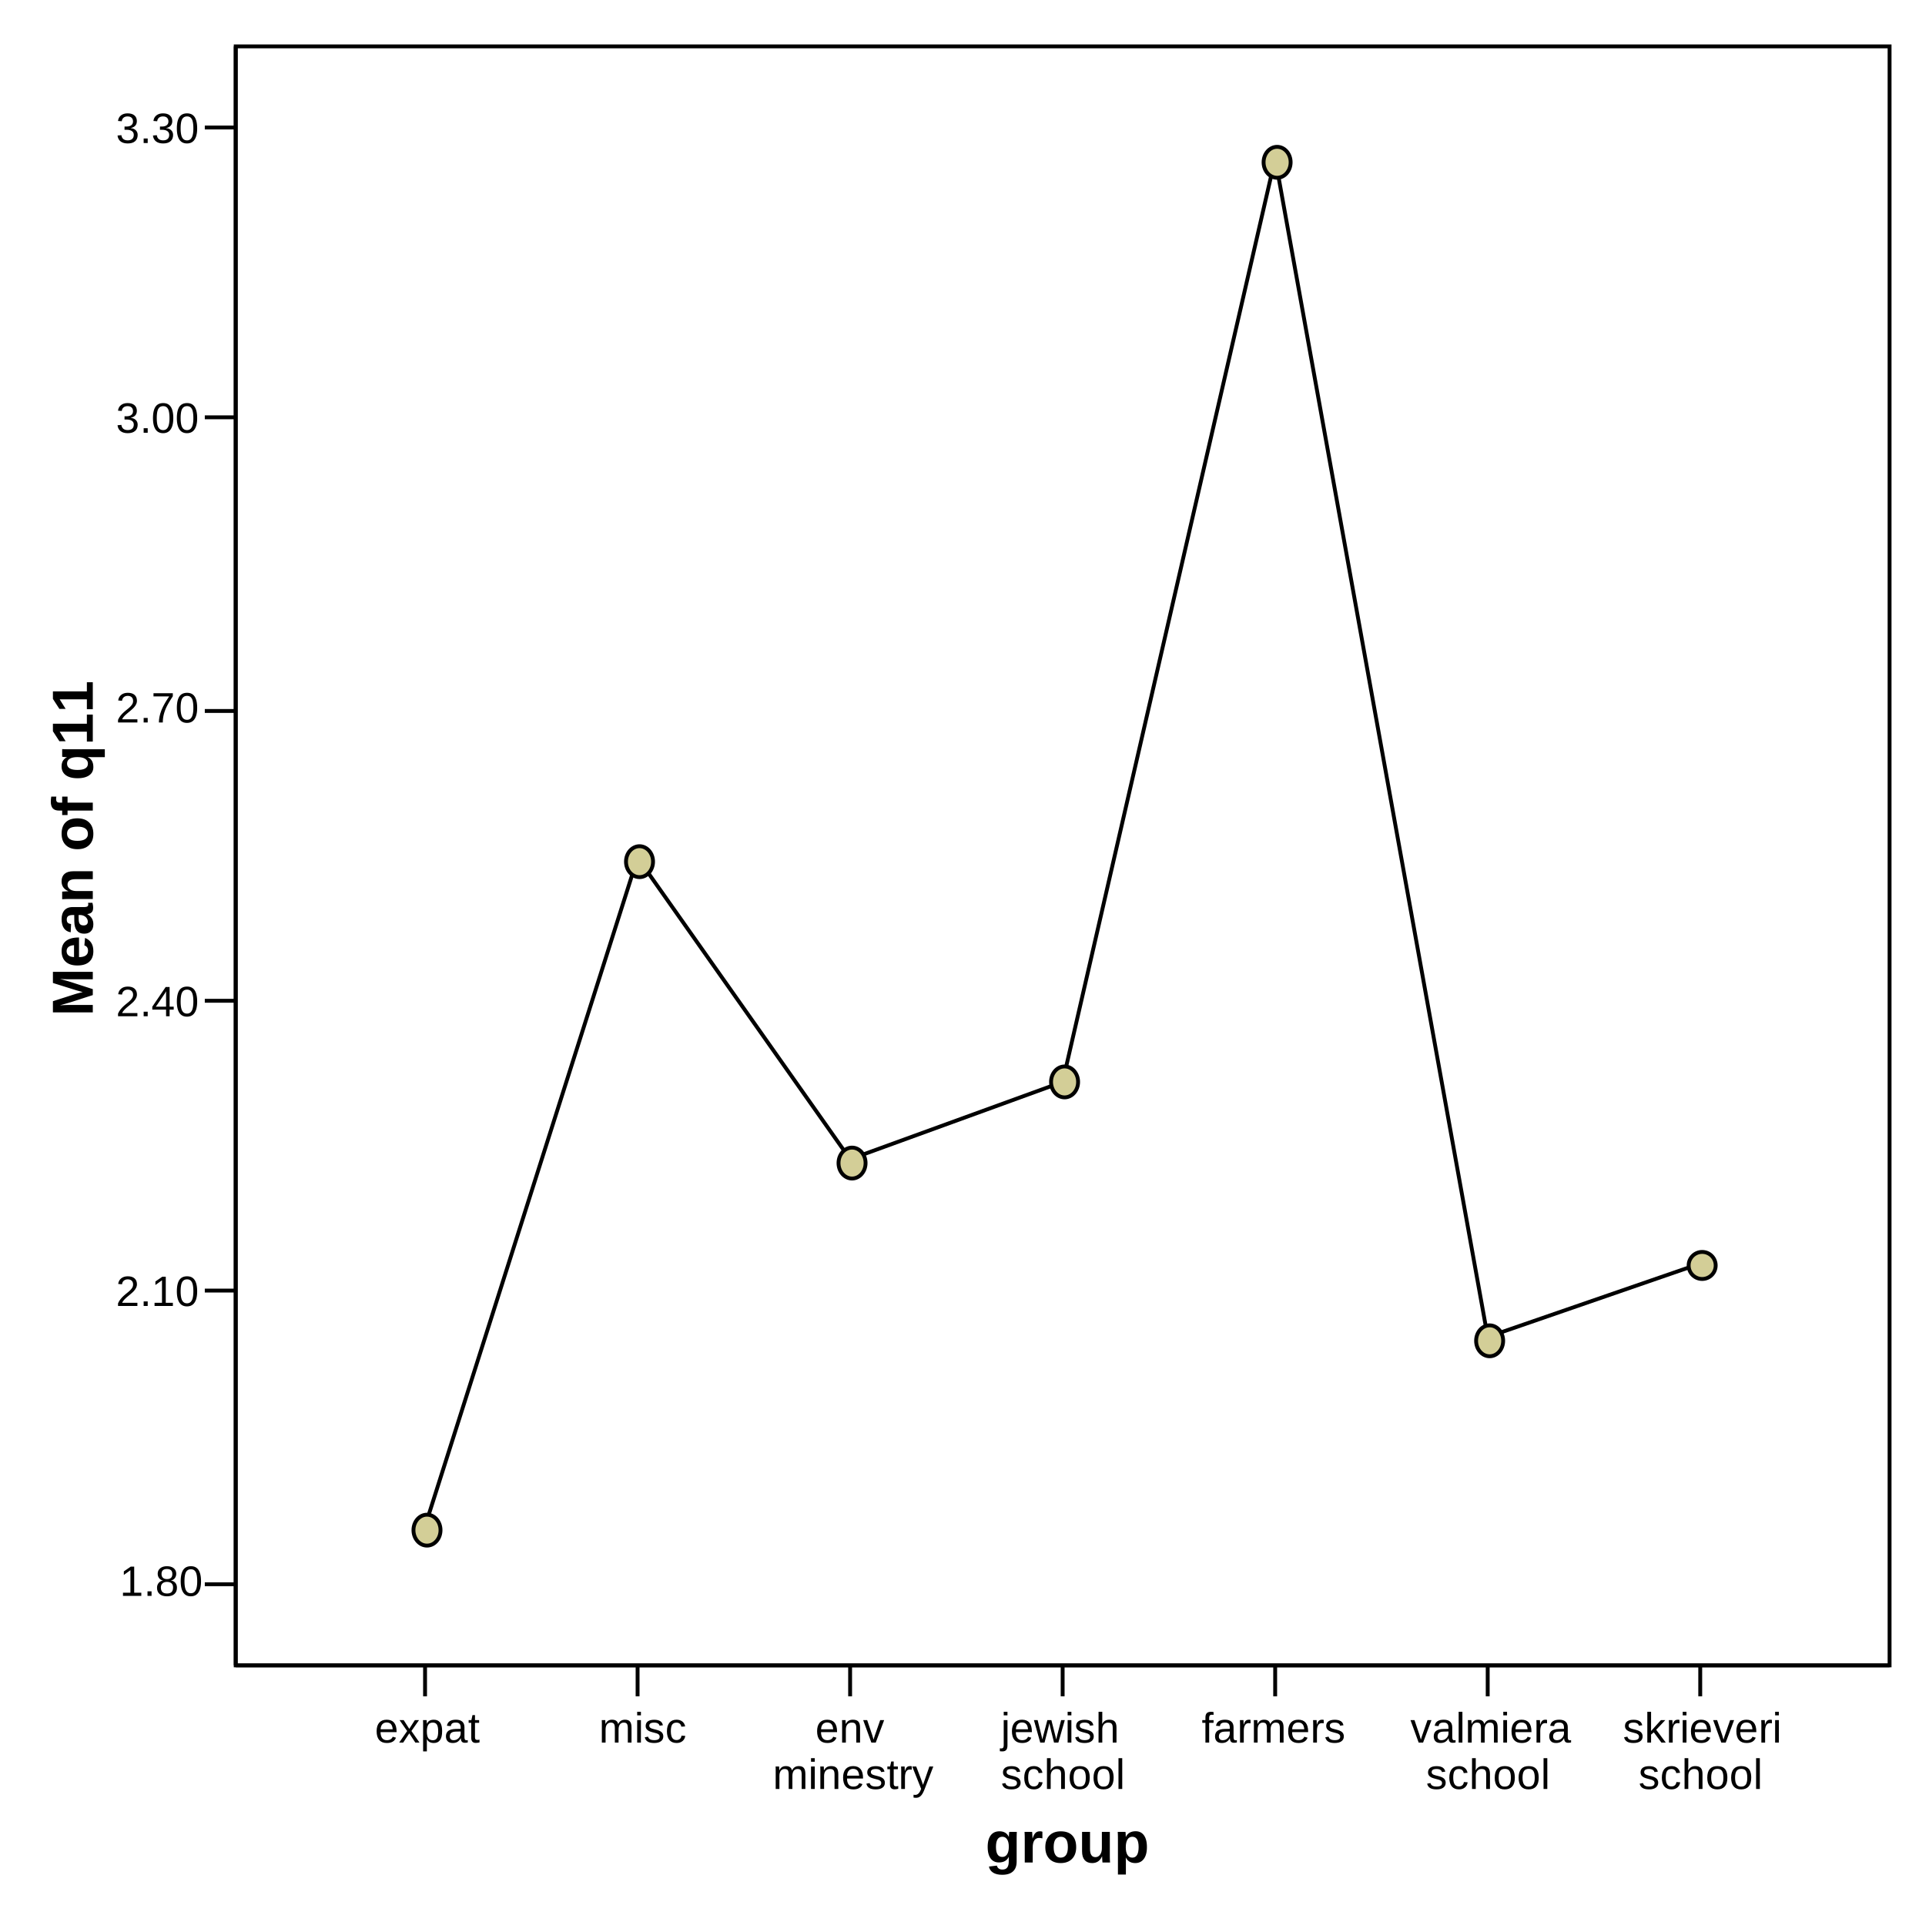
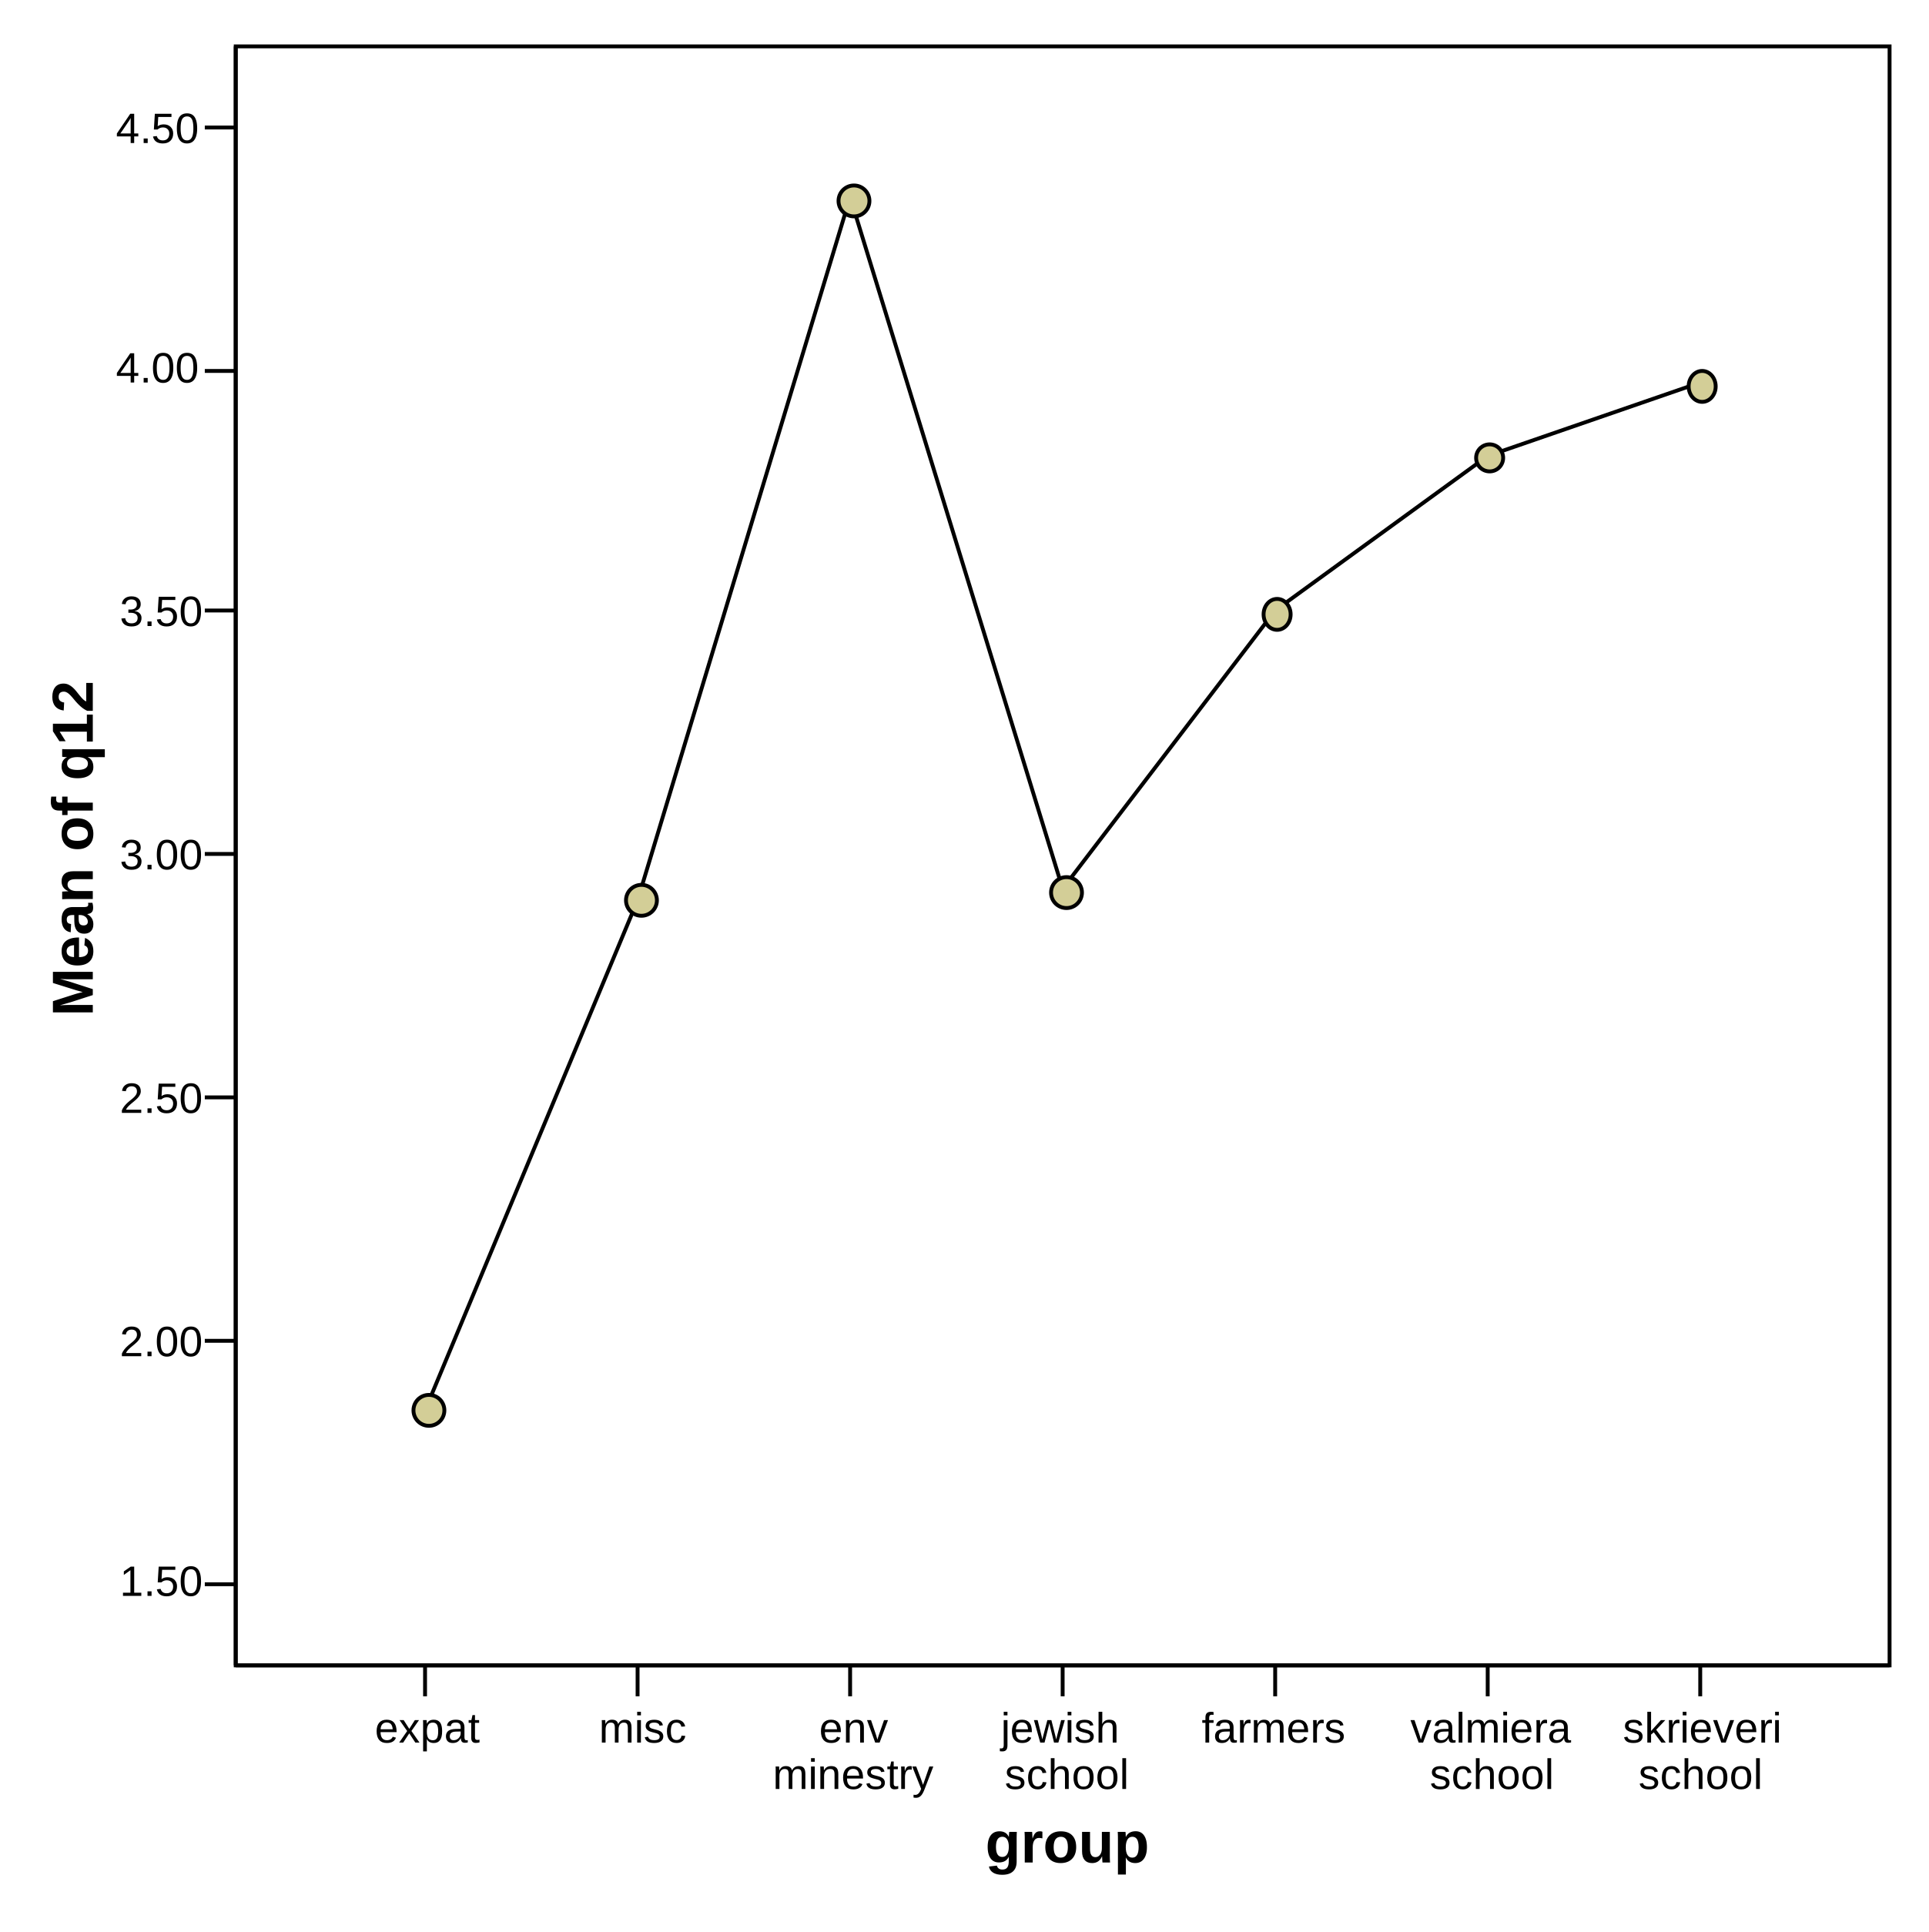
15 of them state their own number and title in their label text, and are placed first here in that order; the rest are named from their axes, which is how the chapters refer to them. Between them they are the Fiji reef composition series, the Belize mangrove and seagrass summaries, and the group means for every question in the Latvian survey.
These are the figures as submitted, reproduced without correction. Where a figure and the surviving data disagree, the re-opened data section says so and shows both.