Belize · Toledo District
Port Honduras, July and August 1994.
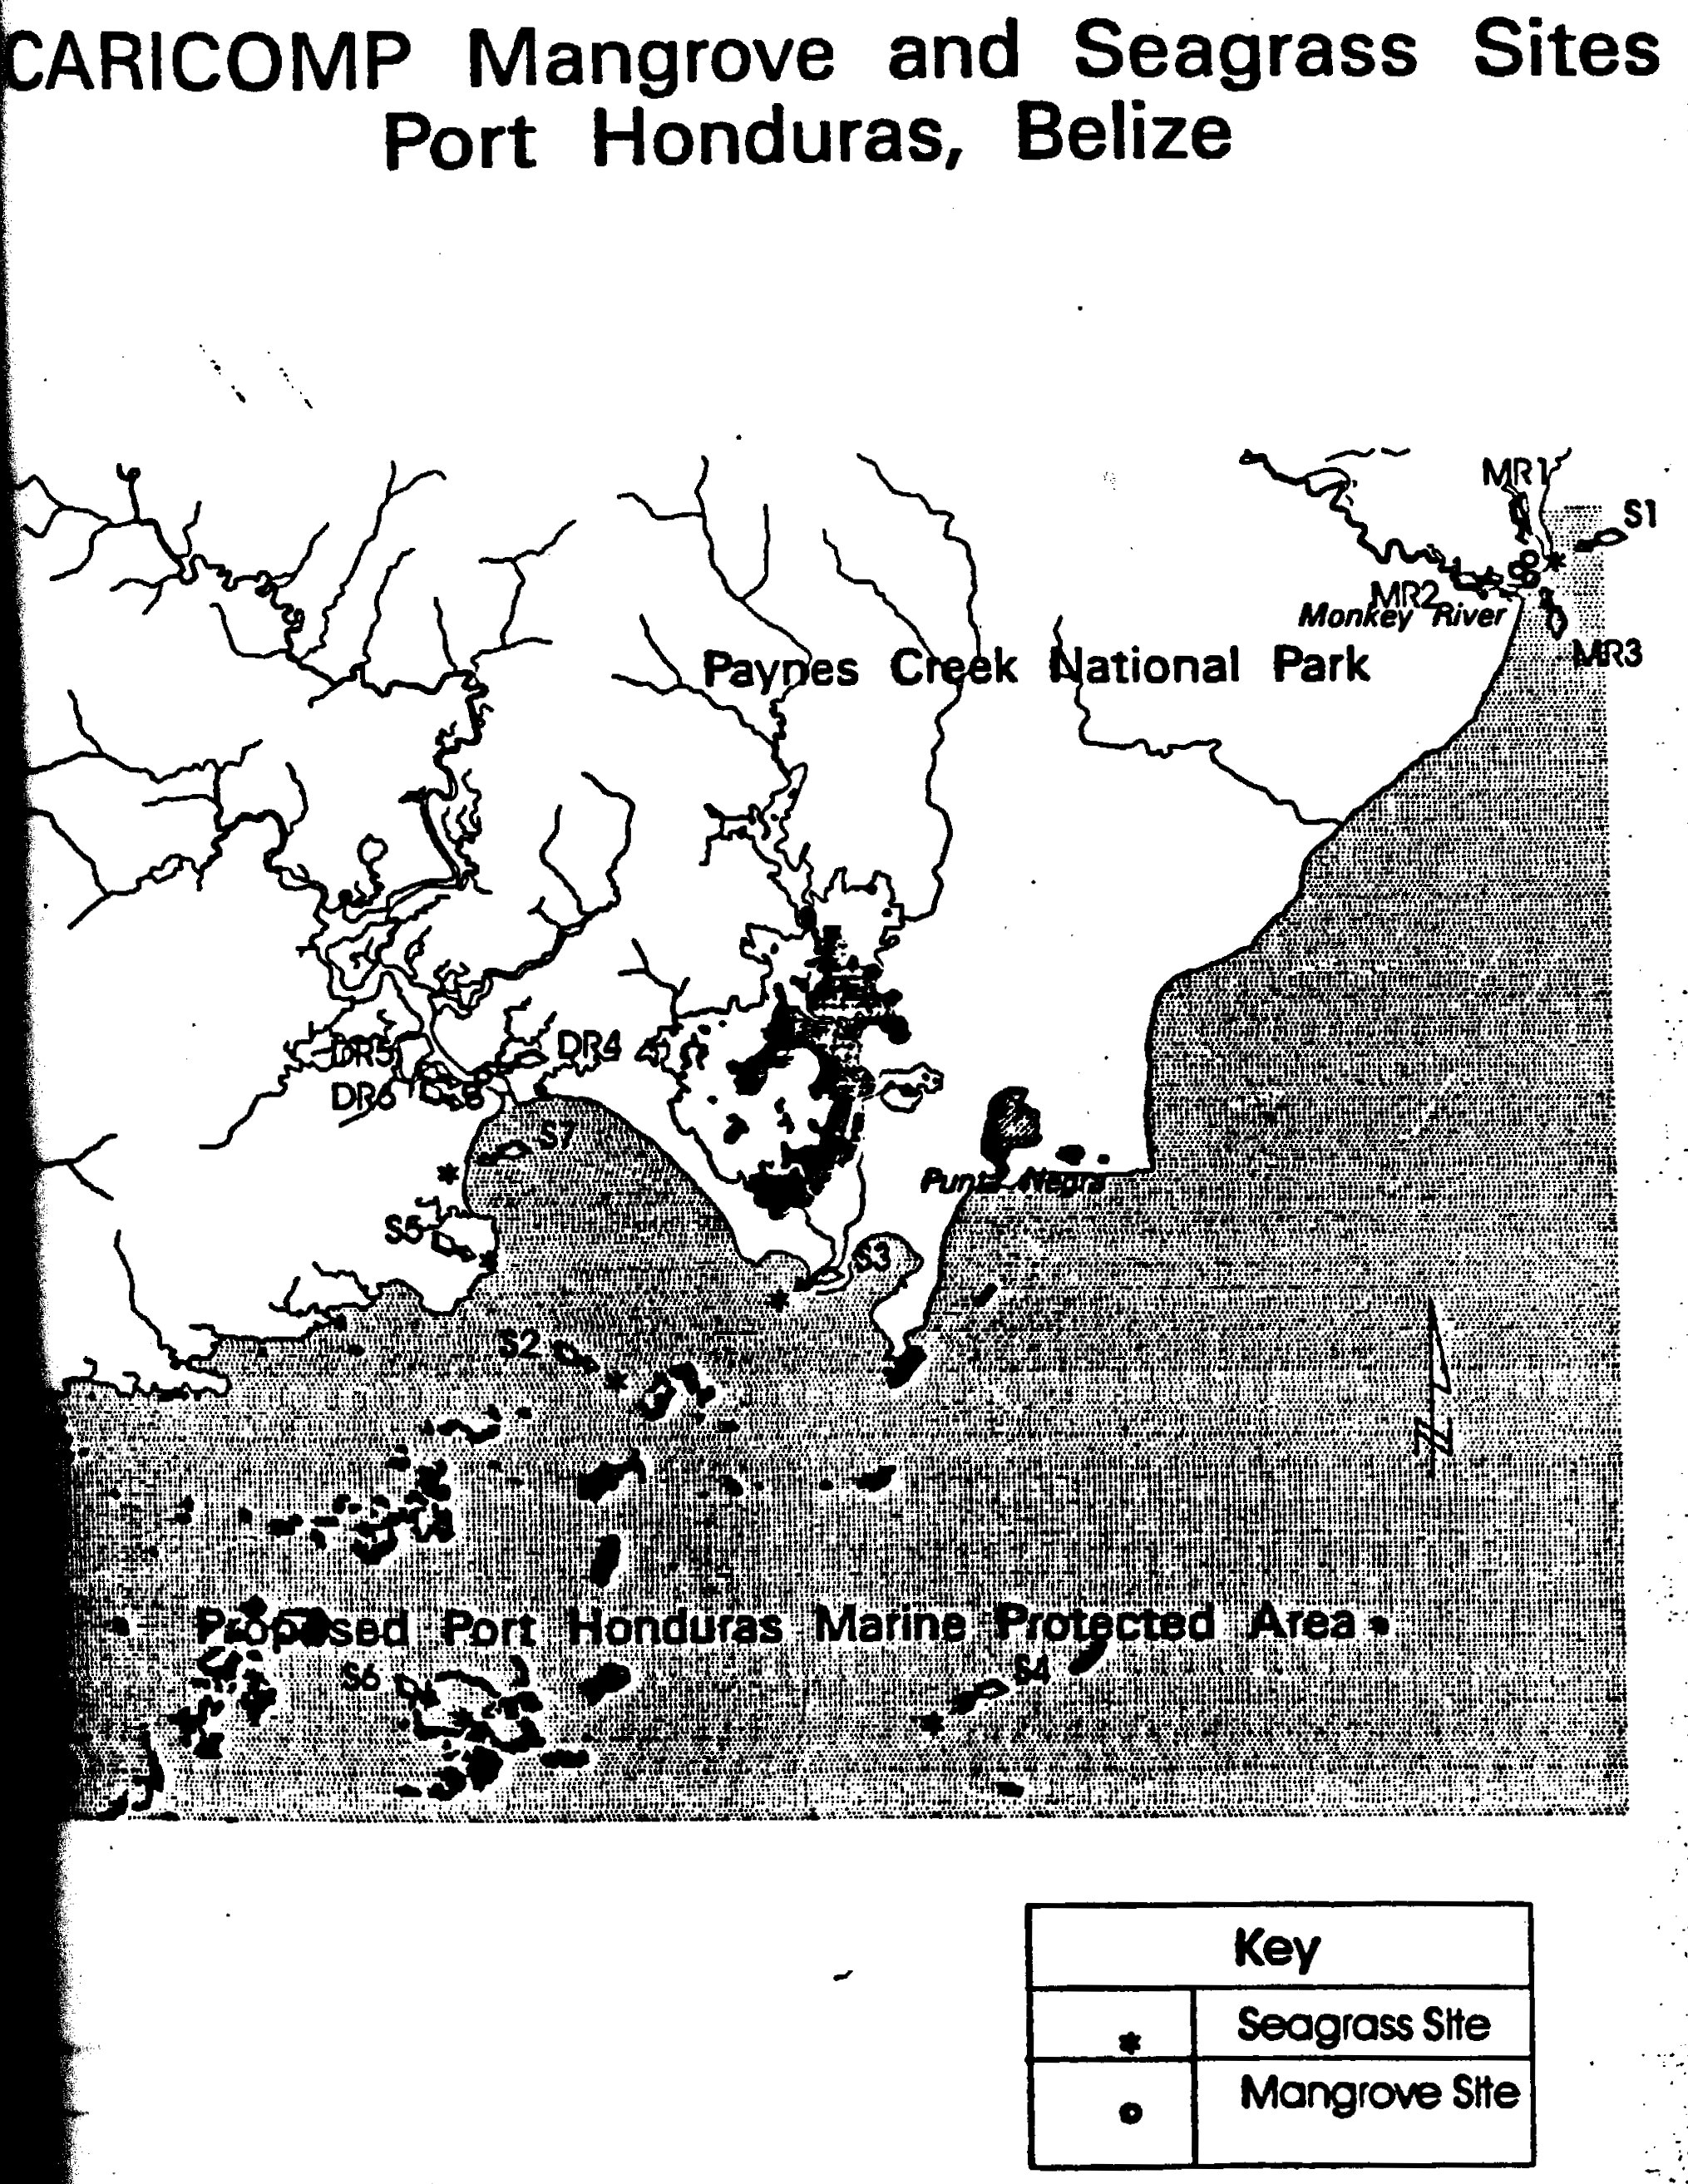
In July and August 1994, working with the Belize Center for Environmental Studies, I tagged and measured 69 red mangrove stems across six plots at two river mouths and sampled seven seagrass stations across the bay between them. The hypothesis was one sentence long: nutrient from mangroves is carried by rivers to sea, benefiting seagrass.
I wrote it up explicitly as a baseline to guide initial management planning for a marine protected area that did not yet exist. That area was declared on 25 January 2000. Twenty months later a Category 4 hurricane came ashore in the vicinity of Monkey River Town, which is to say at my study site.
Since then the mangrove inside the reserve has not changed at all, the seagrass at a reference site inside it has collapsed, the village has lost up to a hundred metres of shore, and the monitoring that would have told us why stopped in 2015 for lack of money.
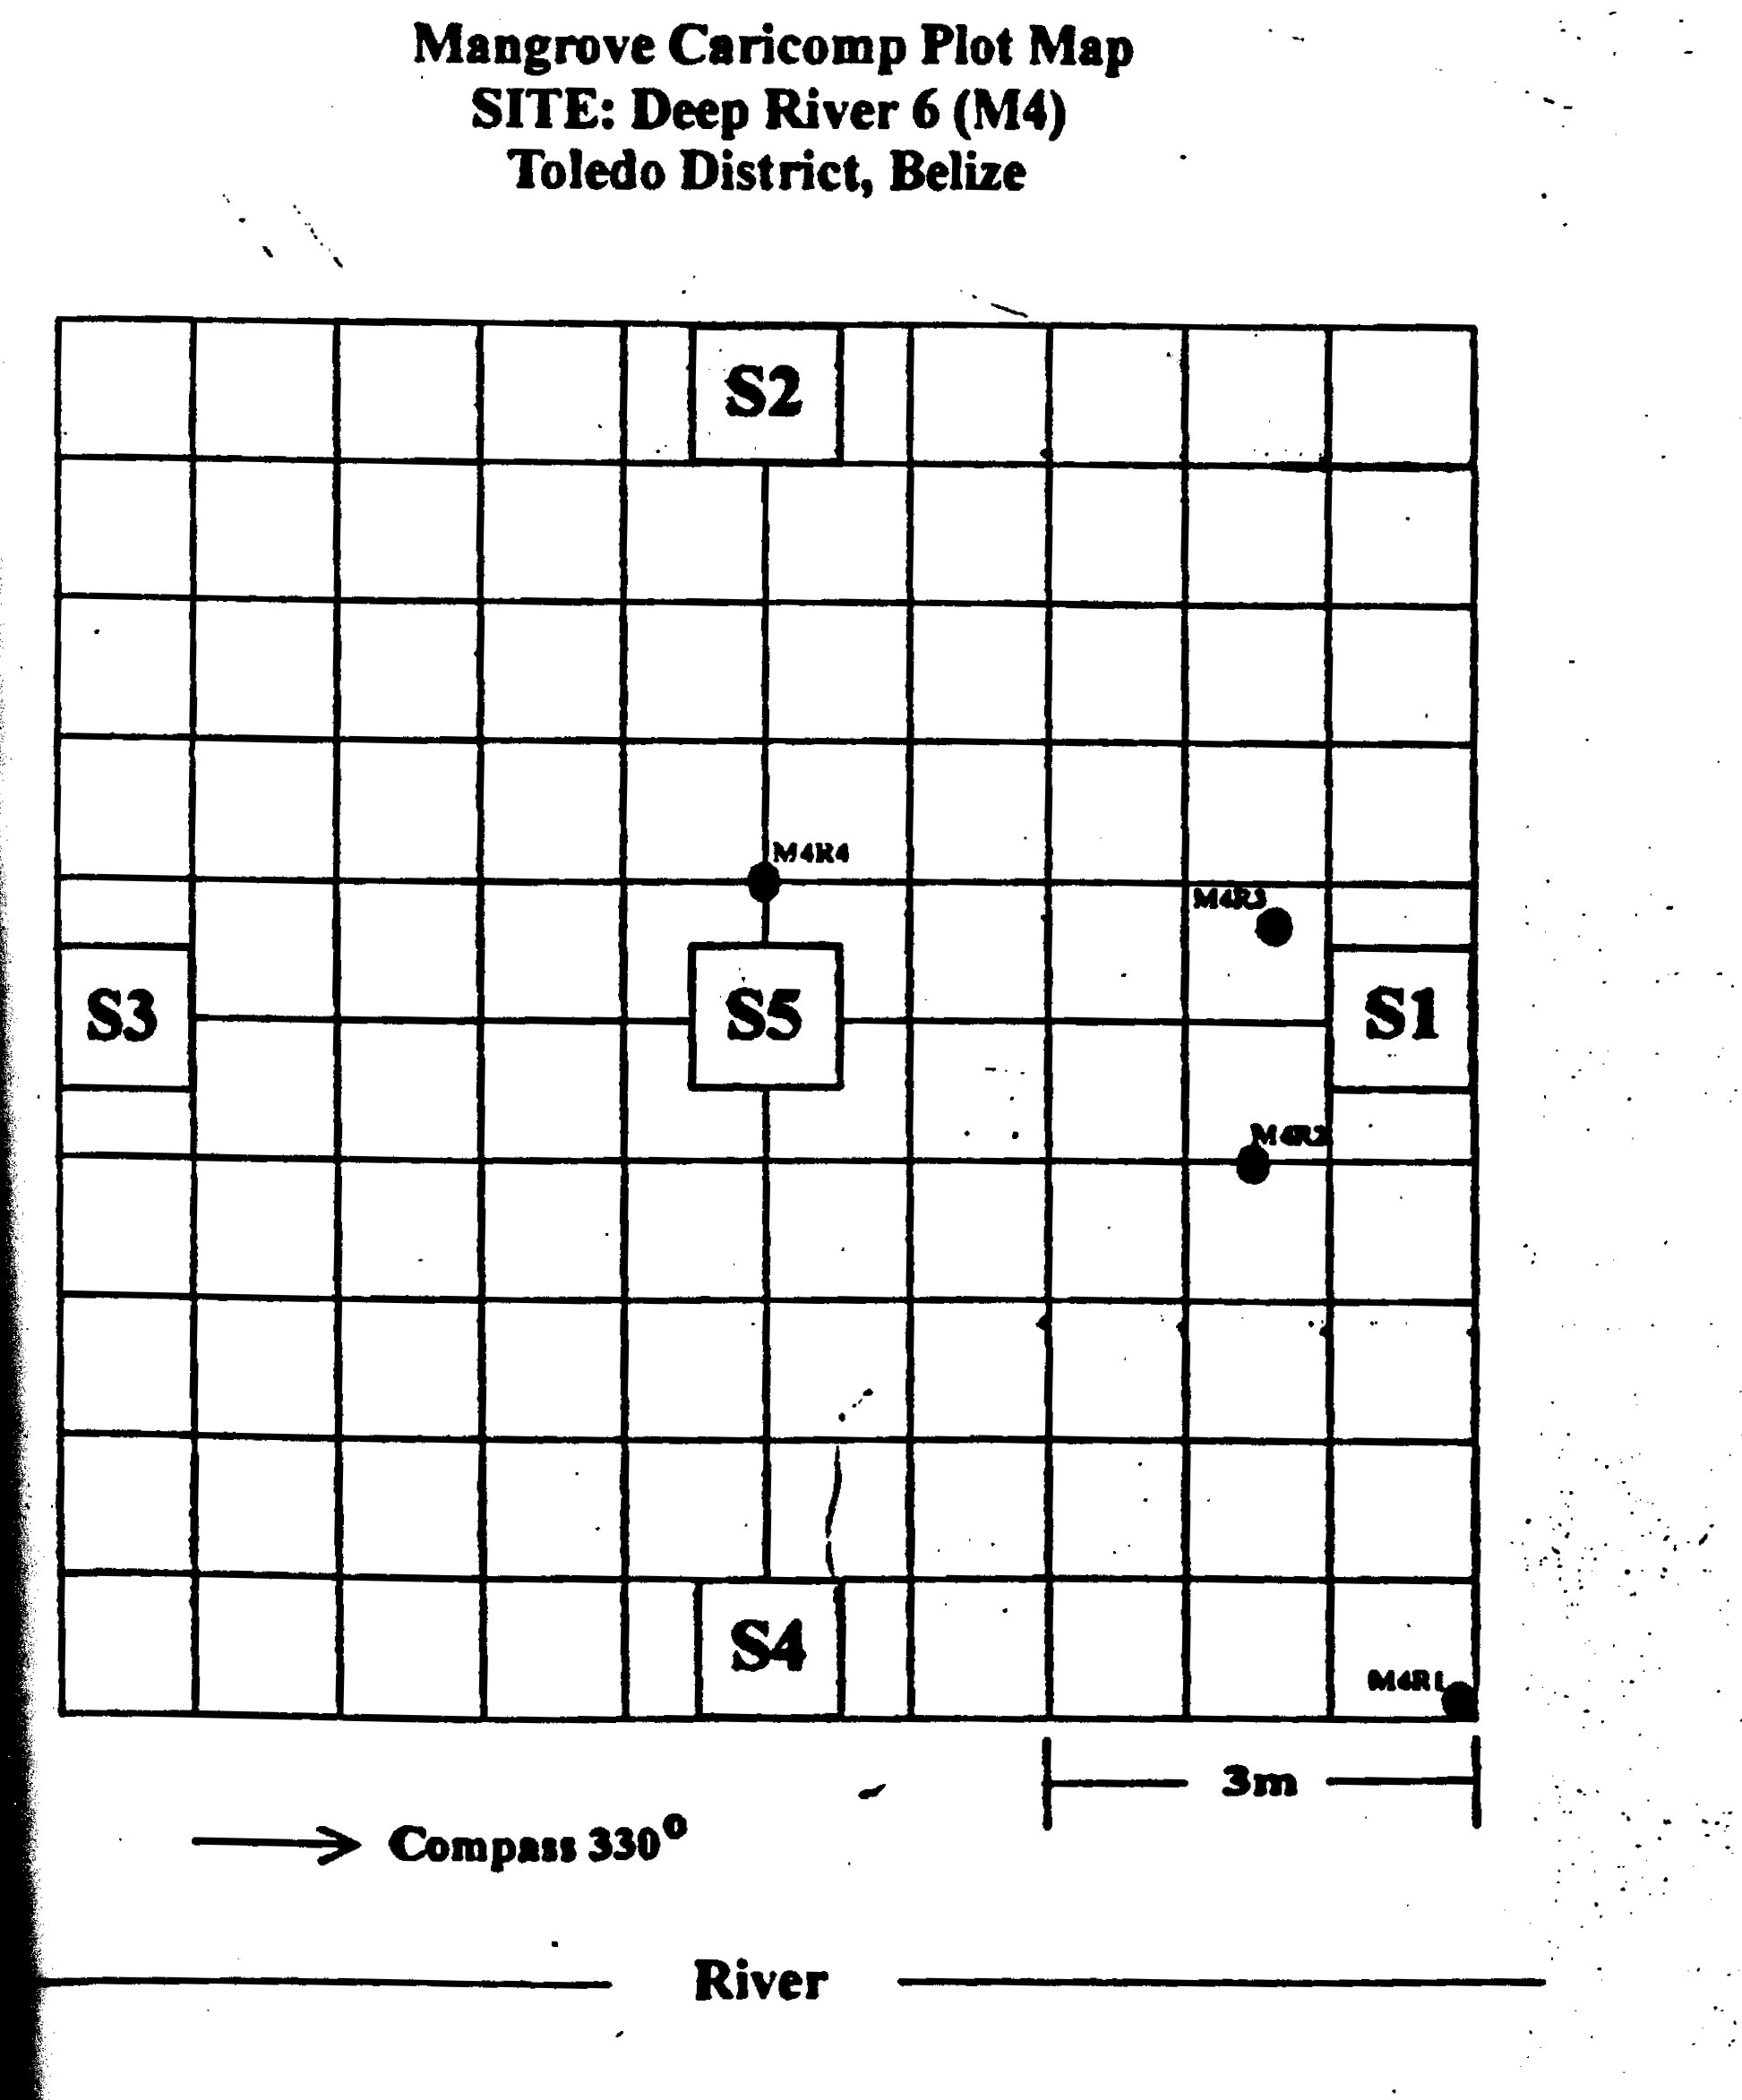
The methods were adapted by Will Heyman from a 1994 rapid ecological assessment protocol written for Port Honduras and from the CARICOMP standards. Three replicate mangrove plots at the mouth of each river, each gridded into a hundred one-metre squares; every stem over 2.5 cm in diameter tagged, mapped by differential GPS, identified and measured for girth, diameter, basal area, height and mass; five one-metre sub-plots per plot for saplings, and ten leaf-litter traps. For seagrass, seven stations focused on Thalassia testudinum: four cores per station sorted into green leaves, short shoots, live rhizomes, live roots and dead below-ground material and dried to constant weight, and six quadrats per station whose blades were punched with a hypodermic needle and harvested eight to twelve days later.
The headline structural result reproduces exactly from the archive. Deep River had about a third of Monkey River’s stem density but trees about 1.65 times larger in mean diameter, and the two watersheds ended up with similar total basal area — which is itself the chapter’s argument that the Deep River trees must, on average, be much bigger.
The chapter is Chapter Four; the plot-by-plot mangrove measurements are re-plotted from the original spreadsheet in the data section.
The chapter refers to its seagrass sites only as “site one” through “site seven,” and never prints where they were. The spreadsheets carry the names.
These are real, locatable features in the Port of Honduras, and recovering them is what makes a modern remote-sensing comparison addressable rather than notional.
They also expose two internal inconsistencies, which are recorded here rather than tidied away. The chapter argues that site two is not particularly close to any cayes that might contain mangroves — but the station is named Wild Cane Key. Either it sat well off the caye or the reasoning is post hoc, and the archive cannot say which. And the chapter describes site five as the second closest to the mouth of Deep River and then, two sentences later, as the second closest to the Monkey River mouth. The station name supports the first; the second is a slip.
The mangrove plots carry two labelling systems, and confusing them silently corrupts the chapter. The descriptive names run Monkey River 1–3 and Deep River 4–6. The CARICOMP plot codes run M1–M6, assigned in order of establishment — so M2 is Deep River 5, M3 is Deep River 4, and M4 is Deep River 6. The mapping is confirmed by two surviving scanned CARICOMP field sheets, whose headers give the site name, the code and the establishment date together.
Read in M-codes, every ordering in my Discussion reproduces exactly. But the interpretation I built on top of them does not. I hedged my own strongest result twice, writing that the result “may be skewed due to the large trees in site four” because the two sites with the next biggest trees were in Monkey River.
They were not. The second- and third-largest plots are Deep River 5 and Deep River 4. The “M” prefix appears to have been read as “Monkey.” In fact all three Deep River plots exceed all three Monkey River plots on mean girth, mean diameter, mean mass and mean height, with no overlap on any of them. The watershed contrast was cleaner and stronger than I concluded, and it was not based almost entirely on one site.
The turnover rates are too low by a factor of about six
Neither formula printed in the chapter is what the spreadsheet actually computed. Reconstructing the archived calculation exactly shows that turnover was derived by dividing areal productivity by a standing crop that used each station’s summed six-quadrat biomass over the area of a single quadrat — inflating the denominator roughly six-fold. The values as the chapter reports them, 0.45 to 1.06 per cent per day, are implausibly low for Thalassia testudinum; recomputed on a per-quadrat basis they run 2.7 to 6.4 per cent per day, which is the range normally reported for the species. One caution about the word “published”: these numbers appear in the chapter’s table, not in its running text, so what is being corrected here is the arithmetic behind a table, and the only external check on it is the published literature on the species.
The rank order is unchanged — site two remains the outlier high, sites five, six and seven the low group — so none of the chapter’s interpretive claims about turnover is affected. Both sets are printed here in full rather than either being quietly replaced. The areal productivity figures themselves are internally consistent and can be used as they stand.
| Station | Standing crop (g m⁻²) | As reported (%/day) | Recomputed (%/day) |
|---|---|---|---|
| Monkey River SG1 | 64.7 | 0.509 | 3.06 |
| Wild Cane Key SG2 | 20.7 | 1.060 | 6.36 |
| Punta Ycacos Mouth SG3 | 64.0 | 0.768 | 3.84 |
| West Snake Key SG4 | 53.5 | 0.692 | 4.15 |
| Deep River SG5 | 70.1 | 0.455 | 2.73 |
| Clam Shell Keys SG6 | 67.4 | 0.462 | 2.77 |
| Deep River SG7 | 69.8 | 0.521 | 2.75 |
The regressions are read backwards
Regressing against distance from the river mouth gave R² of .063 for old-growth biomass, .159 for number of shoots and .140 for number of blades, all with negative trends and all significant. The chapter calls these “relatively high” and infers that many variables besides distance are at work. The R² values are in fact low: distance explains six to sixteen per cent of the variance. The substantive conclusion I draw from them — that distance matters but is far from the whole story — is the right one; the wording is backwards. And the distance values themselves do not survive in the archive, so the regressions cannot be re-run.
And one column that should not be used at all
The mass column is redundant: as applied, mass is diameter multiplied by 3,390 for 66 of the 69 stems. A biomass estimate linear in diameter carries no information beyond diameter itself, and it is not comparable with modern allometric estimates, which are power functions. Any modern comparison should use diameter and basal area. One order-of-magnitude typographical error survives in the file, at Monkey River 1; correcting it moves that plot’s mean mass and changes no conclusion.
The spreadsheets are trustworthy. Two of the six plots can be checked against an independent artefact — the scanned CARICOMP field sheets that were reproduced as tables in the thesis — and the recomputation matches those 1994 sheets to the decimal.
Two species facts the chapter never states, but the data do. Manatee grass, Syringodium filiforme, was recorded only at Monkey River SG1, and substantially — about 94 g per square metre across green and non-green material. That bed was mixed, not a Thalassia monoculture. And no Halodule wrightii was recorded anywhere in the survey.
Chapter Four is a data chapter. The argument it feeds sits in Chapter Five, and what I proposed there is worth setting out, because it is the thing the last thirty years have been testing.
I argued for bottom-up management — management enacted by those most closely affected by and linked to the resources — implemented as a modified biosphere-reserve model with multiple-use zoning, following a six-stage sequence from identifying user groups through to modifying zones for socio-economic reality. I noted that the Belize Center for Environmental Studies had completed the first four stages, and that my own chapter was part of the fourth. I argued for the Maya Mountain – Port Honduras protected corridor, land and sea linked. I argued for locally controlled tourism as the economic engine, citing the Toledo Ecotourism Association’s village-stay cooperative as a working model, and explicitly against agricultural expansion in Toledo.
And I named the participation problem myself, in 1996, before anyone had a name for it: local involvement, as it then stood, might not be adequately representative of all local needs, because Toledo District is the most ethnically diverse part of Belize and adequate management would require incorporating all of the affected groups. That is the critique the pages on the other two places keep arriving at from the outside. Here it is inside the original text.
I also left a falsifiable prediction, which is the most useful sentence in the chapter for a return: as long as the forests are protected, coastal damage from sedimentation will likely be minimal, because the Toledo rivers rise directly in limestone.
On Monkey River village itself, Chapter Five records the 1994 situation: many residents had already left for Mango Creek as the banana industry declined, and roughly two hundred people remained, living mainly by fishing.
On 9 October 2001, at 0200 UTC, Hurricane Iris made landfall as a Category 4 hurricane — 125 knots, 948 millibars — in the vicinity of Monkey River Town. That is the National Hurricane Center’s own wording in its tropical cyclone report on the storm (Avila 2001), and Monkey River Town is the northern of my two watersheds: seagrass station SG1 sat just north of that river mouth, and three of my six mangrove plots were at it.
The damage figures for the village conflict, and this page does not reconcile them. The hurricane report says most houses were demolished. A figure of up to 90% destroyed appears in the subsequent literature (Beven et al. 2003, as cited by Karlsson et al. 2015). A figure of 98% structurally damaged is attributed to Belize’s national emergency organisation (via Wildtracks 2017). Destroyed and damaged are different metrics and the sources are not measuring the same thing.
The more consequential point is a negative one. No peer-reviewed study quantifies Iris’s mangrove mortality in Belize. That is a real finding about the record rather than a gap in searching: the single event most likely to have reset the mangrove structure I measured in 1994 — a Category 4 eyewall over the plots — has never been measured.
It is worth holding that beside the satellite result in the next section. The only clearing signal that assessment detected anywhere in the wider Port Honduras area falls between 2004 and 2010, near Monkey River Town. Cover and structure are not the same quantity, and an area-class time series can carry a stand through an event that changes its height and its age.
Analysis of Landsat imagery from 1987 to 2013 found that Monkey River village has lost up to 100 metres of shoreline — about six hectares — along a kilometre of coast (Karlsson, van Oort & Romstad 2015). Emergency works were still under way in February and March 2026.
The cause matters, because the obvious explanation is the wrong one. It is not dams. The attribution in every verified source is upstream irrigation abstraction and the consequent sediment starvation of the river mouth, compounded by storm-driven mangrove loss. The Swasey and the Bladen — the Bladen being a branch of the Monkey River itself — supply more than 60% of the irrigation water for Belize’s bananas, and that water is not returned to the river. A river starved of flow delivers less sediment to its own delta, and the shore retreats.
Set that against Chapter Five. I recorded roughly two hundred people still at Monkey River in 1994, living mainly by fishing, after the decline of the banana industry had already drawn residents away to Mango Creek. The bananas did not leave the watershed. They moved upstream and took the water.
The proposed protected area became real. The Port of Honduras Marine Reserve was declared in 2000, and in 2013 a satellite baseline assessment of its mangrove and seagrass cover was produced for TIDE, the organisation that monitors it (Cherrington 2013). On the mangroves, the result is remarkable.
Against a national loss and a regional pattern of clearing, the mangrove of the Port of Honduras is one of the places where nothing happened. That is a real outcome and it is consistent with what I predicted, though not proof of the mechanism I predicted it from.
Belize was the first country to run a nationwide SeagrassNet network — 21 sites, monitored quarterly — and the seagrass chapter of the state-of-the-coastal-zone report covering 2003 to 2013 gives the results.
East Snake Caye, near Punta Gorda, is a reference site — a least-impacted control — and it sits inside the Port Honduras area. The report records that since October 2010 it declined from about 40% cover to about 10%. At Joe Taylor Creek, also in Toledo, there was a steady decline from 2008, and monitoring was suspended for poor visibility. At Placencia, well up the coast in Stann Creek, cover fell sharply in 2004–05, held around 75% to 2008, and was down to about 30% by October 2010. Northern and atoll sites over the same period were stable.
These are the most on-point southern-Belize seagrass data that exist, and they point the opposite way from the satellite assessment. There is no contradiction: the satellite study’s own wording is a statement about detection limits rather than about the seagrass, and it says plainly that no time series of seagrass cover exists for Belize. Field monitoring saw a collapse at a control site; the satellite could not have seen it.
So the honest summary for the habitat I actually measured is: the mangrove held and the seagrass did not — and my hypothesis was about the link between them.
The most quietly damning fact in the Belize record is not an ecological one.
TIDE’s water-quality monitoring ceased in 2015 for lack of funding. That is stated directly in the peer-reviewed literature (Sweetman et al. 2019) and corroborated by absence: the reserve’s own 2019 monitoring report covers lobster, conch, sea cucumber, coral, reef fish and bleaching, and water quality does not appear in it at all.
SeagrassNet disappears from the record too — the following state-of-the-coast report, covering 2014 to 2018, does not mention it once. No seagrass time series in Belize continues past 2012. Belize’s own integrated coastal zone management plan for 2025–2030 concedes that data on seagrass in Belize is limited, and publishes no national seagrass area figure at all. The only verified national extent — about 4,957 km², or 48% of shelf area — derives from early-1990s Landsat imagery, which is to say it is essentially contemporaneous with my fieldwork.
Chapter Four was written as a baseline, which is a thing you lay down expecting somebody to measure against it. Thirty-two years later the honest position is that the country knows less about its seagrass than it did in the window when I was measuring it.
By the standards a country is usually judged on, Belize did the things. The Port Honduras Marine Reserve was declared on 25 January 2000, co-managed by the Belize Fisheries Department together with TIDE, a local organisation — which is close to the arrangement Chapter Five argued for, though not the community-led version of it. It is worth noting what did not follow: Belize never adopted a national co-management framework, and in 2006 the Supreme Court found that the earlier co-management agreements had no basis in law. The Belize Barrier Reef Reserve System was placed on UNESCO’s List of World Heritage in Danger in 2009 and removed from it in 2018, after Belize adopted a moratorium on offshore oil — though the committee accepted one of its indicators on the basis of a commitment rather than a completion.
Then in 2021 came the blue bond — a debt-for-nature swap that refinanced national debt in exchange for binding marine conservation commitments. It is genuinely double-edged and should be reported as such. The commitments are real, though the proportion is smaller than the headline: of about US$364 million refinanced, roughly US$24 million funds conservation directly. And Standing (2022) argues that the arrangement carries a democratic deficit: the terms are confidential, and conditionality over domestic fisheries policy is set outside the domestic political process. A conservation instrument that removes decisions from the polity is an awkward thing to celebrate on a page about public participation.
And the counterweight is published by Belize itself. The national Reef Health Index fell from 3.0 — “fair” — in 2018 to 2.5, “poor”, in 2024. Over the same quarter-century in which the country declared the reserve, banned offshore oil, got itself off the danger list and financed conservation at scale, the index it publishes about its own reef went down.
Belize gives the clearest version of the pattern the other two pages arrive at, because here the two halves of the answer sit in the same reserve.
The architecture got built. A chapter written in 1994 to inform the management planning of a protected area that did not exist turned out to be describing an area that was declared in 2000, is monitored by a local organisation, and has had baseline assessments commissioned for it. On the specific outcome I cared most about, it worked: the mangrove within the reserve’s boundary did not move at all across the 1980–2012 satellite record, while the country around it lost cover and one city accounted for over half the national clearing. Two qualifications belong with that. The reserve protects water and seabed only — its roughly 138 mangrove cayes are formally excluded — and the reserve existed for twelve of the thirty-two years the satellite series covers.
And the ecology went the other way anyway. The seagrass at a reference site inside the same reserve fell from about 40% cover to about 10%. Monitoring at Joe Taylor Creek, the other Toledo station, was suspended for poor visibility. And then the monitoring itself lapsed, for lack of money, and has not been replaced.
On my falsifiable prediction — that coastal sedimentation damage would stay minimal as long as the forests were protected, because Toledo’s rivers rise directly in limestone — the record is genuinely split and should be read as split. The mangrove result is consistent with it. The visibility loss that ended monitoring at Joe Taylor Creek — the report gives poor visibility, not a measured cause — and the nitrate signal in the Rio Grande, are not. And the land-use pressure I warned against did arrive: I argued explicitly against agricultural expansion in Toledo while allowing citrus in small areas, and national citrus area grew about two and a half times between 1994 and 1999 — the dominant agricultural land-use signal in the Toledo and Stann Creek hinterland over this period — before collapsing to 22% of its peak by 2023.
And the critique the other two places had to learn from the outside, I had already written down about Toledo in 1996: that local involvement can be structurally unrepresentative even where it is procedurally present, in the most ethnically diverse district in the country.
The foil: participation as containment
The sharpest contemporaneous critique of exactly this was being written about Belize while I was writing about Belize. Roger Few’s fieldwork on protected-area planning there (Few 2000; Few 2001) describes participation functioning as containment: planners avoiding open conflict, quietly excluding dissenting interests, and retaining control of both the knowledge and the procedure, so that consultation manages opposition rather than sharing authority over the decision.
That is the mechanism which would explain the split all three of these pages keep finding — the architecture present, the outcomes unmoved — without needing either triumphalism or cynicism. A consultation that is real as procedure and hollow as authority produces exactly this record: reserves declared, plans written, committees seated, indices falling. It is also the objection I half-raised myself, about Toledo, and did not pursue.
Which is the most useful thing this page can hand back to the argument. The thesis treated participation as a design problem — get the right people in the room, structure the process, limit the biases. Few’s Belize suggests it is also a power problem, and that a well-designed process can be run by people who have already decided. Chapter Six’s insistence on eliciting objectives before alternatives is a partial defence against that. It is not a complete one.
The references behind the claims on this page. A link is given where one is recorded in the research brief; its absence means the brief carries no URL for that work, not that none exists.