Line intercept transects were used to survey the Suva Barrier Reef off Laucala Bay, Suva, Fiji. Salinity and temperature were measured at each of five sites surveyed. Distribution patterns of benthic cover were recorded using morphological keys for identification. Data was examined and used in conjunction with an area map to determine potential causes for distribution patterns. We found the reef to be highly damaged. The hypothesis that this damage results primarily from a recent hurricane and secondarily from anthropogenic effluent and low salinity is discussed. Distribution patterns of different coral forms are examined and potential causative factors are proposed.
§Introduction
Management and conservation of coral reefs is necessary due to their potentially important roles in erosion control, food production, tourism, biomedicine, and global warming (Baker and Williamson 1986; Williams and Williams 1990; Sheehan 1985; Spurgeon 1992). Management of coral reef systems requires careful monitoring. Periodic determination of species composition and distribution of a coral reef allows for some understanding of its natural state. An understanding of natural fluctuations allows determination of “unhealthy” conditions that might damage a reefs natural geologic or biologic state. The system must be understood well enough to establish general guidelines for differentiating natural fluctuation from anomalous disturbance (Rogers et al. 1983). This is a difficult task because natural systems change much over time. Currently management based primarily on qualitative short term studies.
A normal baseline is not easily definable and determination that systematic fluctuation is unnatural or potentially degradative should always follow rigorous study and statistically significant correlation with the hypothetical causative agent. Reefs, like other ecosystems, are dynamic; alteration of the eco-system may be natural and does not necessarily indicate that the system is being unnaturally stressed. Reefs can shift greatly in a 10 year span of time, even in areas without obvious anthropogenic impact. Confident establishment of a baseline is difficult (Rogers et al. 1983).
To allow for timely conservation, action must sometimes be undertaken with limited available knowledge (Rogers et al. 1983). Due to our limited knowledge, potential impact of future anthropogenic effects should be considered severely. Exercising pre-caution may prevent unexpected destruction. As shown by chaos theory, a very small action can have unpredictable large reactions (Waldrop 1992).
In this paper I examine the state of the Suva Barrier Reef using line intercept transects. I begin by briefly discussing natural and anthropogenic stressors that may be affecting the Suva Barrier Reef. Following this I discuss the use of different reef measurement techniques for establishment of a baseline. The rest of the paper is then devoted to presentation and discussion of the results of this transect study.
§Natural Impacts on Benthic Distribution
Though many natural factors, including temperature fluctuation, competition, predation, and sedimentation affect coral distribution for purposes of this study examination of effects of hurricane and light absorbance appear most relevant (Burns 1985; Sammarco et al. 1985; Knowleton et al. 1990; Wittenberg and Hunt 1992).
§Hurricanes
While storms “damage” reefs through wave impact, scouring, sedimentation, and reduced salinity (Moran and Reaka-Kudla 1990), and cause significant changes in cover of live and dead coral (Rogers et al. 1983), recovery for some species is rapid (Moran and Reaka-Kudla 1990) and impact on diversity appears minimal (Rogers et al. 1983).
Rogers et al. (1983) used line transects to monitor reefs in the Virgin Islands both before and after the 1979 Hurricane David. Because hurricane damage was not species specific, even though the number of dead coral was significantly greater following the storm, diversity and evenness did not suffer. Complicating the issue, Rogers et al. show that diversity is not necessarily indicative of reef health, citing Caribbean reefs with very low diversity that are very actively growing and appear very healthy. Similarly, Moran and Kudla (1990) found that, though Virgin Island reefs experienced “...severe and sustained damage from waves, sand scouring, and moving debris”, benthic invertebrates increased above pre-hurricane densities. Furthermore, Moran and Kudla (1990) hypothesize that the colonizing life history of some corals allows them to prosper in disturbed habitats. Though hurricanes certainly alter reef structures, the rapid recruitment of certain organisms and long history of hurricane impact indicate that reef organisms are, at least moderately, adapted to, and possibly dependent on this particular stressor.
Light is also a particularly important factor for coral distribution. Light absorbance is affected by many natural and anthropogenic sources, including sedimentation, depth, interspecific competitive exclusion, and algal overgrowth. Corals require light due to their associated symbiotic algae, zooxanthellae. Low light levels prevent zooxanthellae photosynthesis, potentially resulting in coral death from lacking nutrients. Titlyanov and Laptypov (1991 ) found that corals are strongly affected by differential light levels, experiencing a general flattening for greater surface area with increased depth. Furthermore, they found that only encrusting and explanate plate forms of corals are capable of surviving in very low light levels (Titlyanov and Laptyov 1991).
In an examination of coral distribution on four South Florida reefs, Burns (1985) concluded that the low diversity, cover, and abundance, synchronous with few Acroporids, resulted from surface water cooling during severe winter cold fronts. Hard corals are highly temperature sensitive with lower limits of 14-16° C.
Examination of Burns (1985) study points to some of the complexities in determination of causative agents for changes in coral distribution. Burns found that certain massive coral forms, including Montastrea Anularis, were relatively abundant, especially in deep water zones. Burns used this information to conclude that, though the reef was generally depleted due to cold surface waters, other factors, including hurricane damage and anthropogenic sedimentation, had kept all but a few species from significant establishment. Burns states that massive forms are less prone to sediment damage and thus the reduced impact of hurricanes in deep waters allowed moderate colonization in these areas.
§Anthropogenic Impacts on Benthic Distribution
Anthropogenic stresses range from the occasional coral dislodgment or destruction from anchor or diver damage (Rogers et al. 1983), to massive eutrophication and sedimentation from sewage, agricultural, and industrial pollution (Wittenberg and Hunte 1992). Wittenburg and Hunte (1992) found that juvenile abundance and mortality decreased on reefs exposed to sedimentation and eutrophic conditions. This is further exemplified by Titlyanov and Latypov (1991) who show that corals are greatly limited by light. Sediment loading decreases light absorbance and eutrophication causes increased zooxanthellae growth, eliciting overshadowing. As shown by Wittenberg and Hunte (1992), this affects distribution by favoring few, large, resilient coral species and algae. These large algae and corals overshadow species less adapted to low light levels. Eventually, with sufficient reduction in light absorbance, pollution could cause wholesale reef destruction.
§Methods for Monitoring Reef Distribution
Accurate, fast methods to determine the current state of a reef are necessary to establish effective monitoring programs for management of reef systems. Chiappone and Sullivan (1991) state that, while many techniques have been used for monitoring reef systems, the accuracy of these methods is not well understood. Certain common devices, such as quadrat sampling, have been criticized as being un-representative of the three dimensional reef community; Chiappone and Sullivan (1991 ) state that such methods are most practical on the reef flat.
Rogers et al. (1983) successfully used linear transects to examine the effects of Hurricane David on coral reefs in the U.S. Virgin Islands. They found transects to be more effective than quadrats for generalized monitoring of coral cover and obvious changes in reef structure. Transects allowed much more time efficient determination of reef structure and the increased resolution of quadrats was not necessary because morpho-dynamic changes were found to generally occur over a large area. Furthermore, Rogers et al. (1983) feel that linear transects provide a useful method that can be adapted for monitoring other types of reef alteration. The accuracy of this technique was supported by the finding that remarkable consistency was observed by different people examining the same transects over time. Exemplifying the spatial versatility of linear transects, Burns (1985) found linear transects efficient for determination of hard coral distribution in relation to cold water disturbance. Burns (1985) used linear transects to monitor the reef face at increasing depths, showing that this method can account for some of the three dimensional complexity of a reef system.
Chiappone and Sullivan (1991) compare three survey techniques, including species presence and absence lists, linear percentage, and line transects using 1 M by 1 M grids. Following comparison, Chiappone and Sullivan (1991) conclude that quadrat modified line transects were the best quantitative technique because they allow for assessment of both colony numbers and colony sizes. Furthermore, they state that their modification of transect sampling, unlike simple quadrat sampling, takes into consideration the three dimensional complexity of the reef area. All dimensions are accounted in this method because the line transect is a continuous malleable strip ideal for determination of vertical differences, while the quadrat is good for accounting horizontal variations. Quadrats alone are not adequate because of their rigid one dimensional structure. The versatility of the quadrat-transect hybridization was demonstrated by Titlyanov and Latypov (1991) in their three dimensional examination of the light dependence for coral distribution in the South China Sea Islands.
§Purpose of This Study
In this study we used line intercept transects to survey the Suva Barrier Reef, off of Laucala Bay in Suva, Fiji. The Suva Barrier Reef is likely to be affected by low salinity levels due to the high annual rainfall (2800-3500 mm) and high freshwater input from the rivers and creeks including the Rewa (the largest river in Fiji). Temperature levels may be very high during the warmer months, possibly resulting in damage to the temperature sensitive reef biota. Furthermore, sedimentation from these rivers may have detrimental effects on the reef. Hurricanes occasionally impact the area and potentially affect the reef. Anthropogenic Natural Impacts on Benthic Distribution might include effluent released from the industry of Suva, as well as anchor and diver damage.
Distribution patterns, salinity, and temperature were recorded at all sites. In this study we attempt to determine the current state of the Suva Barrier reef and assess potential causes for distribution patterns. To conclude, areas beneficial for further study are explored.
§Methods
§Overview, Site Selection and Transect Placement
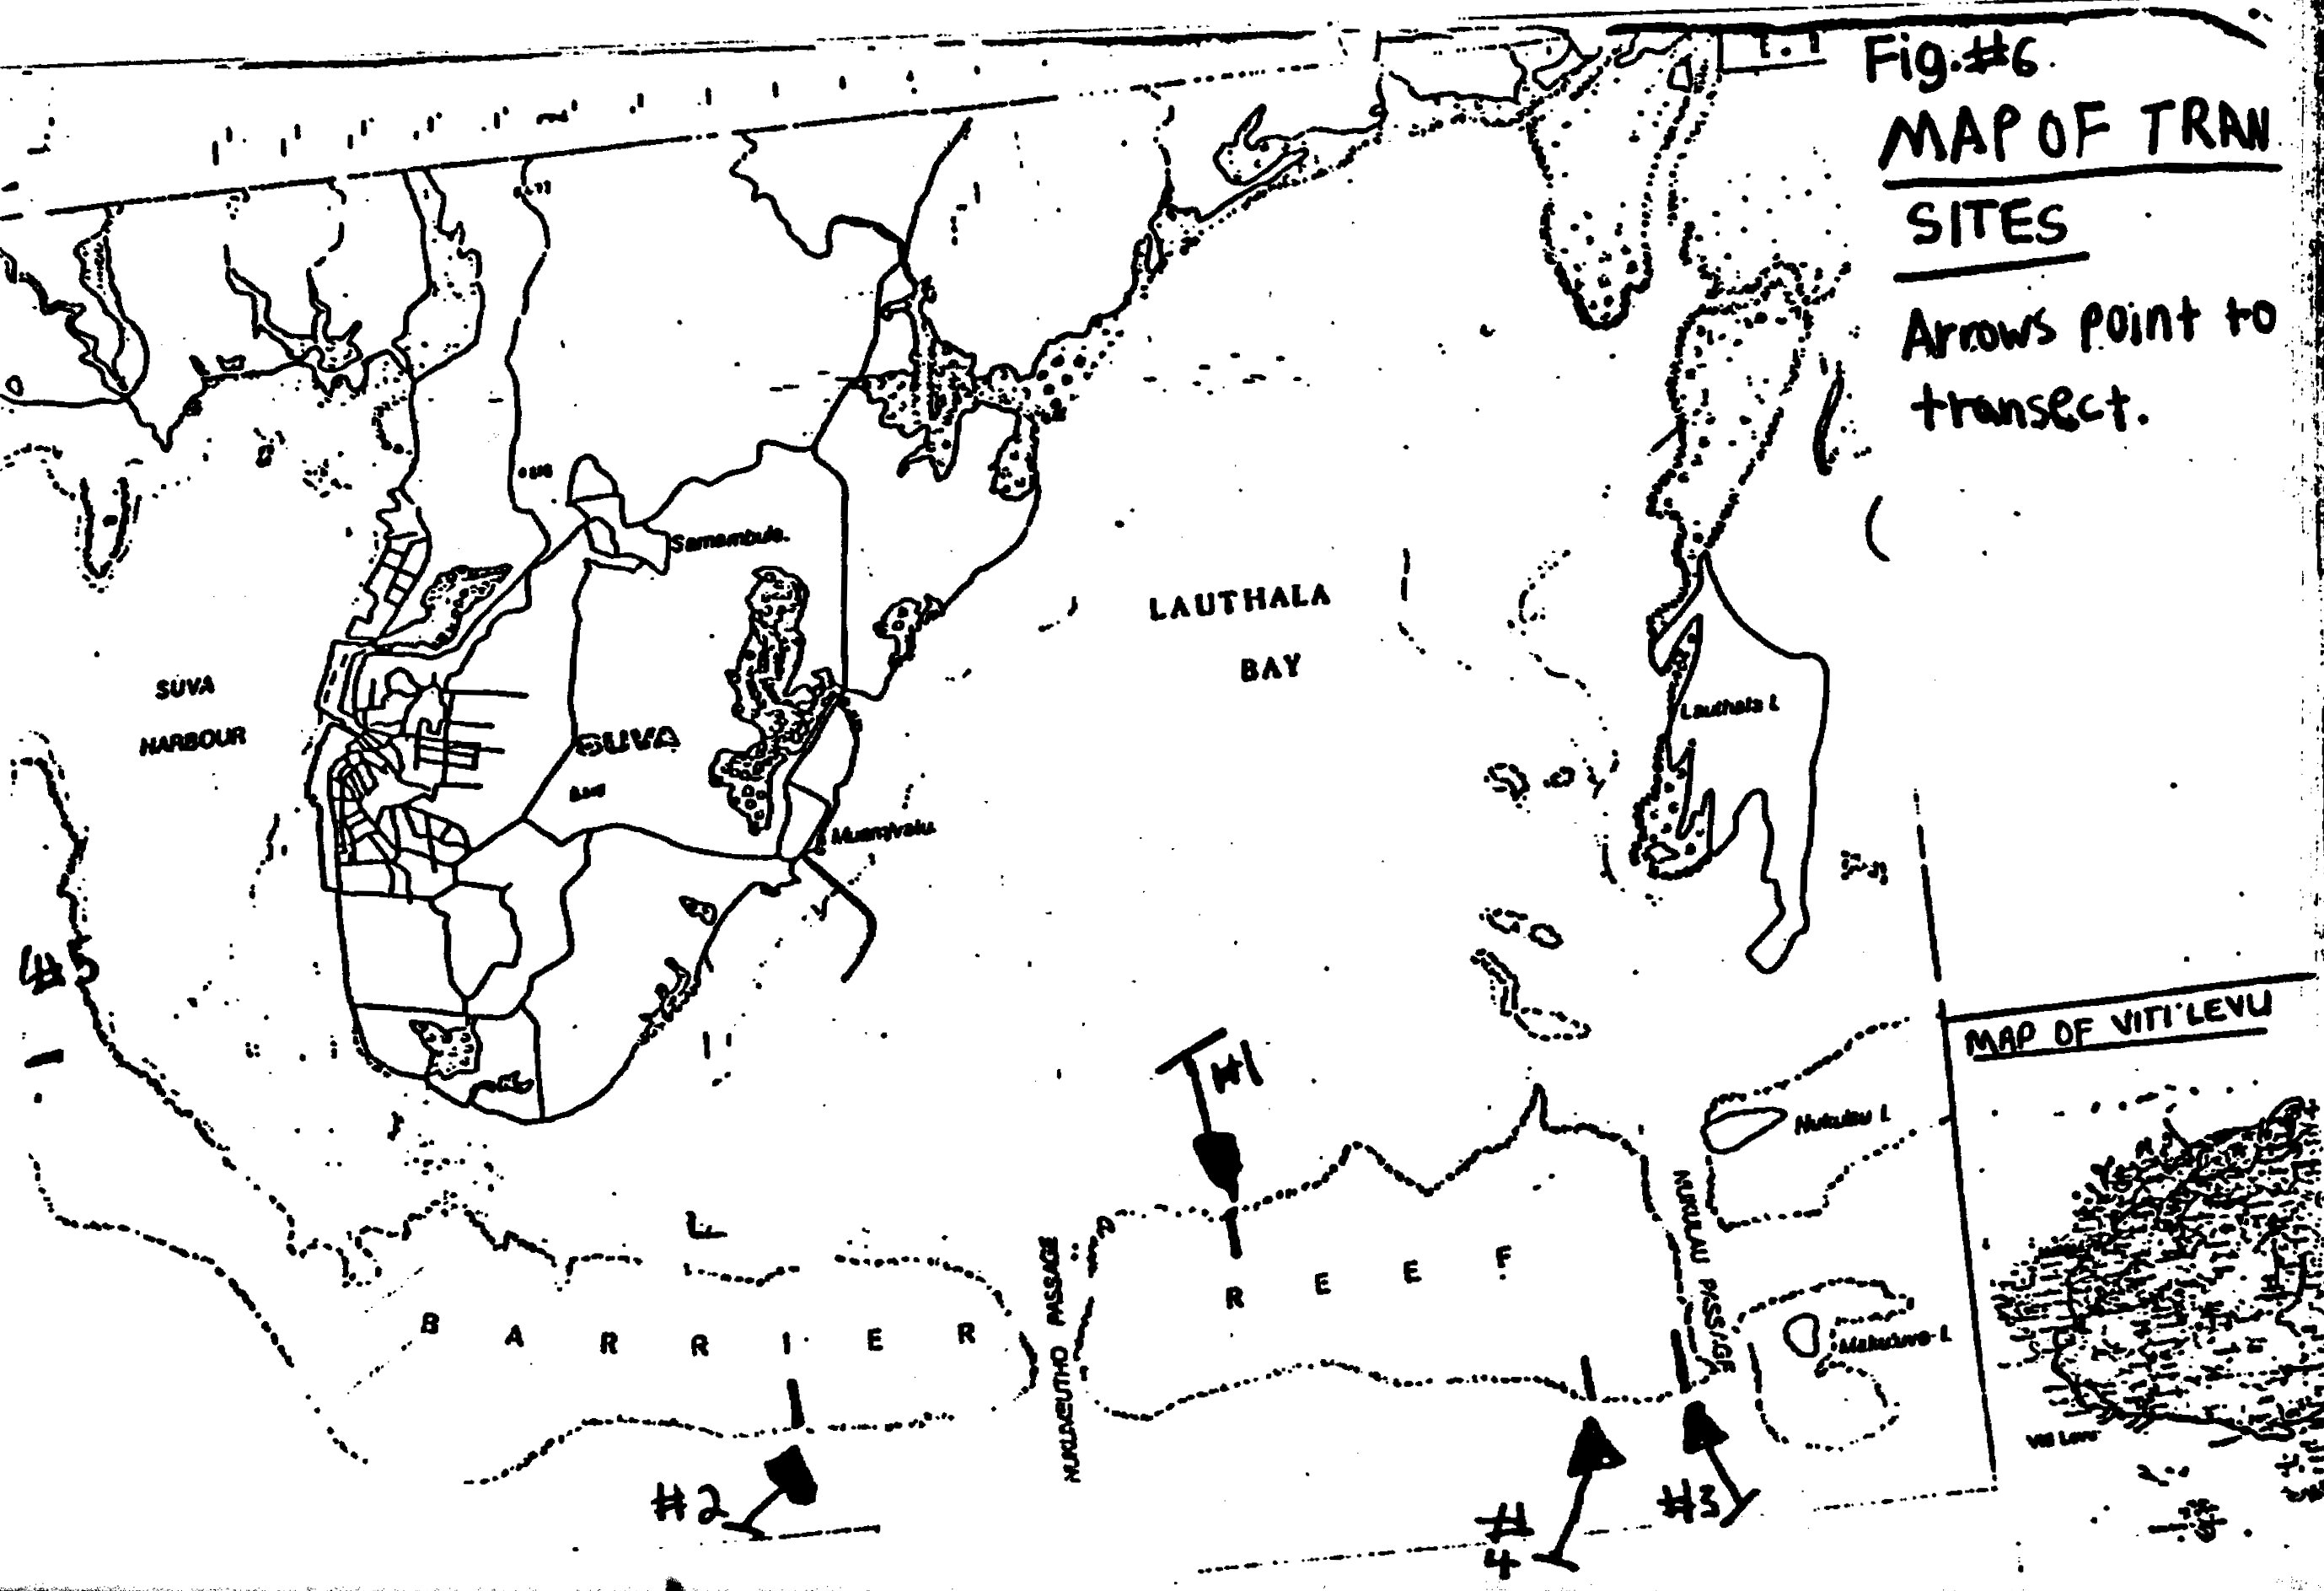
Five 100 M line intercept transects (LIT) were used to examine the status of the Suva Barrier Reef near Suva, Fiji (see figure 6 for map of sites). Salinity and temperature were measured at each location to examine possible causes for distribution patterns. The study was conducted on the reef flat during low tide from mid August to mid October on Thursday mornings. Sites were qualitatively selected to allow for optimum examination of the representative distribution of benthic fauna over a relatively large area of the reef. Ideal representative site locations were chosen by a local marine specialist with expert knowledge of the Suva Barrier Reef area.
Upon arrival at each site location, area for analysis was randomly chose to deter distribution bias. Random location was accomplished by anchoring the tape immediately following exiting the boat, thus discouraging a visually biasing estimate of the immediate reef conditions. Two continuous 50 M fiberglass measuring tapes were used for census. Tape ends where attached to iron pegs which where hammered into the coral substrate to prevent movement confounds. LlT’s were placed roughly parallel to the reef crest. Slates with pencils where used to record data.
§Survey and Determination of Per-cent Benthic Cover
Following placement of tapes, we walked slowly along the transect, recording each change in benthic cover observed under the tape. Transition points were recorded in centimeters. Identification was based on morphological characteristics. Identification was limited to morphologically distinct varieties of dead coral, Acropora, non Acropora, soft coral, sponges, zoanthids, algae, abiotic, and other unidentified (see table 1 for a complete listing of identification with codes). Single life forms intercepted more than once by the same tape (if a different life form is on top of part of a life form) were recorded as a continuous measurement. Those lying on top were recorded as coinciding with the measured segment area.
Percentage cover was determined for every 10 M of each transect for all life forms which allowed an approximate determination of the relative abundance of each life form at different points along the transect. Using this method, it was possible to examine relationships between different areas of the reef and the life forms observed. To determine percentage cover, the following formulae was used:
§Salinity and Temperature
Salinity and temperature measurements were recorded for each site using a model 33 S-C-T salinometer.
§Statistics
I applied two-way balanced analysis of variance (ANOVA) of transect and location within transect to all morphological categories. To separate means of significant results, I applied a least significant difference (LSD) test to all morphological categories. Minitab for Windows version 10 was used for all statistical tests.
§Results
See figure 6 for a map of all transect locations. Transects are marked as lines; numbers next to arrows designate transect number. No significant differences were found for location within transect.
All significant results are summarized in the table below. In this table, the transect which is significantly different is listed in the first “transect(s)” column. The second column indicates which morphological form is different in the transect displayed in the first column. The following column indicates whether the significant difference indicates that the mean is greater or less than at other sites. The following “transect(s)” column displays which transect or transects displayed differences in the abundance of the morphological form transect in the first column. The next section of the table shows the relevant statistical date; “p” (the degree of significance), the F value, and degrees of freedom (df).
For example, the first row states that transect 1 had significantly more “S” (sand) than all other transects, with a p of .000 (significant to more than three decimal places), an F of 15.84, and 4 degrees of freedom. This table also displays more complicated patterns as in the last row which states that transect 5 had significantly more “RCK” (rock) than transect 1, which, in turn, had significantly more than transects 3, 4, and 2.
Table 1: Results of ANOVA and LSD Tests for Coral Data
| Transect(s) | Morphological form | Sig. Result | Transect(s) | p | F | df |
|---|---|---|---|---|---|---|
| 1 | S | > | All others | .000 | 15.84 | 4 |
| 1 | RB | > | All others | .031 | 3.01 | 4 |
| 1,3 | AA | > | All others | .002 | 5.25 | 4 |
| 2 | DC | > | All others | .000 | 14.19 | 4 |
| 2 | CE | > | 3,4,5 | .047 | 2.68 | 4 |
| 4 | SC | > | All others | .002 | 5.42 | 4 |
| 4 | ACT | > | All others | .017 | 3.48 | 4 |
| 4 | ACB | > | All others | .002 | 5.11 | 4 |
| 4 | CT | > | All others | .039 | 2.82 | 4 |
| 4 | ACS | > | All others | .018 | 3.43 | 4 |
| 5 | RCK | > | 1 > 3,4,2 | .000 | 221.07 | 4 |
§Discussion
§Overview of Significant Trends
It appears that anthropogenic and hurricane influence has had a significant effect on the Suva Barrier Reef. Transects with greater proximity to Suva and shipping channels had either significantly fewer coraline forms (transect 1) or significantly greater amounts of abiotic and algal forms (transects 1, 3, and 5), including algae, rubble, and sand.
Hurricane impact from the 1992 hurricane might explain some of the distribution patterns found on this reef. Transects which have more shelter from islands or other sections of reef (Transects 3 and 4) displayed more diversity and abundance of live coraline forms than transects which were less protected (Transects 2 and 1). Less protected transects also had significantly greater rubble and dead coral than protected transects.
§Figure System
Figures one through five provide graphical translations of relative abundance of morphological categories for corresponding transects. Each of these figures shows per-centage abundance for all categories by ten meter segments to one hundred meters. The percentage is plotted visually; a thick bar indicates a high abundance and a thin bar indicates a low abundance. Quantitatively, the scale is 1 mm per 5% abundance (2 cm = 100% abundance).
Figure 6 displays a map of the Suva area and the transect sites. Figure 7 provides relative per-centage abundance for all categories and all sites. This figure is helpful when comparing many different categories and sites when the location details presented in figures 1-5 are not needed. In figure 7, each morphological category is depicted on the “x” axis and per-centage is depicted on the “y” axis; each transect is represented by a bar labeled as series 1-5 (respective to transect number). Figures 8-21 are detail figures (from figure 8) of per-cent abundance by site for each morphological category. To ease distraction when discussing trends, next to the name of a morphological category I cite the relevant detail figure by displaying the figure’s number in bold in parenthesis with the word “Figure” assumed.
§Analysis of Trends by Transect
§Transect One
Figure 1 shows sand, rock, rubble, and algae to be relatively abundant with few coraline forms evident (7). The abundance of sand (8) is expected because this transect was taken from the lagoon side of the reef where the depth is relatively shallow and sand has accumulated onto the reef base. Algae accumulations in this transect were relatively high and nearly absent on the other transects studied (9). This accumulation of algae indicates a high primary production that may result from anthropogenic eutrophication.
The relatively paucity of coral in transect 1 (figures 1 and 7 ) may potentially be due to variables facilitating coral growth on the ocean side of the reef. Hypothetically the limited corals in transect 1 may result from generally lower salinity levels due to the trapped influx from various fresh water sources. Furthermore, possibly excessive algae growth may be causing overgrowth of corals. Pollution indicators such as nitrogen and phosphorous may be causing algal overgrowth, or possibly direct chemical affects of pollution are diminishing the abundance of corals on the lagoon side.
§Transect Two
Examination of figure 2 (transect 2) shows that corals appear much more common on the ocean side than the lagoon side. This is supported by the other transects examined on the ocean side (3-5). Figure 2 also shows minimum algal growth (9), possibly indicating less direct eutrophic impact. The very high rate of dead coral here (10) indicates that previously the area was quite abundant in coraline forms (most appeared to be Acroporids but identification of dead forms is difficult). Possibly the corals were severely impacted by the 1992 hurricane which struck the area. The hypothesis that corals grow easier or quicker on the ocean side is supported by the observable decimation of corals in the last 40 M of transect 2, with some corals re-establishing directly next to the ocean. This may be partially due to the greater exposure to water with normal salinity levels at the ocean edge.
§Transect Three
Transect 3 (Figure 3) displays a relatively high diversity and abundance of coraline life forms. Analysis of this figure provides support for the hypothesis that a hurricane caused large scale damage to this reef. Transect 3 is in a location relatively sheltered from a potential hurricane by two nearby islands (Nukulau and Makaluva). Possibly the area of dead coral in this transect is located further towards the lagoon because hurricane currents parallel to the reef were capable of destroying the area further back. This dead coral area may also be an indicator of support for the hypothesis that first coral recruitment generally occurs close to the ocean. Coral would be expected to recruit from the ocean following a hurricane because deeper colonies would be less dramatically impacted; offspring of these colonies would colonize the reef starting at the area closest to the ocean.
The relatively high abundance of algae in the first 50 M of transect 3 (Figure 3, 7) indicates that waters rich in effluent high in nitrogen and phosphorous may be coming from the lagoon through the passage located next to this transect. The hypothesis that the passages may provide nutrient rich effluent is further supported by figure 7 which shows a small accumulation of algae in transect 2 (relatively close to a small passage), and no algae accumulation in transect 4 (the only transect with no direct lagoon contact). When skin diving in the area of the passage, qualitative observation showed a dull distorted haze throughout the water; this may be a visual indicator of polluted waters. Again, water tests of this area should be performed for confidence.
§Transect Four
Examination of figure 4 (transect 4) provides further support for the hurricane hypothesis. There is relatively more dead coral in this transect than in transect 3 (10), but diversity and abundance of live coral forms is still evident. Transect 4 is sheltered by the adjacent islands but less so than transect 3. Transect four also provides support for the anthropogenic effluent hypothesis. Transect four is the farthest site from Suva or passage influence, and it had significantly more of many coral forms, including coral tabulate (CT) Acropora submassive, Acropora tabulate, soft coral, and, Acropora branching, than all other sites (11-15). The relative “health” of this transect might indicate the lack of anthropogenic influence from Suva; transect four has less direct connection with water influenced by Suva or any passages.
The relative abundance of soft coral in this transect (14) may be due to a need for shelter from hurricanes. Possibly soft coral was not found abundantly in transect 3 because hard corals competitively dominate soft corals on the reef flat. This hypothesis is supported by the large amount of soft coral observed in the deeper water in the passage adjacent to transect 3, with few forms found on any reef flat transects. Furthermore Acropora tabulate and coral tabulate were only found abundantly in transect 4. Possibly these forms also indicate an intermediate successional stage. Transect 4 may be at a transition stage, while transect 3 may be further ecologically evolved due to greater sheltering.
§Transect Five
Analysis of figure 5 (transect 5) provides further support for the hypotheses of hurricane damage and anthropogenic pollution resulting in eutrophication. Coral forms are generally minimal, while coraline algae is extremely dominant. This transect is located closest to Suva. Potentially effluent from Suva is resulting from eutrophication of coralline algae, which has overgrown coral colonies. That this condition has persisted for several years is indicated by the lacking dead coral which, when found elsewhere may have resulted from hurricane damage in 1992. Apparently coral here are simply incapable of large-scale establishment due to algal overgrowth.
§Analysis of Coral Forms by Transect and Location
Analysis of location of coral forms shows that Acropora Digitate (16) was only found in transects located near passages (transects 2 and 3). This curious finding might indicate that this form is most resilient to either salinity changes or excess nutrients. Possibly algal overgrowth wouldn’t affect this form as much as others because the digit-like projections may obstruct excessive accumulation.
Acropora branching appears very adaptable. This form was found in all transects excepting one (15). Possibly this form requires some moderate wave action for survival. Another possibility is that it is quick to recruit following destructive events.
Acropora submassive (12) was found primarily in transects 3, 4, and 5, while Coral submassive (17) was only located in transects 3 and 4. Possibly submassive coral forms are less resistant to excess wave impact. Another possibility is that these forms were not destroyed by the hurricane because the shelter prevented their destruction and they are actually more resistant to wave impact than other forms (other forms evident in these transects may be primarily newly recruited). If the later where the case, the relative over-all low numbers of these forms might indicate that submassive forms were not particularly abundant previously and those somewhat sheltered from hurricanes have relatively high potential to survive.
Coral massive (18) was evident in all transects. This indicates that these forms are either quick to repopulate or are highly resilient. Resilience may result from their oval shape and compacted structure. Interestingly this form was primarily observed near potential fresh water inflow; transect 4 with no direct lagoon contact had very few massive forms.
Coral encrusting (19) was surprisingly abundant in transects 1, 2, and 5, while nearly absent from transects 3 and 4. Transects 3 and 4 appear, from previous analysis, to be the most diverse and abundant transects. This seems to indicate that these encrusting forms either require high wave impact, or are early stages of other forms which succession or growth has already eliminated in transects 3 and 4.
§Potential Impact of Salinity and Temperature
Salinity measurements indicated generally low salinity levels for all transects. (23.6 ppt. average) Interestingly, transect 1 which would be expected to have the lowest salinity due to it’s continual exposure to lagoon waters evinced the highest (31 ppt.) The general low salinity could be a cause for general unhealth of the reef. Salinity of 50% seawater (approx. 16 ppt.) has been shown to kill most species of coral during exposure over 30 minutes (Jones and Endean 1976: 220). Low salinity levels seem to be the norm on this reef; certainly this must have a negative impact. Further studies would useful to make confident determination of the effect of salinity on the different areas of the reef. Some of the five salinity measurements taken may indicate anomalies resulting from tidal fluctuations or differences in rainfall patterns. The high salinity evident in transect 1 is probably due to the excessive dry period just preceding our measurement.
Temperature measurements for all transects appear to be within the range comfortable for coral survival (avg. temperature was 25.8° C). No temperature recording even approached 18° C, the minimum for survival of most hard coral species (Jones & Endean 1976: 221 ).
§Summary and Conclusions
Examination of our results suggests that the Suva Barrier Reef is negatively affected by freshwater input, effluent from Suva, and hurricanes. The reef currently appears to be in a general state of unhealth. This unhealth is exemplified by the large amounts of dead coral and relative paucity of diversity over the transect areas compared to all other reefs I have qualitatively observed.
The hurricane of 1992 that impacted the Suva area is probably the primary causative factor for the large amount of dead coral observed. Evidence for hurricane damage is shown by examination of transects near islands adjacent to the reef. These transects displayed greater diversity and abundance than other transects, indicating that the islands provided some amount of protection.
Evidence for pollution from the Suva area is provided by the increased algae growth on transects near to or directly facing the lagoon, those closest to Suva, and those near passages with greater lagoon water efflux. The relative abundance of lagoon water and distance from Suva to algae accumulation appear to show a causative relationship. This relationship can only confidently be determined with further sampling and transects.
Salinity levels were low for all transect areas studied. The influx of fresh water from inland and rain sources is probably another cause for the overall state of unhealth. Further studies should focus on measuring salinity at different times on both sides of the reef in conjunction with transects studied at the same point on either side. In this study only one transect on the lagoon side was examined. The reef on the lagoon side would tend to be more susceptible to effluent from Suva than reef on the ocean side; the lagoon side is exposed to waters potentially affected by Suva all of the time while the ocean side is primarily only exposed during high tide. For confident conclusions, more transects are necessary to see if the lack of coral species on the lagoon side is anomalous. Temperature does not appear to be a detrimental factor influencing this reef. We found preliminary evidence for succession patterns and factors affecting coral types. Acropora branching and coral massive appear to be either relatively resilient or quick to recolonize. Both forms seem adaptable to many different environments. Submassive forms appear either less resistant to wave action, or, conversely, relatively more resistant with remaining forms possibly acting as hurricane survivors.
Encrusting forms appear to be an earlier development of other forms identified. Future studies should examine this hypothesis. If encrusting forms are not an earlier stage of other forms, it is important to determine why they were only abundant when other forms were less common. Hypotheses such as competitive exclusion should be considered. Acropora digitate was found only near passages. Further studies should examine the effects of salinity and nutrients on this species.
In summary, future studies of this area are necessary to determine the causative factors for the current poor state of the Suva Barrier Reef. Variables such as pollution and salinity effects should be measured through water sampling and testing. Nutrient studies should concentrate on measuring dissolved nitrogen and phosphorous which may be causing algae growth. Such studies would help determine if transect one, which had the highest algal growth and most direct proximity to Suva is receiving excessive nitrogen or phosphorus which can cause eutrophication (Begon et al. 1990: 670). More transects of both sides of the reef, in conjunction with water tests would allow for confident determination of factors influential for patterns of abundance. Factors influencing individual species distribution should be further examined. With accurate knowledge of this reef, further damage might be limited.
§Literature Cited
- Baker, J. and Williamson, J. 1986. Toxins and Beneficial Products from Reef Organisms. Oceanus. 29: 109-115
- Begon, M., Harper, J., and Townsend, C. 1990. Ecology: Individuals, Populations, and Communities. Blackwell Scientific Publications. Boston.
- Burns, T. 1985. Hard-Coral Distribution and Cold-Water Disturbances in South Florida: Variation with Depth and Location. Coral Reefs. 4: 117-124
- Chiappone, and Sullivan, K. 1991. A Comparison of Line Transect Versus Linear Percentage Sampling for Evaluating Stony Coral (Scleractinia and Milleporina) Community Similarity and Area Coverage on Reefs of the Central Bahamas. Coral Reefs. 10: 139-154
- Jones, O., and Endean, R. (eds.) 1976. Biology and Geology of coral Reefs (Volume lll). Academic Press. New York.
- Knowlton, N., Lang, J., and Keller, B. 1990. Case Study of Natural Population Collapse: Post-Hurricane Predation on Jamaican Staghorn Corals. Smithsonian Contributions to the Marine Sciences. Number 31
- Moran, D., and Reaka-Kudla, M. 1991. Effects of Disturbance: Disruption and Enhancement of Coral Reef Cryptofaunal Populations by Hurricanes. Coral Reefs. 9: 215-224
- Rogers, C., Gilnack, M., and Fitz, H. 1983. Monitoring of Coral reefs with Linear Transects: a Study of Storm Damage. Journal of Experimental Marine Biology and Ecology. 66: 285-300
- Sammarco, P., Cole, J., and Barre, S. 1985. Competitive Strategies of Soft Corals (Coelenterate: Octocorallia). II. Variable Defensive Responses and Susceptibility to Scleractinian Corals. Journal of Experimental Marine Biology and Ecology. 91: 199-215
- Sheehan, P. 1985. Reefs are not so Different -- They Follow the Evolutionary Pattern of Level Bottom Communities. Geology. January: 46-49
- Spurgeon, J. 1992. The Economic Valuation of Coral Reefs. Marine Pollution Bulletin 24(11): 529-536
- Titlyanov, E., and Latypov, Y. 1991. Light-Dependence in Scleractinian distribution in the sublittoral zone of South China Sea Islands. Coral Reefs. 10: 133-138
- Waldrop, M. 1992. Complexity: The Emerging Science at the Edge of Order and Chaos. Simon & Schuster. New York.
- Williams, L., and Williams, E. 1990. Global Assault on Coral Reefs: What’s Killing the Great Reefs of the World? Natural History. 4: 47-54
- Wittenberg, M., and Hunte, W. 1992. Effects of Eutrophication and Sedimentation on Juvenile Corals: I. Abundance, Mortality, and Community Structure. Marine Biology. 112: 131-138
| Primary Category | Sub Category | Code |
|---|---|---|
| Hard Coral: | ||
| Dead Coral | DC | |
| Dead Coral with Algae | DCA | |
| Acropora | Branching | ACB |
| Encrusting | ACE | |
| Submassive | ACS | |
| Digitate | ACD | |
| Tabulate | ACT | |
| Non-Acropera | Branching | CB |
| Encrusting | CE | |
| Foliose | CF | |
| Massive | CM | |
| Submassive | CS | |
| Mushroom | CMR | |
| Millepora | CME | |
| Heliopora | CHL | |
| Other Fauna | ||
| Soft Coral | SC | |
| Sponges | SP | |
| Zoanthids | ZO | |
| Others | OT | |
| Algae | Algal Assemblage | AA |
| Coralline Algae | CA | |
| Halimeda | HA | |
| Macroalgae | MA | |
| Turf Algae | TA | |
| Abiotic | ||
| Sand | S | |
| Rubble | RB | |
| Silt | SI | |
| Water | WA | |
| Rock | RCK |
§Figures and tables in this chapter
The captions as listed in the manuscript. The plates themselves are in the figure appendix.
- Table 2: Lifeform Categories and Codes
- Figure 1: Percent Composition of all Categories for Transect One
- Figure 2: Percent Composition of all Categories for Transect Two
- Figure 3: Percent Composition for all Categories for Transect Three
- Figure 4: Percent Composition of all Categories for Transect Four
- Figure 5: Percent Composition for All Categories for Transect Five
- Figure 6: Site Map of Transects
- Figure 7: Percent Relative Abundance of Reef Components by Site
- Figure 8: Percent Sand by Site
- Figure 9: Percent Algal Assemblage by Site
- Figure 10: Percent Dead Coral by Site
- Figure 11: Percent Coral Tabulate by Site
- Figure 12: Percent Acropera Submassive by Site
- Figure 13: Percent Acropera Tabulate by Site
- Figure 14: Percent Soft Coral by Site
- Figure 15: Percent Acopera Branching by Site
- Figure 16: Percent Acropera Digitate by Site
- Figure 17: Percent Coral Submassive by Site
- Figure 18: Percent Coral Massive by Site
- Figure 19: Percent Coral Encrusting by Site
- Figure 20: Percent Rubble by Site
- Figure 21: Percent Rock by Site